31
available online at www.ssbfnet.com
A Study on Management of Non Performing Assets in Priority Sector reference
to Indian Bank and Public Sector Banks (PSBs)
B.Selvarajan
a, G. Vadivalagan, PhD
b a Research Scholar, Anna University, Chennaib Professor, Dhanalakshmi Srinivasan College of Engineering, Navakkarai Post, Coimbatore
Abstract
The problem of NPA is not limited to only Indian public sector banks, but it prevails in the entire banking industry. Major portion of bad debts in Indian Banks arose out of lending to the priority sector at the dictates of politicians and bureaucrats. If only banks had monitored their loans effectively, the bad debt problem could have been contained if not eliminated. The present study has been designed to illustrate the necessity and the nature of the non-performing assets in Indian Bank, Tamil Nadu. Finding out Non Performing Assets –NPA- under the Priority sector lending in Indian Bank and Compare with Public Sector Banks and making appropriate suggestions to avoid future NPAs and to manage existing NPAs in Indian Bank are the other major objectives of this study. The scope of this study covers on the basis: (i) measuring for the banks to avoid future NPAs & to reduce existing NPAs, (ii) guiding for the government in creating & implementing new strategies to control NPAs, (iii) selecting appropriate techniques suited to manage the NPAs and develop a time bound action plan to arrest the growth of NPAs.
Keywords:Banking, NPA, Private, Public, Credits
© 2013 Published by SSBFNET
1. Introduction
For any nation, banking system plays a vital role in the development of its sound economy. India is not an exception. Bankers are the custodians and distributors of the liquid capital of the country. The foremost function of the banking system is to mobilize the savings of the people by accepting deposits from the public. The banker becomes the trustee of the surplus balances of the public. Here-in-lies the onerous duty of the banker is in stimulating the mobilization of surpluses. Well - knit banking systems secure a good foundation for a Nation’s Industrial and Economic Progress. The role of banking in promoting development and growth, especially in the context of planning to break the vicious cycle of poverty and to retrieve the economy from the trap of under-development is a matter of paramount importance, particularly when our country is on the way of development. Deposit mobilization promotes the economic prosperity by controlling the money circulation and canalizing for development and productive purposes. In order to mobilize deposits, the commercial banks undertake deposit mobilization through various deposit schemes suited to the different sections of the people. As the growth of the bank deposits is the key element in the progress of the banking business, bankers spend more time and man power in the mobilization of deposits. The deposits along with other sources of funds, namely, capital, reserves and borrowings, form the sources of funds for the banks. The lending and investment activities of the bank are based on the sources of funds.
In India the magnitude of the problem of bad debts was not taken seriously. Subsequently, following the recommendations of Narasimham committee and Verma committee, some steps have been taken to solve the problem of old NPAs in the balance sheets of the banks. It continues to be expressed from every corner that there has rarely been any systematic evaluation of the best way of tackling the problem. There seems to be no unanimity in the proper policies to be followed in resolving this problem. There is also no consistency in the application of NPA norms, ever since these have been recognized. NPA concerns of individual banks summarized as a whole and expressed as a
32
mathematical average, for the entire bank cannot convey a dependable picture. The scenario is not so simple to be generalized for the industry as a whole to prescribe a readymade package of a common solution for all banks and for all times.
The problem of NPA is not limited to only Indian public sector banks, but it prevails in the entire banking industry. Major portion of bad debts in Indian Banks arose out of lending to the priority sector at the dictates of politicians and bureaucrats. If only banks had monitored their loans effectively, the bad debt problem could have been contained if not eliminated. The top management of the banks was forced by politicians and bureaucrats to throw good money after bad in the case of unscrupulous borrowers. Agriculture advances have registered a 7 fold net increase, SSI advances have set a record net increase of 8.5 times and the advances to other priority sector have made a net increase of 4.5 times, that of their respective figures in 2001–02. The overall Priority sector advances have registered a 6.5 fold increase over that of 2001–02 in 10 years period. Indian Bank has been successful in controlling the NPAs. The NPAs have been reduced from `791.98 crores in 2001-02 to `223.00 crores in 2008-09. However in 2009-10 and 2010-11, the NPAs have grown at an alarming rate from `223 crores in 2008-09 to `495.00 crores in 2010-11 in two years. However, Indian Bank could register a net decrease in NPAs by `296.98 crores in 10 years. In case of Public Sector Banks, the NPAs have shown a slow decreasing trend from 2001-02 to 2005-06 and then there are fluctuations upto 2010-11. An alarming increase in NPAs in Public Sector Banks is seen in 2009-10 and 2010-11 and registered a net increase of `16105.66 crores in 10 years. The growth of Indian Bank’s lending to Priority sector is more than that of the Public Sector Banks as a whole. In case of NPA management, the performance of Indian Bank is better than that of Public Sector Banks as a whole
The present study has been designed to achieve these objectives: (i) to know and study about the non-performing assets in Indian Bank, Tamil Nadu, (ii) to find out Non Performing Assets under the Priority sector lending in Indian Bank and Compare with Public Sector Banks (PSBs), (iii) to make appropriate suggestions to avoid future NPAs and to manage existing NPAs in Indian Bank. The major scope of this study covers on the basis: ( I) measureing for the banks to avoid future NPAs & to reduce existing NPAs, (ii) guiding for the government in creating & implementing new strategies to control NPAs, (iii) selecting appropriate techniques suited to manage the NPAs and develop a time bound action plan to arrest the growth of NPAs.
The study is limited to the functions of Indian Bank, Tamilnadu pertaining to its management of NPAs and profitability. Thus, the important limitations are as follows; (i) the study on management of non-performing assets is limited to the Indian Bank, (ii) the data are collected from Indian Bank till the end of March, 2011, (ii) the basis for identifying non-performing assets is taken from the Reserve Bank of India circulars, (iii) since non-performing assets are critical, bank officials are not willing to part with all the information with them, (iv) reasons for NPAs and Management of NPAs are changing with the time. The study is done in the present environment without foreseeing future developments.
2. The Concept of NPA
The banks, in their books, have different kind of assets, such as cash in hand, balances with other banks, investment, loans and advances, fixed assets and other assets. The Non Performing Asset (NPA) concept is restricted to loans, advances and investments. As long as an asset generates the income expected from it and does not disclose any unusual risk other than normal commercial risk, it is treated as performing asset, and when it fails to generate the expected income it becomes a “Non Performing Asset”. In other words, a loan asset becomes a Non Performing Asset (NPA) when it ceases to generate income, i.e. interest, fees, commission or any other dues for the bank for more than 90 days. A NPA is an advance where payment of interest or repayment of installment on principal or both remains unpaid for a period of two quarters or more and if they have become ‘past due’. An amount under any of the credit facilities is to be treated as past due when it remain unpaid for 30 days beyond due date.
Non Performing Assets are also called as Non Performing Loans. It is made by a bank or finance company on which repayments or interest payments are not being made on time. A loan is an asset for a bank as the interest payments and the repayment of the principal create a stream of cash flows. It is from the interest payments that a bank makes its profits. Banks usually treat assets as non-performing if they are not serviced for some time. If payments are late for a short time, a loan is classified as past due and once a payment becomes really late (usually 90 days), the loan is
33
classified as non-performing. A high level of non-performing assets, compared to similar lenders, may be a sign of problems.
3. Methodology
3.1 Statement of Problem
Non-performing assets of banks are one of the biggest hurdles in the way of socio-economic development of India. The level of NPAs of the banking system in India is still too high. It affects the financial standing of the banks so that it is a heavy burden to the banks. A vigorous effort has to be made by the banks to strengthen their internal control and risk management systems and to setup early warning signals for timely detection and action. The problem of NPAs is tied up with the issue of legal reforms. This is an area which requires urgent consideration as the present system that substantially delays in arriving at a legal solution of a dispute is simply not tenable. The absence of a quick and efficient system of legal redress constitutes an important ‘moral hazard’ in the financial sector, as it encourages imprudent borrowers. NPAs can create many challenges. Some of the important challenges are:
1. Owners do not receive a market return on their capital. In the worst case, if the bank fails, owners lose their assets. In modern times, this may affect a broad pool of shareholders.
2. Depositors do not receive a market return on savings. In the worst case if the bank fails, depositors lose their assets or uninsured balance. Banks also redistribute losses to other borrowers by charging higher interest rates. Lower deposit rates and higher lending rates repress savings and financial markets, which hampers economic growth.
3. Non Performing loans epitomize bad investment. They misallocate credit from good projects, which do not receive funding, to failed projects. Bad investment ends up in misallocation of capital, labour and natural resources. The economy performs below its production potential.
4. Non Performing loans may spill over the banking system and contract the money stock, which may lead to economic contraction. This spillover effect can channelize through illiquidity or bank insolvency: (i) when many borrowers fail to pay interest, banks may experience liquidity shortages. These shortages can jam payments across the country, (ii) Illiquidity constraints bank in paying depositors e.g. cashing their paychecks. Banking panic follows a run on banks by depositors as part of the national money stock become inoperative. The money stock contracts and economic contraction follows, (iii) under capitalized banks exceeds the bank’s capital base.
The problem of NPA is not limited to only Indian public sector banks, but it prevails in the entire banking industry. Major portion of bad debts in Indian Banks arose out of lending to the priority sector at the dictates of politicians and bureaucrats. If only banks had monitored their loans effectively, the bad debt problem could have been contained if not eliminated. The top management of the banks was forced by politicians and bureaucrats to throw good money after bad in the case of unscrupulous borrowers. Many big borrowers defaulted only due to the recession in the economy. The absence of proper bankruptcy laws and the dilatory legal procedure in enforcing security rights are the root cause of bad debts in banks. Added to these, there are many other reasons why public sector banks have highest level of NPAs. The NPA problem of banking institutions in India is exaggerated by deriving NPA figures based on percentage against risk assets instead of total earning assets. To improve recovery and to minimize NPAs, banks are expected to do a continuous recovery exercise through various methods adopting newer strategies. Besides, the borrowers are to be educated again and again about the benefits they derive from bank loans comparing to the local money lenders. The defaulters with genuine reason must be taken care of by the banks. But this attitude becomes an act of mockery when blanket write-off is affected. The above are various issues faced by banks related to lending and recovery. Banks cannot stop lending. Lending will continue, recovery also must be continued. This study aims at a thorough analysis of the functions of a bank in lending and recovery with special reference to Indian Bank, in the present competitive, deregulated and technologically improved banking environment.
34 3.2. Research Design
The research design used to carry out this study is descriptive research because it deals with statistical data and the main aim of the report is to describe the factors affecting the problem mentioned. The present study is an analytical study. For this study, primary data and secondary data are collected. The primary data is collected from the borrowers with the help of questionnaire. The secondary data is collected from the annual reports of Indian Bank and Reserve Bank of India website.
3.3. Sources of Data
The data collected is mainly secondary in nature. The sources of data for this thesis include the literature published by Indian Bank and the Reserve Bank of India, various magazines dealing with the current banking scenario and research papers.
4. Priority Sector Analysis
Since Nationalization of major commercial banks in 1969, banking sector has been utilized as a powerful vehicle to carry on the Government’s development programmes. The priority sector activities have been given adequate financial assistance through Banks. Among the 20 point programmes announced by the Prime Minister, Mrs. Indira Gandhi, poverty alleviation, creation of employment opportunities, promotion of self employment, protection and promotion of village and cottage industries, encouraging entrepreneurs and similar socio economic development programmes were given top priority. Thus various employment generation activities, Agricultural development activities and activities related to small Scale industries have been classified under priority sector. In other words, some areas of fields in a country, depending on its economic condition or government interest are called Priority Sectors, i.e. industry and agriculture. These may further be sub-divided. Banks are directed by the central bank of the country that loans must be given on reduced rates of interest with discounts to promote these fields; such lending is called Prime Sector Lending. Priority sector was first properly announced in 1972, after the National Credit Council emphasized that there should be a larger involvement of the commercial banks in the priority sector. In 1974, the banks were given a target of 33.33 % as share of the priority sector in the total bank credit. This was later revised on the recommendation of the Dr. K S Krishnaswamy committee and raised to 40%. RBI has divided the Priority Sector into the following categories. The main areas under Priority Sector Lending scheme are Agriculture, Small Scale Industries, Small business/Service enterprises (small business, retail trade, professional and self employed, small road and water transport operations), State sponsored organizations for SC/ST, Educational Loan, Housing Loan, Consumption Loan, Micro credit, Loans to software industry, Food and agro procession sector, Venture capital, Export credit
The Government of India through the instructions of Reserve Bank of India (RBI) mandates certain type of lending on the Banks operating in India, irrespective of their origin. RBI sets targets in terms of percentage (of total money lent by the Banks) to be lent to certain sectors, which in RBI's perception would not have access to organized lending market or could not afford to pay the interest at the commercial rate. This type of lending is called Priority Sector Lending. Financing of Small Scale Industry, Small business, Agricultural Activities, Export activities and the activities narrated in the previous paragraphs are fall under this category.
4.1 Analysis of advances granted to Agriculture by Public Sector Banks (PSBs) and by Indian Bank in Particular
This analysis will help to evaluate the performance of Indian Bank in helping the agricultural development in India. The following few tables are prepared to study the role of Indian Bank is helping the agriculture in India.
4.1.1. Priority Sector Advances- Indian Bank
Table I gives the total Priority sector advances of Indian bank. Further this table gives the quantum of advances made by Indian Bank under three major heads of Priority sector, namely, Agriculture, SSI and Other Priority sector. These figures are collected to get an idea about the lending of Indian Bank under Priority sector advances for a period of 10 years from 2001-2002 to 2010-2011.
35
Table 1: Priority Sector Advances- Indian Bank (` in Crores)
Year Agriculture Advances SSI Advances Other Priority Sector
Advances Priority Sector Advances 2001 – 2002 1,526.69 (38.30%) 886.06 (22.23%) 1573.80 (39.47%) 3986.55 2002 – 2003 1850.30 (37.68%) 1003.00 (20.43%) 2056.98 (41.89%) 4910.28 2003 – 2004 2214.00 (37.08%) 978.00 (16.38%) 2779.11 (46.54%) 5971.11 2004 – 2005 3191.70 (39.38%) 1144.71 (14.12%) 3769.00 (46.50%) 8105.41 2005 – 2006 4248.69 (39.80%) 1521.00 (14.25%) 4905.80 (45.95%) 10675.49 2006 – 2007 5656.08 (42.42%) 2364.45 (17.73%) 5314.43 (39.85%) 13334.96 2007 – 2008 6214.87 (41.53%) 3151.00 (21.06%) 5599.27 (37.41%) 14965.14 2008 – 2009 7618.00(41.96%) 3844.00(21.17%) 6695.00 (36.87%) 18157.00 2009 – 2010 9091.00 (42.42%) 5420.00 (25.29%) 6922.00 (32.29%) 21433.00 2010 - 2011 10986.00 (42.96%) 7549.00 (29.52%) 7038.00 (27.52%) 25573.00 Total 52597.33 (41.38%) 27861.22 (21.91%) 46653.39 (36.71%) 127111.94 Mean 5259.733 (41.38%) 2786.12 (21.91%) 4665.34 (36.71%) 12711.19 Net Increase 9459.31 (41.38%) 6662.94 (21.91%) 5464.20 (36.71%) 21586.45
Source: RBI, Trend & Progress Reports
From the above table it is very clear that Indian Bank has been granting advances to priority sector with an annual growth in every successive year. Thus the growth of Priority sector advances in Indian Bank has set a positive growth throughout the decade of study. Agriculture advances have registered a 7 fold net increase, SSI advances have set a record net increase of 8.5 times and the advances to other priority sector have made a net increase of 4.5 times, that of their respective figures in 2001–02. The overall Priority sector advances have registered a 6.5 fold increase over that of 2001–02 in 10 years period. The Indian Bank has been making advances to Priority sector advances with due share to its major components viz., Agriculture, SSI and Other priority sector.
4.1.2. NPAs in Priority Sector Analysis – INDIAN BANK
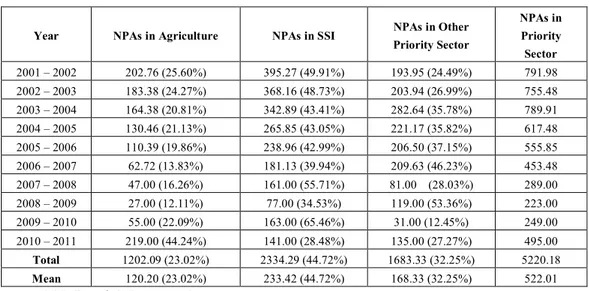
Table II provides the data related to NPAs in Indian Bank with reference to Priority sector advances. Also it provides classified NPA figures under the three major components, namely, Agriculture, SSI and other Priority sector.
Table 2. NPAs in Priority Sector Analysis – Indian Bank, in Crores
Year NPAs in Agriculture NPAs in SSI NPAs in Other
Priority Sector NPAs in Priority Sector 2001 – 2002 202.76 (25.60%) 395.27 (49.91%) 193.95 (24.49%) 791.98 2002 – 2003 183.38 (24.27%) 368.16 (48.73%) 203.94 (26.99%) 755.48 2003 – 2004 164.38 (20.81%) 342.89 (43.41%) 282.64 (35.78%) 789.91 2004 – 2005 130.46 (21.13%) 265.85 (43.05%) 221.17 (35.82%) 617.48 2005 – 2006 110.39 (19.86%) 238.96 (42.99%) 206.50 (37.15%) 555.85 2006 – 2007 62.72 (13.83%) 181.13 (39.94%) 209.63 (46.23%) 453.48 2007 – 2008 47.00 (16.26%) 161.00 (55.71%) 81.00 (28.03%) 289.00 2008 – 2009 27.00 (12.11%) 77.00 (34.53%) 119.00 (53.36%) 223.00 2009 – 2010 55.00 (22.09%) 163.00 (65.46%) 31.00 (12.45%) 249.00 2010 – 2011 219.00 (44.24%) 141.00 (28.48%) 135.00 (27.27%) 495.00 Total 1202.09 (23.02%) 2334.29 (44.72%) 1683.33 (32.25%) 5220.18 Mean 120.20 (23.02%) 233.42 (44.72%) 168.33 (32.25%) 522.01
36
There exists a general opinion that banks have more NPAs in the advances made to Priority sector, as the borrowers under priority sector do not have sufficient means to repay the loans. The above table gives information that Indian Bank could reduce the NPAs in Priority sector advances from `791.98 crores in 2001–02 to `223.00 crores in 2008–09. However the NPAs increased to `495 crores in 2010–11. In agriculture advances the NPAs are reduced by `175.76 crores in 8 years and thereafter it increased. In case of SSI advances the NPAs reduced by `318.27 crores during the same 8 years. In case of other priority sector NPAs fell down to `31 crores from `193.95 crores in 9 years. During the year 2009-10 and 2010–11, the NPAs have raised alarmingly at a higher rate of growth. Indian Bank must be vigilant and the rising trend in NPAs must be arrested immediately.
4.1.3. Priority Sector Advances &NPAs
Table III gives data of both Priority Sector advances and related NPAs for Indian Bank as well as for all Public Sector Banks as a whole. Further the ratio of NPAs in Priority Sector advances to the total Priority Sector advances is calculated and given for all the 10 years for both Indian Bank and for all Public Sector Banks as a whole. This table will facilitate to compare the performance of Indian Bank in making advances to Priority sector and managing the NPAs with that of total Public Sector Banks as a whole.
Table 3: Priority Sector Advances & NPAs, In Crores
Year PSBs Priority sector advances PSBs NPAs in Priority sector % Indian bank Priority sector Advances Indian Bank NPAs in Priority sector % 2001 – 2002 171185.26 25139.34 14.68 3986.55 791.98 19.86 2002 – 2003 203094.92 24938.36 12.28 4910.28 755.48 15.38 2003 – 2004 245671.75 23840.33 9.70 5971.11 789.91 13.22 2004 – 2005 310093.30 23397.38 7.55 8105.41 617.48 7.62 2005 – 2006 410379.05 22373.74 5.55 10675.49 555.85 5.21 2006 – 2007 521180.24 22953.62 4.40 13334.96 453.48 3.40 2007 – 2008 608962.89 25286.67 4.15 14965.14 289.00 1.93 2008 – 2009 719497.00 24318.00 3.38 18157.00 223.00 1.22 2009 – 2010 864562.00 30848.00 3.57 21433.00 249.00 1.16 2010 - 2011 1028616 41245.00 4.01 25573.00 495.00 1.93 Total 5083242.41 264340.44 5.20 127111.94 5220.18 4.11 Mean 508324.24 26434.04 5.20 12711.19 522.01 4.11
Source: RBI, Trend & Progress Reports
The table explains that Priority sector advances in Indian Bank have set a record of continuous growth with annual positive increase in the quantum of advances. Similar increasing trend is registered in case of Priority sector advances of Total Public Sector Banks. This table established an important fact that Indian Bank’s performance in making advances to priority sector is almost around 2.5% of the priority sector advances of Public Sector Banks. Thus the growth in priority sector advances in Indian Bank is in tune with the growth in the priority sector advances of total Public Sector Banks. In case of NPAs in Priority Sector advances, Indian Bank has been successful in controlling the NPAs. The NPAs have been reduced from `791.98 crores in 2001-02 to `223.00 crores in 2008-09. However in 2009-10 and 202009-10-11, the NPAs have grown at an alarming rate from `223 crores in 2008-09 to `495.00 crores in 202009-10-11 in two years. However, Indian Bank could register a net decrease in NPAs by `296.98 crores in 10 years. In case of Public Sector Banks, the NPAs have shown a slow decreasing trend from 2001-02 to 2005-06 and then there are fluctuations upto 2010-11. An alarming increase in NPAs in Public Sector Banks is seen in 2009-10 and 2010-11 and registered a net increase of `16105.66 crores in 10 years. Thus the total Public sector Banks as a whole have failed in controlling the NPAs as is seen from their performance in 10 years from 2001-02. While comparing with the performance of lending to priority sector, Indian Bank is in tune with that of all Public Sector Banks. But in case of managing NPAs, Indian Bank has shown its potentials and efficiency in controlling NPAs as it could minimize the
37
NPAs in 10 years. During the same period NPAs have gone up in case of all Public sector Banks in total. Thus this table gives an inference that Indian Bank is above the industry level in its best management of NPAs.
4.1.4. Agriculture Advances- PSBs & Indian Bank
Table No IV is formulated with the data regarding the NPAs in agriculture advances in Indian Bank and in the Public Sector Banks as a whole for the study period of 10 years from 2001-02. This table also gives the figures of total agriculture advances made by Indian Bank as well as the total Public Sector Banks. Besides the quantum of agricultural advances and quantum of NPAs in agriculture advances, the table also exhibits the percentage of NPAs in Public Sector Banks and percentage of NPAs in Indian Bank with reference to their total agriculture advances respectively. These data help to evaluate the performance of NPA management in Indian Bank in comparison to that of Public Sector Banks as a whole.
Table 4 : Agriculture Advances- PSB & Indian Bank
Year PSBs Agriculture Advances PSBs NPAs in Agriculture Sector % Indian bank Agriculture Advances
Indian bank NPAs in
Agriculture Sector in Crores %
2001 – 2002 63082.99 7821.54 12.39 1526.69 202.76 13.28 2002 – 2003 73507.06 7707.35 10.48 1850.30 183.38 9.91 2003 – 2004 86186.77 7240.30 8.40 2214.00 164.38 7.42 2004 – 2005 112474.95 7254.05 6.45 3191.70 130.46 4.08 2005 – 2006 154900.12 6202.92 4.01 4248.69 110.39 2.59 2006 – 2007 205090.96 6506.34 3.17 5656.08 62.72 1.11 2007 – 2008 248685.26 8268.03 3.32 6214.87 47.00 0.756 2008 – 2009 296858 5708.00 1.92 7618.00 27.00 0.354 2009 – 2010 370729 8330.00 2.24 9091.00 55.00 0.604 2010 - 2011 414990.00 14487.00 3.49 10986.00 219.00 1.99 Total 2026505.11 79525.53 55.89 52597.33 1202.09 42.12 Mean 202650.51 7952.55 3.92 5259.73 120.20 2.29
Source: RBI, Trends & Progress reports
Prevalence of NPAs in a bank in any type of advance is inevitable. But the growth in NPAs affects the growth in advances; it poses threat to the Bank’s credit performance. The above table states clearly that Indian Bank has been successful in containing the NPAs in agriculture advances upto the year 2008-09. The decreasing trend of NPAs level has been reversed from 2009-10 and the NPAs increased very sharply to touch the highest level of the decade (`219.00 crores). Though the quantum of NPAs have shown a net increase of `16.24 crores in 10 years (`219.00 crores-`202.76 crores), the percentage of NPAs to total agriculture advances is reduced from 13.28 to 1.99. Another interesting inference is that, the net increase in total agriculture advances is `29459.31 crores, the net increase in NPAs is `16.24 crores in 10 years and the percentage of net increase of NPAs on net increase of agriculture advances is less than 0.2 only. Thus Indian Bank takes cautious approach in lending and takes steps to control NPAs.
In case of Public Sector Banks, it is evident that NPAs in agriculture advances have been controlled effectively upto 2008-09 and thereafter the NPAs increased sharply. Thus decrease in NPAs in Indian Bank upto 2008-09 is in tune with that of Public Sector Banks as a whole. Further, the NPAs increased sharply in the years 2009-10 and 2010-11 both in Indian Bank as well as in the whole of Public Sector Banks. So, the inference is 2009-10 and 2010-11 are the years in which NPAs increased in all the banks. As in the case of Indian Bank, in Public Sector Banks also, there is a net increase in the quantum of NPAs (`6665.46 crores) in 10 years, but in Public Sector Banks the percentage of NPA to total agriculture advances has come down from 12.39 in 2001-02 to 3.49 in 2010-11. A careful study of this table 4.9 indicates clearly that the NPA management of Indian Bank is better than the NPA management of Public Sector Banks as a whole. This is evidenced by the fact that the percentage of NPAs to agriculture advances in Indian Bank is always less than that of Public Sector Banks throughout the decade of study. (Mean NPA percentage to Indian Bank is 2.29and Mean NPA percentage of Public Sector Banks is 3.92). Indian Bank’s Management has to be appreciated
38
for its judicious lending and effective control of NPAs simultaneously. However, the sharp growth of NPAs in the years 2009-10 and 2010-11 gives an alarming signal to the management of Indian Bank. Indian Bank has to take adequate and appropriate steps to reverse this growing trend in NPAs as quickly as possible.
4.1.5. PSBs & Indian Bank – SSI Advances
Table V picturises information about SSI advances made by Indian Bank as well as whole of Public Sector Banks for the period of 10 years from 2001–02. The data given in the table, namely the quantum of SSI advances, quantum of NPAs related to SSI advances and percentage of NPAs in SSI advances are duly tabulated in case of Indian Bank and Public Sector Banks as a whole. The data given in this table helps to analyze the management efficiency, in controlling NPAs both of Indian Bank and of the whole of Public Sector Banks. Their performance in NPA management may also be compared.
Table 5: PSBs & Indian Bank – SSI Advances, In Crores
Year PSBs SSI Advances PSBs NPAs in SSI Advances % Indian bank SSI Advances
Indian bank NPAs
in SSI Advances % 2001 – 2002 51186.87 10583.95 20.67 886.06 395.27 44.61 2002 – 2003 52987.00 10161.53 19.17 1003.00 368.16 36.71 2003 – 2004 58310.00 8837.92 15.15 978.00 342.89 35.06 2004 – 2005 67634.00 7834.96 11.58 1144.71 265.85 23.22 2005 – 2006 82492.00 6917.40 8.38 1521.00 238.96 15.71 2006 – 2007 104703.00 5843.28 5.58 2364.45 181.13 7.66 2007 – 2008 148651.00 5804.75 3.90 3151.00 161.00 5.11 2008 – 2009 190968.00 6984.00 3.65 3844.00 77.00 2.00 2009 – 2010 264828.00 11537.00 4.35 5420.00 163.00 3.01 2010 - 2011 376627.00 14340.00 3.81 7549.00 141.00 1.86 Total 1398386.87 88844.79 6.35 27861.22 2334.29 8.38 Mean 139838.68 8884.47 6.35 2786.12 233.42 8.38
Source: RBI, Trend & Progress Reports
NPAs create obstacles on the path of growth in the business of banks, particularly in the growth of credit disbursement. The above table gives the quantum of SSI advances and NPAs related to SSI advances in Indian Bank as well as that of Public Sector Banks as a whole for the period of study. Contrary to this growth, a drastic reduction is seen in NPAs with a net fall of `254.27 crores during the same period. Percentage of NPAs in total SSI advances has come down from 44.61 in 2001-02 to 1.86 in 2010-11. This continuous annual reduction of NPA percentage indicates the effective NPA management practiced in Indian Bank.
Similar to the positive growth trend in SSI advances in Indian Bank, a positive continuous growth is registered in Public Sector Banks as a whole. The SSI advances has grown 7 times in Public Sector Banks, where as in Indian Bank, the growth is 8.5 times during the same 10 years period. The percentage of NPAs in total SSI advances in Public Sector Banks as a whole has come down from 20.67 in 2001-02 to 3.81 in 2010-11. An in-depth analysis of this table indicates that the reduction rate of percentage of NPAs in SSI advances is faster in Indian Bank than in Public Sector Banks. From 2001-02 to 2007-08, the NPA percentage in SSI advances in Indian Bank is higher than that of the industry average i.e. of public sector Banks. From 2008-09, Indian Bank has shown its efficiency in controlling of NPAs and this is evidenced in this table, i.e., from 2008-09 the percentage of NPAs in Indian Bank has been less than that of the whole of Public Sector Banks. Thus Indian Bank has taken all possible steps to grant loans to SSI units and at the same time it takes judicious steps to control the NPAs.
4.1.6. PSBs & Indian Bank – Other Priority Sector Advances
Table No. VI provides the data regarding the advances made by Indian Bank as well as all Public sector Banks as a whole under other priority sector and the respective NPAs. The percentage of NPAs with references to the total other
39
priority sector an advance has been calculated per year for both Indian Bank and Public Sector Banks as a whole. These data viz, other priority sector advances, NPAs, the percentage of NPAs for the whole period of study facilitate to assess the performance of Indian Bank in comparison with the Public Sector Banks as a whole in the areas of lending to Other Priority Sector, management of NPAs and their related trends such as increase in Other Priority Sector advances and decrease in NPAs. More particularly these data helps to evaluate the management of NPAs in Indian Bank comparing it to that of Public Sector Banks as a whole.
Table 6: PSBs & Indian Bank – Other Priority Sector Advances, In Crores
Source: RBI, Trend & Progress Reports
Other priority sector advances are those advances made to various activities/purpose under priority sector other than agriculture and SSI. There are loans to professionals and self employed, small business, education, rural housing, small road transport operators, etc and these are classified under other priority sector advances. The above table illustrates the growth of advances to other priority sector and at the same time the fluctuations in the NPA position both in Indian Bank and in Public Sector Banks as a whole. The increase in advances to other priority sector by Indian Bank is continuous throughout the decade with annual positive growth. Similarly the growth is continuous in Public Sector Banks also except a small set back in the year 2009-10. However both Indian Bank and Public Sector Banks as a whole have registered a sizeable net growth in 10 years and the quantum of advances in 2010-11 is more than four times that of 2001-02. In case of NPAs in Indian Bank, there is no regular decrease or increase. The NPAs in Indian Bank increased annually during the first 3 years of the decade i.e. from 2001-02 to 2003-04 and thereafter decreased for 4 years from 2004-05 to 2007-08. In last three years there is increase and decrease in alternative years. But in case of Public Sector Banks, the NPAs in other priority sector advances has grown annually from 2001-02 to 2008-09 i.e. during the first 8 years. Though the quantum of NPAs has come down in 2009-10, it increased again in 2010-11. These data indicate clearly that Indian Bank has taken steps to reduce NPAs throughout the decade and succeeded to register a net decrease of `58.95 crores, where as in Public Sector Banks as a whole, the management of NPA is inadequate, as a result the net NPA has increased by `5683.15 crores in 10 years.
The percentage of NPAs to other priority sector advances in Public Sector Banks as a whole has shown an average of 5.79 for the decade, whereas the mean for Indian Bank is 3.63. During the first three years of the decade i.e., from 2001-02 to 2003-04, the NPA percentage in Indian Bank is more than that of Public Sector Banks as a whole. In the subsequent years i.e. in the remaining 7 years of the decade, Indian Bank has exhibited its success in controlling NPAs and NPA percentage. This is evidenced from the fact that the NPA percentage is less in Indian Bank than that of Public Sector Banks as a whole from the year 2004-05 to 2010-11. Indian Bank could achieve in controlling the
Year PSBs Other Priority Sector Advances PSBs NPAs in Other Priority Sector % Indian Bank Other Priority Sector Advances
Indian Bank NPAs in Other Priority Sector % 2001 – 2002 56915.40 6733.85 11.8 3 1573.80 193.95 12.32 2002 – 2003 76621.86 7069.48 9.22 2056.98 203.94 9.91 2003 – 2004 101174.98 7762.11 7.67 2779.11 282.64 10.17 2004 – 2005 129984.35 8308.37 6.39 3769.00 221.17 5.86 2005 – 2006 172986.93 9253.43 5.34 4905.80 206.50 4.21 2006 – 2007 211386.28 10604.01 5.01 5314.43 209.63 3.95 2007 – 2008 211626.63 11213.90 5.29 5599.27 81.00 1.45 2008 – 2009 231671.00 11626.00 5.02 6695.00 119.00 1.78 2009 – 2010 229005.00 10981.00 4.81 6922.00 31.00 0.45 2010 - 2011 236999.00 12417.00 5.23 7038.00 135.00 1.92 Total 1658371.43 95969.15 5.79 46653.39 1683.33 3.61 Mean 165837.14 9596.91 5.79 4665.34 168.33 3.61
40
NPAs to 1.92% in 2010-11. But in case of Public Sector Banks it is 5.23 in 2010-11. The inference is that the NPA level in Indian Bank in other priority sector advances is very much controlled when compared to the industry average i.e. that of Public sector Banks.
4.1.7. Weaker Section Advances & NPAs- PSBs & Indian Bank
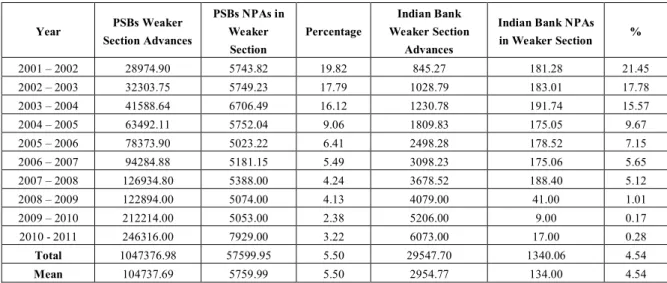
ble VII picturises the position of advances to weaker sections made by Indian Bank as well as the Public Sector Banks as a whole during the study period of ten years from 2001-02. Under priority sector, weaker section borrowers are in all the three major components of priority sector, namely, agriculture, small scale industry and other priority sector. Therefore weaker section advances have been taken separately for the study. This table also provides the NPA position in the advances made to weaker section borrowers with reference to Indian Bank as well as Public Sector Banks as a whole. Further, as an additional tool to analyze the data, the percentage of NPA in the total weaker section advances, both in Indian Bank and in Public Sector Banks as a whole is also given annually. The mean for all the columns is given at the end of the table to facilitate a comparative study within the performance of Indian Bank and with that of Public Sector Banks as a whole.
Table 7: Weaker Section Advances & NPAs- PSBs & Indian Bank, In Crores
Year PSBs Weaker Section Advances PSBs NPAs in Weaker Section Percentage Indian Bank Weaker Section Advances
Indian Bank NPAs
in Weaker Section % 2001 – 2002 28974.90 5743.82 19.82 845.27 181.28 21.45 2002 – 2003 32303.75 5749.23 17.79 1028.79 183.01 17.78 2003 – 2004 41588.64 6706.49 16.12 1230.78 191.74 15.57 2004 – 2005 63492.11 5752.04 9.06 1809.83 175.05 9.67 2005 – 2006 78373.90 5023.22 6.41 2498.28 178.52 7.15 2006 – 2007 94284.88 5181.15 5.49 3098.23 175.06 5.65 2007 – 2008 126934.80 5388.00 4.24 3678.52 188.40 5.12 2008 – 2009 122894.00 5074.00 4.13 4079.00 41.00 1.01 2009 – 2010 212214.00 5053.00 2.38 5206.00 9.00 0.17 2010 - 2011 246316.00 7929.00 3.22 6073.00 17.00 0.28 Total 1047376.98 57599.95 5.50 29547.70 1340.06 4.54 Mean 104737.69 5759.99 5.50 2954.77 134.00 4.54
Source: RBI, Trend & Progress Reports
Weaker section borrowers spread over the entire priority sector domain and they are in agricultural sector, SSI sector and other priority sector. Therefore the figures here are overlapping with those given under the components of priority sector advances. Thus the weaker section advances form part of each component of the priority sector advances. The above table indicates that Indian Bank has given much importance to weaker section advances and therefore the growth is by 7.5 times in 10 years. It was `845.27 crores in 2001–02 and it has risen to `6073 crores in 2010–11. Also in case of Public Sector Banks, the weaker section advances has been given more importance and hence it has grown 8.5 times in ten years. In case of Public Sector Banks, the highest annual growth in weaker section advances is seen in 2007-08 (`32649.92crores). In Indian Bank the highest annual growth is seen in the year 2009-10 (`1127 crores). Regarding NPA management, Indian Bank has taken enough care to see that the NPAs are controlled. Though the quantum of NPAs in Indian Bank fluctuate during the decade, the percentage of NPAs to the weaker section advances show a decreasing trend from 21.45 in 2001-02 to 0.17 in 2009-10 and it raised to 0.28 in 2010-11. Similarly in case of Public Sector Banks, the quantum of NPAs has shown ups and downs throughout the decade, but the percentage of NPA to weaker section advances shows a regular decline from 19.82 in 2001-02 to 2.38 in 2009-10 and it raised to 3.22 in 2010-11. If the percentage of NPA to weaker section advances in Indian Bank is compared to that of Public Sector Banks annually from 2001-02, the inference derived will be; NPAs in Indian Bank was higher than the industry average (industry average is that of Public Sector Banks as a whole) in 6 out of first 7 years of the decade i.e., from
41
2001-02 to 2007-08, except 2003-04. It is interesting to see a drastic reduction in the percentage of NPAs in Indian Bank during the last three years of the decade, of course, a slight increase is in 2010-11 over that of 2009-10. The mean for NPA percentage is almost same for both Indian Bank and Public Sector Banks. The NPA management in Indian Bank is better when compared to that of Public Sector Banks as a whole, because the net reduction in NPA percentage is more in Indian Bank (21.17) than the same in Public sector Banks as a a whole (16.60). Also net reduction of NPAs in quantum is seen in Indian Bank, whereas, net increase in NPAs is seen in Public Sector Banks as a whole. From the year 2008-09, Indian Bank could control NPAs very effectively. The increase of NPAs in 2010-11 must be viewed seriously and Indian Bank must take appropriate steps to contain NPAs in the years to come.
5. Findings & Suggestions
Average percentage of Priority sector advances by Indian Bank is 37.84 of its total advances (statutory requirement is 40%). NPAs in Priority sector advances accounts to 58.71% of total NPAs of Indian Bank. Further, the mean percentage of gross NPAs to total advances in Indian Bank is 2.73. The mean percentage of NPAs in Priority sector advances to total Priority Sector advances is arrived at as 4.11. The incidence of NPAs is more in Priority sector advances. Therefore, Indian Bank has to restrict its advances to Priority Sector to the limit of 40% of total advances. Simultaneously, Indian Bank must take steps to improve recovery in Priority sector advances.
The average percentage of Agricultural advances in Indian Bank is 41.38 of its total Priority Sector advances (Statutory requirement is 18%). The average NPAs in Agricultural advances accounts for 23.03 percent of NPAs in total Priority sector advances. NPAs in Agricultural advances are 2.29 percent of total agricultural advances. Indian Bank extends more credit to Agricultural. At the same time, the bank makes good recovery and thus NPAs are restricted. However, Indian Bank must take all efforts to prevent fresh NPAs in Agricultural advances.
Average lending by Indian Bank to SSI advances is 21.91 percent of the total Priority Sector advances. The mean percentage of NPAs in SSI advances to NPAs in total Priority Sector advances is 44.72. The mean percentage of NPAs in SSI advances to total SSI advances in Indian Bank is 8.38. The performance of Indian Bank is handling SSI advances is not comfortable. The NPAs in SSI advances contribute more to the NPA position of the bank as a whole. The NPAs in SSI sector is alarming. Indian Bank has to do an account wise analysis to identify initial sickness and prevent from becoming NPAs.
Mean of the Other Priority Sector advances for the decade of study is 36.11 percent of total Priority Sector advances in Indian Bank. The average percentage of NPAs in Other Priority Sector advances is 32.25 of the banks NPAs in total Priority Sector advances. The percentage of NPAs in Other Priority Sector advances to total Priority Sector advances. The percentage of NPAs in Other Priority Sector advances to total Other Priority Sector advances in Indian Bank is 3.61 percent, which is above the bank’s average NPA position (2.73). Indian Bank has to take appropriate steps to improve recovery in Other Priority Sector advances. At most care must be taken to ensure prompt recovery without allowing any fresh NPAs.
About 25 percent of total Priority Sector lending by Indian Bank has gone to weaker sections. The average NPA level of weaker section advances to total weaker section advances in Indian Bank is arrived at as 4.54. The incidence of NPAs in weaker section advances is more in Indian Bank. Therefore, the bank must take steps to recovery and reduce NPAs. Efforts are necessary to prevent creation of fresh NPAs.
6. Conclusion:
The Priority sector advances have been analyzed in detail under three major heads, viz., Agriculture, Small Scale Industries and Other Priority Sector. Further weaker section advances, which forms part of Priority sector, have also been studied. The data related to Priority sector advances for 10 years have been collected for Indian Bank and for the Public Sector Banks as a whole. The data have been tabulated comfortably with required percentage calculation and mean calculations. Besides the loans and advances granted under priority sector, the NPA figures have also been tabulated both for Indian Bank and the Public Sector Banks as a whole. The data so provided helped to have an in-depth analysis about the participation of Indian Bank in lending activities to priority sector in comparison with that of the Public Sector Banks as a whole. The growth of Indian Bank’s lending to Priority sector is more than that of the Public Sector Banks as a whole. In case of NPA management, the performance of Indian Bank is better than that of
42
Public Sector Banks as a whole. However, Indian Bank has slippages during the period of study in controlling of NPAs in the early years of the decade. Indian Bank is still not comfortable in the area of NPA management. Therefore, the management of Indian Bank must pay special attention towards the NPA management and take appropriate steps to arrest the creation of new NPAs, besides making recoveries in the existing NPAs. Timely action is essential to ensure future growth of the Bank.
References:
T.N. Anantharam Iyer (1999), “Bank supervision and the Management of Non Performing advances” – The Journal of the Indian Institute of Bankers–April–June, 1999 – p.no.7-9.
K.J. Taori (2000), “Problems and Issues relating to Management of Non Performing Assets of Banks in India” – The Journal of Indian Institute of Bankers – April – June 2000, Volume 2, p.no – 21- 24.
C.R.K. Murthy (2001) – “Branch Level Management of Non Performing Assets: Part III – Effective Management of Civil Litigation” – Vinimaya, Vol.XXI, No.2, 2000 – 2001 p.no: 5-11
Dr. V.S. Kaveri, Faculty, National Institute of Bank Management, Pune,”Prevention of NPAs – Suggested strategies” - IBA Bulletin, August 2001,
Indira Rajaramanan, Gairam Vasishtha – Non Performing Loans of PSU Banks some panel results – Economic and Political Weekly – February 2002
Narendra Kumar - Securitization and Reconstruction of Financial Assets and Enforcement of Security Interest Act, 2002 – The Indian Banker – May 2003
Smt. Ranjana Kumar, Chairperson & Managing Director, Indian Bank, Chennai – Restructuring of Debts: The best bet for bankers and the borrowers – IBA Bulleting Special Issue – March 2003 – p.no:40 – 47
Rajendra Kakker (2004) “NPA Management – Role of Asset Reconstruction Companies” – IBA Bulletin – Volume 4 – p.no: 11- 14 Dr. S.C. Bardia (2004), “Credit Efficiency in Banks: A Comparative Study”, The ICFAI Univesity Press, August 2004, p.no – 60-67
Valasamma Antony – Non Performing Assets – A menace to the Banking Industry – Southern Economist – January 2004 – p.no. 20 – 23
The Hindu – Business Line – 24th August 2011 – Wednesday – P.No.6 - Indian Bank Puts off follow–on offer – Our Bureau – Mumbai – August 23rd
Business Line – 28th October 2011 – Friday – P.No. 12 – Loan recovery, “MAO Style” – Bank of Maharashtra’s Novel imitative – K. Ram Kumar – Mumbai
Business Line – 15th November 2011 – Tuesday – P.No. 7 – slippages in retail, real estate loans may impact banks’ profitability – Our Bureau - Mumbai
The Hindu – Business Line – 12nd January 2012 – Thursday – P.No. 1 – RBI worried over rising bad loans in Priority sector – Calls for data from Commercial banks – K. Ramkumar – Mumbai
The Hindu – Business Line – 20th January 2012 – Friday – P.No. 4 – Banks pitch for higher tax breaks on bad debts provisioning – Our Bureau – Mumbai
Toor. N.S, “Non Performing Advances in Banks concept, practice and Management”, New Delhi, Skylark Publications, 1994. Atul Mohan & Puneet Kapoor, “A practical guide to NPA Bank advances” – Vinod law publications.
Shivpuije C.R & Kaveri. N.S, “Management of NPAs Advances”, Sultan Chand & sons Publications. Mallya K.G, “Beyond the Non Performing Assets”, M/S deepa publications
Banker’s hand book of NPA management, Hyderabad – Banambar Sahoo – Asia Law House.
“Approach to Audit of Banks & Verification of Non Performing Assets:, Venugopal, M/S Noopur publications. Gokul B.Rathi & Smita M. Sondhane, “Non Performing Assets – A Practical Hand Book”, Tanvi Publications. Bidanis. N, “Managing Non Performing Assets in Banks”, Vision Book.
Ramachandra Reddy, “Management of Non Performing Assets in Banks & Financial Institutions”, Serials publications. Sugan C. Jain, “Management of Non Performing Assets in Banks”, RBSA publications, Jaipur.
Gopala Krishnan. T.V, “Management of Non Performing Advances”, Indian Institute of Banking and Finance, North Book Centre, Mumbai.