BearWorks
BearWorks
MSU Graduate Theses
Spring 2020
Development and Validation of Implicit Measures of
Development and Validation of Implicit Measures of
Organizational Climate
Organizational Climate
Kailey Ann MeyerMissouri State University, [email protected]
As with any intellectual project, the content and views expressed in this thesis may be considered objectionable by some readers. However, this student-scholar’s work has been judged to have academic value by the student’s thesis committee members trained in the discipline. The content and views expressed in this thesis are those of the student-scholar and are not endorsed by Missouri State University, its Graduate College, or its employees.
Follow this and additional works at: https://bearworks.missouristate.edu/theses Part of the Industrial and Organizational Psychology Commons
Recommended Citation Recommended Citation
Meyer, Kailey Ann, "Development and Validation of Implicit Measures of Organizational Climate" (2020). MSU Graduate Theses. 3487.
https://bearworks.missouristate.edu/theses/3487
This article or document was made available through BearWorks, the institutional repository of Missouri State University. The work contained in it may be protected by copyright and require permission of the copyright holder
DEVELOPMENT AND VALIDATION OF IMPLICIT MEASURES OF ORGANIZATIONAL CLIMATE
A Master’s Thesis Presented to The Graduate College of Missouri State University
TEMPLATE
In Partial Fulfillment
Of the Requirements for the Degree Master of Science, Psychology
By
Kailey Ann Meyer May 2020
DEVELOPMENT AND VALIDATION OF IMPLICIT MEASURES OF ORGANIZATIONAL CLIMATE
Psychology
Missouri State University, May 2020 Master of Science
Kailey Ann Meyer
ABSTRACT
Organizational climate is the shared perceptions that employees hold about their experiences in the workplace. The current research on organizational climate relies upon explicit (self-report) measures, which can be contaminated by impression management and inaccurate self-knowledge artifacts. This research used Implicit Association Test (IAT) procedures to develop implicit measures of selected aspects of organizational climate. The study examined the relationships of the implicit organizational climate measures with theoretically related explicit measures
according to a multitrait-multimethod design. A series of confirmatory factor analyses of latent trait models were used to assess convergent and discriminant validity evidence. While results provided some construct validity evidence for the implicit measures, future research might focus upon developing implicit measures with better psychometric properties and exploring the
potential incremental predictive validity of these measures.
KEYWORDS: organizational climate, role, supervisor, implicit measures, Implicit Association Test, confirmatory factor analysis
DEVELOPMENT AND VALIDATION OF IMPLICIT MEASURES OF ORGANIZATIONAL CLIMATE
By
Kailey Ann Meyer
A Master’s Thesis
Submitted to the Graduate College Of Missouri State University In Partial Fulfillment of the Requirements
For the Degree of Science, Psychology
May 2020 Approved:
Donald Fischer, Ph.D., Thesis Committee Chair Carol Shoptaugh, Ph.D., Committee Member Michelle Visio, Ph.D., Committee Member
Julie Masterson, Ph.D., Dean of the Graduate College
In the interest of academic freedom and the principle of free speech, approval of this thesis indicates the format is acceptable and meets the academic criteria for the discipline as
determined by the faculty that constitute the thesis committee. The content and views expressed in this thesis are those of the student-scholar and are not endorsed by Missouri State University, its Graduate College, or its employees.
ACKNOWLEDGEMENTS
This thesis project has been made possible through the encouragement and support of many individuals. First, I wish to express my sincere appreciation to my thesis advisor, Dr. Donald Fischer, for his never-ending mentorship on this project. Without his expertise, assistance, and patience, this project would not have become what it is today. I would like to thank the rest of my thesis committee, Dr. Carol Shoptaugh and Dr. Michelle Visio for their insight and encouragement on this project. I would like to thank my family and friends for being a constant support throughout both this project and graduate school. A special thanks is owed to my research team: Viktoriia Hryshchenko, Lauren Kreig, Max Lischwe, Xin Wei Ong, Benjamin Osvath, Kurtis Payne, Tiffany Rich, Thomas Ryan, Brooke Watson, and Alana Wilcox for their time, stimulating research discussions and willingness to help me with this project. Thank you.
TABLE OF CONTENTS
Introduction Page 1
Importance of Organizational Climate Page 4
Measures of Organizational Climate Page 5
Implicit Cognition Page 7
Implicit Association Test Page 8
Hypothesis Page 13
Methods Page 15
Sample Page 15
Explicit Measures Page 15
Implicit Measures Page 16
Procedure Page 19
Data Analysis Page 19
Results Page 26
Demographics Page 26
Test of Hypothesis Page 27
Discussion Page 33
References Page 37
Appendices Page 42
Appendix A. Human Subjects IRB Approval Page 42
Appendix B. Supervisor Support Scale Page 43
Appendix C. Role Conflict and Ambiguity Scale Page 44
Appendix D. Work Environment Scale Page 45
LIST OF TABLES
Table 1. Schematic Overview of the Implicit Association Test Page 11 Table 2. Schematic Overview of the Single Target Implicit Association
Test
Page 13 Table 3. Category Labels and Word Stimuli for Single – Target Role
Ambiguity IAT Page 17
Table 4. Category Labels and Word Stimuli for Single – Target Role
Conflict IAT Page 18
Table 5. Category Labels and Word Stimuli for Single – Target
Disengaged Supervisor IAT Page 18
Table 6. Category Labels and Word Stimuli for Single – Target Hostile
Supervisor IAT Page 18
Table 7. Descriptive Statistics for Study Variables Page 27
Table 8. Zero-Order Correlations for Study Variables Page 28
Table 9. Summary of Goodness-of-Fit Statistics for CFA Models Page 30 Table 10. Differential Goodness-of-Fit Statistics for Nested CFA
Models Page 31
LIST OF FIGURES
Figure 1. CFA Model 1. Two Freely Correlated Method Factors and
Two Freely Correlated Trait Factors Page 21
Figure 2. CFA: Model 2: Two Freely Correlated Method Factors and
No Trait Factors Page 22
Figure 3. CFA Model 3: Two Freely Correlated Method Factors and
Two Perfectly Correlated Trait Factors Page 23
Figure 4. CFA Model 4: Two Uncorrelated Methods Factors and Two
Freely Correlated Trait Factors Page 24
Figure 5. CFA Model 5: Perfectly Correlated Method Factors and Two
Freely Correlated Trait Factors Page 25
Figure 6. CFA Model 6: Two Uncorrelated Method Factors and Two
INTRODUCTION
One may wonder how individuals conceptualize and organize experiences that occur within the workplace. The idea of organizational climate addresses these issues. Although the idea of organizational climate is not new, some research has indicated that it is not well understood (Hellriegel & Solcum, 1974). Because of this, organizational climate has been an increasingly popular topic to research within the last half-century, especially during the first decade of this century (Schneider, Gonzalez-Roma, Ostroff & West, 2017).
James and Jones (1974) suggest that when individuals in an organization have shared perceptions of meaningful experiences, it makes sense to talk about the psychological climate of the organization. James and James (1989) developed a model that can be used to examine the meaningful experiences that individuals have within the workplace. This model is a
multidimensional hierarchical conceptual framework for explicit psychological climate measures (self-report climate scales). Schneider et al. (2017), provide a comprehensive definition of organizational climate, which is,
“a summary perception derived from a body of inter-connected experiences with
organizational policies, practices and procedures (e.g., from leadership and HR practices, and so forth) and observations of what is rewarded, supported and expected in the
organizations with these summary perceptions becoming meaningful and shared based on
the natural interactions of people with each other” (p. 468).
In essence, organizational climate can be viewed as the Gestalt of one’s perceptions and
experiences formed from one's work environment (Schneider et al., 2017). Organizational climate is a construct that is seen as a relatively enduring aspect within an organizational setting (Pritchard & Karasick, 1973).
James and James’ (1989) multidimensional hierarchical model consists of four domains, which were derived through exploratory factor analysis. The four domains of this model are leader support and facilitation, role stress and lack of harmony, job challenge and autonomy, and workgroup cooperation, warmth and friendliness (James & James, 1989). This model was
developed using a diverse set of work settings, which makes this four-factor model particularly useful in the sense that it provides evidence of invariance across diverse work settings (James & James, 1989).
All four domains in this model can be further partitioned into more narrowly focused constituent dimensions. Job challenge and autonomy consists of three components: job
autonomy, job importance, job challenge and variety (James & James, 1989). Jones and James
(1977) broadly define job challenge as “the extent to which a job gives the individual a chance to use his skills and abilities” (p. 31).
Work group cooperation, warmth and friendliness is composed of workgroup
cooperation, responsibility for effectiveness, and workgroup warmth and friendliness (James &
James, 1989). Jones and James (1977) defined workgroup cooperation as “an atmosphere in
which there is cooperative effort among individuals to carry out difficult tasks” (p. 33).
Research has established that leadership is an important aspect of an organization’s
climate (Kozlowski & Doherty, 1989; Likert, 1967; Litwin & Stringer, 1968). In James and James' (1989) model, the leader support dimension consists of five facets: hierarchal influence, psychological influence, leader trait and support, leader interaction facilitation, and leader goal emphasis and facilitation. The current research will focus on leader support, without breaking down the subsections provided within the model. Jones and James (1977) define leader support
involves] behavior which enhances someone else’s feelings of personal worth and importance”
(p. 31). This includes the perception an employee has of the leader helping accomplish necessary work goals through activities such as planning, scheduling, and providing personal support (Jones & James, 1977).
Leadership can be seen in multiple forms and can include aspects of good or poor
leaderships styles. Two poor leadership styles may consist of behaviors that foster perceptions of someone as being a disengaged leader or a hostile leader. Kelloway, Sivanathan, Francis and Barling (2005) state that leadership is abusive when “individuals in a formal leadership role engage in aggressive or punitive behavior towards their employees” (p. 91). This type of
leadership style may emerge in different capacities and can range in severity from acts of name calling to even job loss (Kelloway et al., 2005). Likewise, passive leadership is destructive (Kelloway et al., 2005; Skogstad, Einarsen, Torsheim, Schanke & Hetland, 2007). Skogstad et al. (2007) explored this idea and found that laissez-faire leadership is related to role conflict and
role ambiguity, which is another component of James and James’ (1989) multidimensional
climate model.
According to James and James (1989), the role stress and lack of harmony dimension of the model consists of five separate components including role ambiguity, role conflict, role overload, submit conflict, organization identification, and management concern and awareness. While all these components are important, the current research will focus on role conflict and role ambiguity. Schuler, Aldag and Brief (1977) provided a conceptualization for both role conflict and role ambiguity. To do so, Schuler et al. (1977) examined the factor structure of role conflict and role ambiguity based on the role conflict scale developed by Rizzo, House and Lirtzman (1970). Consistent with results from Rizzo et al. (1970), Schuler et al. (1977) supported
a two-factor model, with the factors being named role conflict and role ambiguity. Jones and James (1977) defined role conflict as “the presence of pressure for conflicting or mutually
exclusive behaviors” (p. 31). Jones and James (1977) define role ambiguity as “the extent to
which a task is unclear in its demands, criteria, or relationships with other tasks” (p. 31). These
definitions provided by Jones and James (1977) are similar to the ones provided by Rizzo et al. (1970) and Schuler et al. (1977).
Importance of Organizational Climate
Research findings on organizational climate are impactful for both the organization and the individual (Ostroff et al., 2012). Babin and Boles (1996) found that employee perceptions have an influence on stress and job satisfaction. Additional research has examined the
relationship between organizational climate, role stress, and job satisfaction. Thakre and Shroff (2016) and discovered that when employees report experiencing a favorable organizational climate, they have lower role stress when compared to employees that report they experience a less favorable organizational climate. Even further, organizational research has demonstrated that
organizational climate influences an employee’s intention to stay with the organization (Shanker,
2014) and their engagement in organizational citizenship behavior (Organ, 1988). Therefore, aggregated individual perceptions are important to understand for organizational outcomes (Schneider et al., 2017).
Schneider (1974) suggests that organizational climate can influence the strength of the relationship between individual differences and job performance/satisfaction. In particular, he found that job-related knowledge, skills, abilities and other attributes (KSAOs) were better predictors of job performance and satisfaction in in some organizations than others. The
KSAO—performance/satisfaction relationships were stronger in organizations where there was supportive leadership, coworker unity/cooperation, autonomy and an emphasis on development. Consequently, interventions that attempt to change the KSAO profile of a workforce by
improving basic HR functions involving selection or training will have greater impact on the
organization’s overall effectiveness if the climate reflects Schneider’s four attributes. Therefore, it is useful to know whether the climate is conducive to amplifying and sustaining the impact of HR interventions before investing in the effort. If an organization is low on these dimensions, it represents a climate that is likely to dampen the impact an HR intervention may have and it may be more beneficial for the organization to invest in interventions that target changing the climate rather than its HR practices.
Additional research has shown how climate can moderate KSAO—
performance/satisfaction relationships. Andrews (1967) and Litwin and Stringer (1968) found that climate moderates both the strength of motivation – performance and motivation – satisfaction relationships. Dunnette (1973) found that equity perceptions and performance-contingent reward perceptions moderate the strength of ability – performance relationships.
Measurements of Organizational Climate
The best way to measure organizational climate has been the subject of considerable debate within the literature. In the 1970s, research became more focused on different ways to measure climate, and what might be related to the construct (Schneider et al., 2017). Glick (1985) argued that organizational climate should be defined in broad terms, rather than
individual psychological units of analysis, as a way of defining the organizational environment
organizational climate should be measured as an aggregation of perceptions held by employees in the workplace. James and Jones (1974) conducted a review on the predominant theories, definitions, and research of organizational climate. They found that there are three ways in which organizational climate can be measured. They described these as the “multiple measurement
-organizational attribute approach,” the “perceptual measurement-organizational attribute
approach” and the “perceptual measurement-individual attribute approach” (p. 1096 – 1097). The multiple measurements – organizational attribute approach involves measuring organizational climate as a set of attributes with a variety of methods. The primary methods James and Jones (1974) highlighted included field studies and experimental designs.
Additionally, much of the research on this approach adopted a broad definition, making it
difficult to untangle the difference between an organizational attribute and organizational climate (e.g., Forehand & Gilmer, 1964; James & Jones, 1974).
Perceptual measurements – organizational attribute approached measured climate based upon perceptions (James & Jones, 1974). An area of concern with this approach is that
definitions for organizational structure variables (e.g., span of control) and organizational climate variables (e.g., autonomy) are not clearly distinct. Furthermore, this approach focused on
perceptions of organizational processes and characteristics, although it can be argued that these are individual attributes (James & Jones, 1974).
Perceptual measurement – individual attribute approach can be described as a summary of the perceptions of the individual within the organization (James & Jones, 1974). There are two important components to this approach: the perceived event and the climate perceptions
constructed from those events. The summary of interactions between the two components is considered organizational climate. The primary difference between this approach and perceptual
measurement – organizational attribute approach is that the perceptual measurement – individual approach examines climate as an individual attribute, whereas perceptual measurement –
organizational attribute approach views climate as an organizational attribute (James & Jones, 1974). Much of the work with this approach has stemmed from Schneider and his colleagues (James & Jones, 1974).
Hellriegel & Slocum (1974) noted that most organizational climate research consists of
“structured perception questionnaires” (p. 257). Specifically, these measures rely on individuals endorsing, denying or evaluating explicit statements about meaningful experiences in the workplace. However, there may be times where individuals do not fully report their true perceptions about the organizational climate. In some instances, individuals may engage in impression management tactics in order to gain favor or avoid undesirable consequences. Impression management, as defined by Learly and Kowalski (1990) is “the process by which
individuals attempt to control the impressions others form of them” (p. 34). When asked how
supportive their supervisor is or if they are experiencing role conflict, employees may want to paint a more favorable situation than what they are experiencing. Implicit measures have a long history of being used to address the contaminating effects that impression management can have on explicit measures.
Implicit Cognition
Implicit cognition refers to cognitions that one is unaware of and therefore cannot self-reflect upon or self-report (Greenwald & Banaji, 1995). Greenwald and Banaji (1995) describe that although implicit cognitions are not remembered or able to be self-reported, they may still impact performance. An attitude is defined by Greenwald and Banaji (1995) as a favorable or
unfavorable feeling towards an object (e.g. person, place, idea). In other words, an attitude involves the association between beliefs and emotions toward targets (e.g., social objects), which in turn lead to behavioral predispositions. An implicit attitude is defined as “introspectively
unidentified (or inaccurately identified) traces of past experience that mediate favorable or
unfavorable feelings, thought or action toward social objects” (Greenwald & Banaji, 1995, p. 5).
Greenwald, Banaji, Rudman, Farnham, Nosek and Mellot (2002) developed the Unified Theory of Implicit Social Cognition as a way of explaining how implicit and explicit cognitive processes jointly influence the way we think, feel and act. In some respects, James and James’
(1989) climate model reflects these cognitive theories or models of attitudes. The James and James (1989) model involves the self (the person) and the organizational climate dimension (attribute). The Unified Theory of Greenwald et al. (2002) would argue that a person’s attitudes
regarding meaningful work experiences is a function of both explicit and implicit cognitive
processes. Furthermore, as is the case with a person’s attitudes about social groups, there is a
potential for dissociation between implicit and explicit measures of these attitudes.
Implicit Association Test
The Implicit Association Test (IAT) was developed by Greenwald, McGhee and Schwartz (1998) to measure social attitudes (e.g., racial preference and stereotyping). Since the development of the IAT by Greenwald and colleagues over 20 years ago, it has been used to
measure many psychological attributes other than attitudes related to social groups (Lane, Banaji, Nosek & Greenwald, 2007). Additional IAT research has expanded to explore the implicit
attitudes towards homosexuality (Banse, Seise, & Zerbes, 2001), gender stereotypes (Dasgupta & Asgari, 2004), self-esteem and gender self-concept (Greenwald & Farnham, 2000), integrity
and character (Fischer & Bates, 2008), psychopathy (Fischer, Stassen, Thomas & Willis, 2015), Big 5 personality traits (Steffens & Konig, 2006), shyness (Asendorpf, Banse & Mucke, 2002), emotional intelligence (Oberdiear, Fischer, Fiscus, Willis, Stassen & Miles, 2016) and more (Lane et al., 2007). Perhaps, one of the most interesting aspects of the IAT is its ability to reveal associations that are different from those explicitly reported, either verbally or written (Lane et al., 2007). Consequently, many studies have explored the association or disassociation between implicit and explicit measures (Lane et al., 2007).
Ziegert and Hanges (2005) explored and attempted to replicate findings from Brief and colleagues (2000) about the role of implicit attitudes in a climate for racial bias. Ziegert and Hanges (2005) used the implicit race IAT developed by Greenwald et al., (1998) to examine implicit attitudes and explicit race scales. Results indicated a difference in the implicit and explicit measures of race. Furthermore, Ziegert and Hanges (2005) found that implicit racism interacted with climate for racial bias, which in turn predicted discrimination. Ziegert and
Hanges (2005) specifically noted “…when individuals were given a business justification for racial discrimination their implicit racists attitudes were related to their discriminatory behavior”
(p. 561). In some respects, this research highlights the importance of not relying exclusively on explicit measures to reveal attitudes about climate characteristics within an organization
(Schneider et al., 2017).
The IAT is a procedure used to measure one’s automatic associations between set
categories and attributes (two categories and two attributes; Greenwald et al., 1998; Lane et al., 2007). These automatic associations are measured by examining reaction times on classification tasks where the participant sorts stimuli into category--attribute pairs by pressing a letter on the keyboard. The labels for the two category--attribute pairs are displayed in the upper left and
upper right corners of the screen. The sorting task occurs when stimuli are presented one at a time in the middle of the screen. Participants press the “e” or “i” key depending on whether the
stimulus item belongs in the category or attribute on the left (“e”) or in the category or attribute
on the right (“i”). The time is takes to classify the items into paired categories is used to measure the strength of the association between the paired attribute and category. The faster and more accurately the stimuli are sorted, the stronger the association between the category and attribute. Whereas the slower and less accurate the sorting of stimuli, the weaker the association between the concepts (Lane et al., 2007).
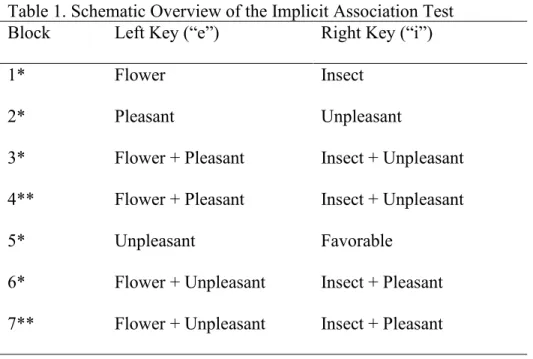
Perhaps the most well-known example of an IAT is the one described in the article where the method is introduced (Greenwald et al., 1998). The flower-insect IAT assesses attitudes toward flowers and insects. In this IAT the two categories were flowers and insects, and the two attributes were pleasant and unpleasant. Participants sorted examples of flowers (e.g. rose) and insects (e.g. bee), along with examples of pleasant words (e.g. wonderful) and unpleasant words (e.g. crash). This IAT used a seven-block procedure. The first block was used to familiarize the participant with the two categories and their corresponding stimuli (see Table 1.). The participant pressed the “e” or “i” key, according to whether the stimulus item was a flower or an insect. Block two was used to familiarize the participants with the attributes and their stimuli, where the
“e” or “i” key was pressed depending upon whether the stimulus item was a pleasant or
unpleasant word. Block three and four are more complex in that each category was paired with an attribute. In the compatible pairing, flowers are combined with pleasant (left side pair) and insects are combined with unpleasant (right side pair). Although both blocks three and four involve the same pairings, block three is called a practice block and block four is called a test block. The side of the screen to which the attributes are assigned is switched in block five.
Pleasant is moved to the right side of the screen and unpleasant is moved to the left side of the screen and participants practice the new assignments by pressing the “e” or “i” key accordingly
as stimulus items (pleasant and unpleasant words) are presented. Blocks six and seven are called the incompatible because flowers are paired with unpleasant words and insects are paired with pleasant words. The IAT score (also referred to as the IAT effect) is a function of the difference between the mean response times for the compatible and incompatible pairings. The greater the difference in the mean response times, the stronger the automatic association between the compatible paired concepts (flowers + favorable and insects + unfavorable; Greenwald et al., 2003, Lane et al., 2007).
Table 1. Schematic Overview of the Implicit Association Test
Block Left Key (“e”) Right Key (“i”)
1* Flower Insect
2* Pleasant Unpleasant
3* Flower + Pleasant Insect + Unpleasant
4** Flower + Pleasant Insect + Unpleasant
5* Unpleasant Favorable
6* Flower + Unpleasant Insect + Pleasant
7** Flower + Unpleasant Insect + Pleasant *Practice Blocks; **Test Blocks
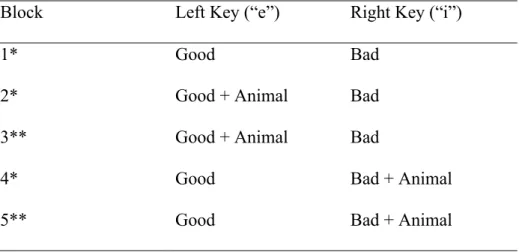
Another type of IAT is called the single target IAT, which does not include two
consists of a single-target category which is paired with two attributes. The single-target IAT is useful for assessing associations where a referent group isn’t available for creating compatible
and incompatible category—attribute pairs (Bluemke & Friese, 2008). The standard IAT consists of seven trial blocks, whereas the single-target IAT consists of five trial blocks. Like the standard IAT, the first block is to familiarize the participant with the two attributes (e.g., good or bad) and their corresponding stimuli. The participant presses the “e” and “i” key depending on whether
the stimulus item was good (e.g. marvelous) or bad (e.g. tragic). Block two is used as a practice block to familiarize the participants with the animal targets and their stimuli (e.g. sheep) and the attribute-target pairing. The target animal names are paired on the right side of the screen with
the attribute “good”. The same attribute-target paring is used in block three, however, this is a test block. The side of the screen to which the target is assigned is switched in block four.
Animal names are now paired with “bad” which is located on the left side of the screen. Block
four is considered the practice block and block five is the test block. See table 2 for the
schematic overview of the single target IAT by Karpinski and Steinman (2006). For the current research, four single-target IATs were developed, two IATs assessing leader support and two IATs assessing role conflict.
The IAT has often been used in conjunction with explicit measures of psychological attributes (Greenwald et al., 1998, Greenwald et al., 2007). Results from these studies have highlighted the potential for association and dissociation between the implicit and explicit measures. Greenwald suggests that dissociation may occur because of either impression management or inaccurate self- knowledge artifacts (Greenwald et al., 2002). Specifically,
Greenwald et al., (1998) discussed that a unique property of IATs may be that it “may reveal
attitudes” (p. 1464). For example, an employee may not express the way she really feels about how supportive her supervisor is because she does not want to be identified as a disgruntled
employee. Alternatively, an individual’s self-awareness may not be a true representation of how that person will behave in relevant situations. For example, a person may sincerely (explicitly) define themselves as one who is not prejudicially biased (e.g., against African-Americans), but exhibit prejudicial behavior when interacting with others (e.g., when evaluating
African-American candidates for jobs; Zierget & Hanges, 2005). The current study seeks to examine the association between explicit and implicit measures of organizational climate attributes. The study will investigate the construct validity of the implicit measures of organizational climate using a multitrait-multimethod (MTMM) design (Campbell & Fiske, 1959).
Table 2. Schematic Overview of the Single Target Implicit Association Test
Block Left Key (“e”) Right Key (“i”)
1* Good Bad
2* Good + Animal Bad
3** Good + Animal Bad
4* Good Bad + Animal
5** Good Bad + Animal
*Practice Blocks; ** Test Blocks
Hypothesis
It is hypothesized that IAT measures for selected organizational climate attributes (leader support and role conflict) will be related to corresponding explicit measures of these attributes
(evidence of convergent validity). It is also hypothesized that the measures of different climate attributes will be unrelated (evidence of discriminant validity). Finally, it is hypothesized that method factors will account for additional variance, so that the best fitting model for the MTMM data will include four factors – two climate factors (leader support and role conflict) and two method factors (explicit and implicit). These hypotheses will be tested using the hierarchical confirmatory factor analysis procedure (CFA) described by Widaman (1985).
METHOD
Sample
Approval from the Institutional Review Board (IRB) at Missouri State University was received on December 7, 2018 (Study #: IRB-FY2019-343; See appendix A for IRB approval letter). Participants were recruited from the psychology department’s online human subject pool system (i.e., SONA Systems). Students (N = 153) self-elected to participate in this study and received participation credit through the SONA system. An a priori power analysis indicated that the sample size exceeds the size necessary for adequate power (.80), given a hypothesis of close fit (H0: RMSEA = .05) and the alternative hypothesis of poor fit (HA: RMSEA = .10)
(MacCallum, Browne & Sugawara, 1996).
Explicit Measures
Index of Supervisor Support. Developed by Ko, Frey, Osteeen and Ahn (2015) to examine perceptions of supervisor support, items were rated on a 4-point Likert scale ranging from (1) strongly disagree to (4) strongly agree. Example items of this scale include “My
supervisor recognizes when I do a good job” and “My supervisor is responsive to my needs when
I have family or personal business to take care of.”The Cronbach’s alpha was .90. See Appendix B for the full scale.
Role Conflict and Ambiguity Scale. This scale was developed by Schuler, Aldag and Brief (1977) to measure the role conflict and role ambiguity that one may experience within the
were rated on a 5-point Likert scale ranging from 1 (strongly disagree) to 5 (strongly agree). Schuler et al., (1977) tested the internal consistency of the scale six times with different samples and all alphas met the criteria established by Nunnally (1978). An example item of role conflict
is “I do things that are apt to be accepted by one person and not accepted by others.” An example item of role ambiguity is “I know exactly what is expected of me.”The Cronbach’s alpha for role
conflict was .79 and the alpha for role ambiguity was .77. See Appendix C for the full scale. Work Environment Scale. This measure was developed by Insel and Moos (1972) to assess the climate within a work environment. This measure is composed of 10 subscales; however, for the purpose of this research, only two of the subscales were included; supervisory support and role clarity. Items were rated either “true” or “false”. Example items of the
supervisory support subscale were “Supervisors tend to talk down to employees (reverse
scored)” and “Supervisors really stand up for their people.” Sample items of role clarity included
“Things are sometimes pretty disorganized (reverse scored)” and “The details of assigned jobs
are generally explained to employees.” The Cronbach’s alpha for supervisor support was .57, and
role clarity was .66. See Appendix D for the full scale.
Demographic measures. Demographic questions assessed a participants’ gender, age,
race/ethnicity, and years of work experience.
Implicit Measures
This study developed four IATs based on the four-factor climate model developed by James and James (1989). These measures were developed in accordance with the guidelines
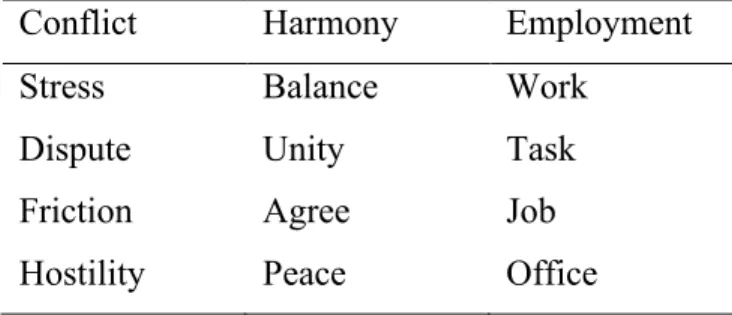
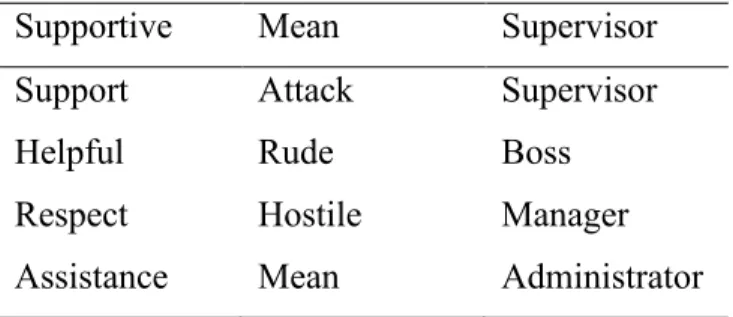
measures developed for the purpose of this research included four single target IATs following the five block guidelines outlined in Greenwald, Nosek and Banaji (2003). A series of IATs were pilot tested using the scoring procedure provided by Greenwald et al. (2003) and Lane et al. (2007) in order to obtain measures that exhibited desirable psychometric properties (lower error rates for stimuli classification, acceptable internal consistency and inter-individual variance). All IATs were developed using mono-color as opposed to the standard color IATs. Mono-color IATs were used because the sorting tasks becomes easier when colors are involved. A participant may end up sorting words based on color rather than the words’ semantic value. See tables 3 - 6 for a list of the attributes and targets for each of the four single-target IATs developed.
A series of pilot tests were used to examine combinations of categories and attributes used to construct each of the four IATs. Three pilot tests examined the psychometric properties of the four IAT measures under development (N = 35, N = 33, N = 26). From each pilot test, changes were made to the attribute labels and target labels based upon statistics comparing the mean classification error rates, IAT score variances, and internal consistency coefficients. These were then used to create the final set of the four IATs used to examine organizational climate.
Table 3. Category Labels and Word Stimuli for Single – Target Role Conflict IAT
Conflict Harmony Employment
Stress Balance Work
Dispute Unity Task
Friction Agree Job
Table 4. Category Labels and Word Stimuli for Single – Target Role Ambiguity IAT
Ambiguous Clear Employment
Vague Known Work
Confuse Certain Task
Uncertain Explicit Job
Questionable Definite Office
Table 5. Category Labels and Word Stimuli for Single – Target Supervisor Disengaged IAT Supportive Disengaged Supervisor
Support Ignore Supervisor
Helpful Indifferent Boss
Respect Uncaring Manager
Assistance Disregard Administrator
Table 6. Category Labels and Word Stimuli for Single – Target Supervisor Hostility IAT
Supportive Mean Supervisor
Support Attack Supervisor
Helpful Rude Boss
Respect Hostile Manager
Procedure
Upon entering the testing room, participants were visually and orally presented with the informed consent statement. In order to prime participants to begin thinking about their
employment setting, the informed consent stated, “When responding to all items, we want you to be thinking about the last few months of your current or most recent employment.” See
Appendix E for the full text of the informed consent statement.
Once participants agreed to participate, they began the study by clicking on the link which opened the Millisecond software. The study began with four demographic questions, followed by two mono-color single-target IAT measures (i.e. role conflict and hostile
supervisor). A set of explicit measures followed in this order: Supervisory Support (Ko et al., 2015), Work Environment Scale Role Clarity (Insel & Moos., 1972), Role Ambiguity (Schuler et al., (1977), Role Conflict (Schuler et al., 1977), and Work Environment Scale Supervisor
Support (Insel & Moos, 1972). The final two mono-color single-target IAT measures then
followed the explicit measures (i.e. role ambiguity and disengaged supervisor). Once participants completed the questionnaire they were thanked for their time and told they could exit the testing room. The researchers decided to break up the four IAT sets into two sets in hopes of reducing mental fatigue and boredom due to the monotonous task of pressing alternate “e” and “i” keys.
The data was analyzed using SPSS and the AMOS package.
Data Analysis
Confirmatory factor analysis (CFA) model comparisons were used for data analysis. Widaman (1985) developed a procedure to assess convergent and discriminant validity of traits
in a MTMM study. To do so, changes in fit statistics between successive pairs of models are analyzed. The comparisons begin with the least restrictive model (Model 1) where the factors intercorrelate freely. The following models, which are more restrictive in alternative ways, are compared to Model 1.
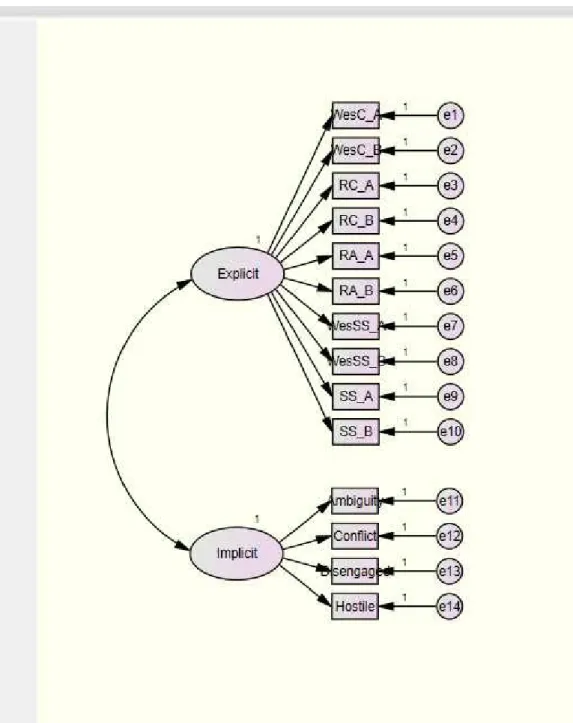
The least restrictive model in this study is portrayed in Figure 1. For this model, there are two freely correlated method factors (e.g., implicit and explicit), and two freely correlated trait factors (e.g., supervisor support and role clarity). Model 2 represents two freely correlated method factors and no trait factors (see Figure 2). This model is more restrictive than the initial model because it does not include the trait factors. Model 3 consists of two freely correlated method factors and perfectly correlated trait factors (see Figure 3). Model 4 represents two uncorrelated method factors and freely correlated trait factors (see Figure 4). Model 5 contains perfectly correlated methods factors and freely correlated trait factors (see Figure 5).
It is a common experience to obtain inadmissible solutions in initial CFA analyses of data from MTMM designs (Byrne, 2010; Marsh, 1989). This can often be managed by imposing constraints on estimates that are problematic (i.e., variance estimates that are negative). When efforts to achieve an admissible solution for the hypothesized model (Model 1) using this method proved unsuccessful, the explicit measures were parceled (Matsunaga, 2008). Two indicator variables were created for each explicit measure by deriving a score based on the measure’s
even-numbered items and one for its odd-numbered items. This procedure produced an admissible solution without imposing other constraints for the hypothesized model (and all
subsequent models). The parceled measures are indicated by an “A” or “B” suffix to the original
Figure 1. CFA Model 1: Two Freely Correlated Method Factors and Two Freely Correlated Trait Factors
Figure 3. CFA Model 3: Two Freely Correlated Method Factors and Two Perfectly Correlated Trait Factors
Figure 4. CFA Model 4. Two Uncorrelated Method Factors and Two Freely Correlated Trait Factors
Figure 5. CFA Model 5. Perfectly Correlated Method Factors and Two Freely Correlated Trait Factors
RESULTS
Demographics
The final sample was composed of 153 participants. Data was cleaned by eliminating participants with excessive error rates on one or more of IAT responses. Of the 153 participants in the final sample, 89 indicated they were female (58.2%) and 64 (41.8%) male. The sample’s
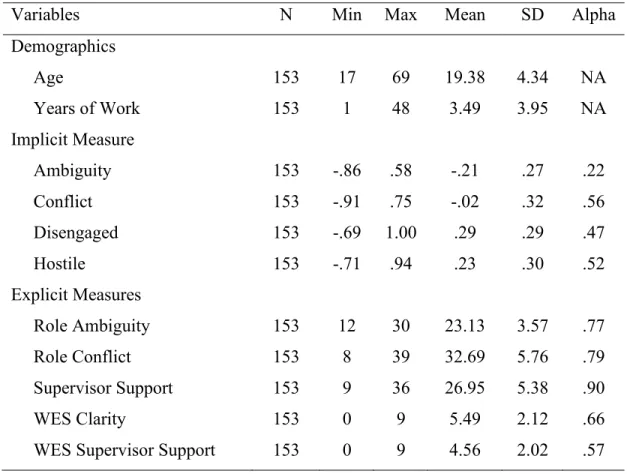
racial/ethnic demographics were as follows: 1% American Indian or Alaska Native, 1% Asian, 3% Black or African American, 3% Hispanic or Latino, 5% two or more, and 87% White. The age of respondents ranged from 17 to 69, with the mean being 19.38 years old. Participants reported a range of 1 to 48 years of work experience, with the mean being 3.49 years of work experience. See Table 7 for a summary of these results. See Table 8 for zero-order correlations for study variables.
When examining the zero-order correlation table, we expected to find a stronger
relationship between the implicit and explicit measures of common constructs than what we did, e.g., Ambiguity IAT and WES Clarity (A and B) and Role Ambiguity (A and B). Notably, most of the correlations between the implicit and explicit measures are small and non-significant according to the standards set forth by Cohen (1992). Related to these results are the relatively poor reliabilities of the implicit measures, especially the Ambiguity IAT (.22) and
Disengagement IAT (.47), which fail to meet Nunnally’s (1978) standards. These results will be further addressed in the discussion section.
Table 7. Descriptive Statistics for Study Variables
Variables N Min Max Mean SD Alpha
Demographics Age 153 17 69 19.38 4.34 NA Years of Work 153 1 48 3.49 3.95 NA Implicit Measure Ambiguity 153 -.86 .58 -.21 .27 .22 Conflict 153 -.91 .75 -.02 .32 .56 Disengaged 153 -.69 1.00 .29 .29 .47 Hostile 153 -.71 .94 .23 .30 .52 Explicit Measures Role Ambiguity 153 12 30 23.13 3.57 .77 Role Conflict 153 8 39 32.69 5.76 .79 Supervisor Support 153 9 36 26.95 5.38 .90 WES Clarity 153 0 9 5.49 2.12 .66
WES Supervisor Support 153 0 9 4.56 2.02 .57
Test of Hypothesis
Nested CFA model comparisons are used to assess the convergent and discriminant validity of the measures (Widaman, 1985). Model 1 is the initial model against which subsequent models are compared. This model is the least restrictive in that both method factors (e.g., implicit and explicit) and trait factors (e.g., clarity and support) are freely correlated. The model
comparisons begin by examining differences between Model 1 and Model 2, which is used to assess convergent validity. A comparison of Model 1 to Model 3 is used to assess discriminant validity. The comparison between Model 1 and Model 4 tests the hypothesis that the methods are uncorrelated. A final comparison between Model 1 and Model 5 tests the hypothesis that the
Table 8. Zero-Order Correlations Based on Study Variables Variables1 1 2 3 4 5 6 7 8 9 10 11 12 13 14 Implicit Ambiguity - Conflict .13 - Disengaged .00 -.15 - Hostile -.11 -.14 .12 - Explicit WesC_A .01 .06 .07 .15 - WesC_B -.01 -.07 .12 .13 .52** - RA_A .00 .00 .01 .02 .51** .47** - RA_B .05 -.03 -.03 .08 .34* .35** .66** - RC_A .10 .02 -.04 -.19* -.45** -.43** -.33** -.24** - RC_B .09 -.00 -.06 -.19* -.38** -.41** -.27** -.18* .82** - WesSS_A -.08 -.08 .12 -.03 .29** .40** .26** .12 -.28** -.24** - WesSS_B -.10 .06 .08 .14 .27** .33** .23** .18* -.29** -.25** .45** - SS_A -.07 .03 .11 .13 .46** .52** .44** .30** -.47** -.37* .53** .47** - SS_B -.02 -.04 .14 .09 .39** .42** .39** .32** -.44** -.34** .41** .38** .80** - *p<.05; **p<.01
1 Variable names have been shortened due to space restrictions. All variables Names are as follows Implicit measures, Ambiguity, Conflict,
Disengaged, Hostile, Explicit Measures Work Environment Scale A, Work Environment Scale B, Role Ambiguity A, Role Ambiguity B, Role Conflict A, Role Conflict B, Work Environment Scale Supervisor Support A, Work Environment Scale Supervisor Support B, Supervisor Support A, Supervisor Support B.
The fit statistics for Model 1 indicate that it describes the relationships among variables in this study very well (X2
(61) = 76.30; CFI = .98; RMSEA = .041, 90% C.I. = .006, .067).
Specifically, the CFI for Model 1 is above the threshold of .90 and the RMSEA is less than .08 (Bentler, 1990; Byrne, 2010). Furthermore, Model 1 falls within the thresholds provided by MacCallum et al., (1996) in that the 90% confidence interval is small and the upper bound of the confidence interval is less than .10. A comparison of Model 1 and Model 2 assesses convergent validity. The comparison of Model 1 fit statistics to Model 2 fit statistics reveals a substantial degradation in the 2nd model’s ability to describe the data. Because there are no specified trait
factors in Model 2, these results constitute convergent validity evidence – i.e., the relationships among study variables cannot be described by method factors alone. Discriminant validity is assessed by comparing Model 1 and Model 3. Model 3 represents two freely correlated method factors and perfectly correlated trait factors. In essence, organizational climate factors of role clarity and supervisory support are reduced to one factor, such as an overall organizational climate dimension. The larger the difference, the greater the evidence of discriminate validity. As can be seen in Table 9, the fit statistics for Model 3 are poor and fail to achieve the threshold standards established by Bentler and others. Next, a comparison between Model 1 and Model 4 reveals virtually no difference in the fit statistics, which suggests that there is no common method variance between the implicit and explicit measures. The last comparison was between Model 1 and Model 5. Model 5 represents two perfectly correlated method factors and two freely correlated trait factors. A comparison of the fit statistics suggests very little difference between these two models’ ability to describe relationships among study variables. The apparent paradox regarding the last two comparisons will be addressed below. Table 9 contains a summary of all Goodness-of-Fit Statistics for the CFA models used in this study.
Table 9. Summary of Goodness-of-Fit Statistics for CFA Models
Model X2 df CFI RMSEA 90% C.I
1. Two Freely Correlated Methods Factors;
Two Freely Correlated Trait Factors 76.30 61 .98 .041 .006, .067 2. Two Freely Correlated Method Factors;
No Trait Factors 305.89 76 .68 .141 .125, .158
3. Two Freely Correlated Method Factors;
Perfectly Correlated Trait Factors 153.93 62 .87 .099 .079, .118 4. Two Uncorrelated Method Factors;
Freely Correlated Traits
77.78 62 .98 .041 .000, .067 5. Two Perfectly Correlated Method
Factors; Freely Correlated Trait Factors
83.12 62 .97 .047 .012, .072
Table 10 Displays the differential Goodness-of-Fit Statistics for nested model comparison. The results of the comparison of Model 1 to Model 2 provide support for
convergent validity in that the fit statistics deteriorate substantially. More specifically, the CFI (.98) and RMSEA (.041) for Model 1 represent a better fitting model than the fit statistics for Model 2, CFI (.68) and RMSEA (.141). The fit standards provided for Model 1 are within the recommendations made by Bentler (1990) while the fit statistics for Model 2 fall well below these norms.
In a similar manner, discriminant validity can be assessed by comparing the fit statistics of Model 1 vs Model 3 and Model 1 vs Model 4. When comparing Model 1 to Model 3, the results indicated that when organizational climate is restricted to a single factor, the model does a poorer job of describing the relationships among variables. The CFI (.98) and RMSEA (.041) for Model 1 represent a “good fit” while the CFI (.87) and RMSEA (.099) for Model 3 are both outside the recommendations for a good fit. Model 1 and Model 4 comparison indicated that the
fit statistics are very similar – only the Chi Square statistics differ. Lastly, a comparison between Model 1 and Model 5 also revealed similar fit statistics, with Model 5 CFI (.97) and RMSEA (.047). The fit statistics for both models are within the thresholds provided by Bentler (1990) and Byrne (2010). This finding is interesting because it begs the following question: do these
analyses best support a four-factor model (e.g., Model 4) or a three-factor model (e.g., Model 5)? This question becomes more perplexing when one compares the correlation between the two method factors in Model 1 (.31) with that in Model 5 (1.0). These results will be further considered in the Discussion section below.
Table 10. Differential Goodness-of-Fit Statistics for Nested Model Comparisons
Model Comparisons ΔX2 df Δ CFI
Test of Convergent Validity
Model 1 vs. Model 2 229.59** 15 .30
Tests of Discriminant Validity
Model 1 vs. Model 3 77.63** 1 .11
Model 1 vs. Model 4 1.48 1 .01
Model 1 vs. Model 5 6.82** 1 .01
**p<.01
Finally, Table 11 displays the factor loadings for each of the study variables in Model 1: two method factors (e.g., implicit and explicit) and two organizational climate trait factors (e.g., role clarity and supervisor support). These results suggest that only some of the indicator variables for each factor had significant loadings (16 out of 28), which provides only modest support for construct validity of the measures. More specifically, the implicit measures did not
Table 11. Trait and Method Loadings for CFA Model 1
Implicit Explicit Role Supervisor Implicit Measures Ambiguity -.23 .07 Conflict -.29* -.00 Disengaged .24 .10 Hostile .52* .02 Explicit Measures WesC_A .52* .38 WesC_B .52* .36 RA_A .43* .77* RA_B .31 .64* RC_A -.94* .10 RC_B -.86* .14 WesSS_A .32* .44* WesSS_B .33* .37* SS_A .53 .81* SS_B .48* .67* *p<.05
DISCUSSION
The purpose of the current study was to develop and validate implicit association tests of two factors of organizational climate. This study sought to develop and validate measures of organizational climate that could be used when employees may not respond in ways that
accurately represent their organizational experiences and attitudes. Model 1 for this study fit the data well according to the statistical analyses. As more restrictive models were added, we observed a degradation in the fit statistics that supports the convergent and discriminant validity of the measures.
Evidence of convergent validity was stronger for the explicit measures than it was for the implicit measures. It would have been ideal to see stronger loadings for the implicit measures on the latent trait factors. A potentially positive aspect to this finding is that the lack of substantial correlation between the implicit and explicit measures may mean that the implicit measures have the potential to predict behavior in ways that explicit measures do not. The potential incremental validity of implicit measures to predict engagement and citizenship behavior warrants future study.
Future research should also focus upon improving the psychometric properties of the implicit measures of organizational climate. The reliabilities reported in Table 7 do not meet
Nunnally’s (1978) minimum standard for being acceptable (.7). These values were Spearman-Brown coefficients based on split-half correlations – IAT scores based on practice block trials (blocks 2 and 4 in Table 2) were correlated with IAT scores based on test block trials (blocks 3 and 5 in Table 2). However, the fact remains that measurement error may be playing a major role in attenuating correlations between the implicit measures and the theoretically related
explicit measures – none of the 40 correlations between the implicit and explicit measures exceeded .20 and only two of these were statistically significant (see Table 8). In order to draw the conclusions regarding convergent and discriminant validity, it is essential that the
psychometric properties of the implicit measures be adequate.
This problem of low reliabilities may also contribute to the weak evidence supporting the need for two method factors and two trait factors – weak relationships among study variables means there is not much covariance to explain. The psychometric properties of explicit measures of organizational climate met the standards provided by Nunnally (1978). However, as noted previously, the low reliabilities of the implicit measures of organizational climate make it likely that these measures are too contaminated by measurement error to be of functional value.
A final consideration involves the concept of over-fitting with latent trait models. Byrne, Bentler, MacCallum and others counsel caution when fit statistics exceed the thresholds for
“good fit” (CFI>.95; RMSEA<.04). The fit statistics for Models 1 and 4 are approaching this range, which may suggest that the data are overfitted by the factors specified in these models. Consequently, we examined a fifth model which consisted of two perfectly correlated method factors (i.e., a single method factor) and two freely correlated trait factors (see Figure 5). When examining the fit statistics for this model, we observed no degradation in the fit statistics (see Table 9 and Table 10). Arguably, Model 4 or Model 5 explain the relationships among study variables equally well. Essentially, the parsimony that is gained in dropping one of the latent method factors (from Model 4 to Model 5) does not cost very much in terms of the ability to capture the variance-covariance structure of these measures. However, there are important theoretical reasons supported by substantial empirical evidence to reject Model 5. The implicit and explicit methods tap distinct cognitive processes. To use Kahneman’s (2011) terms, explicit
measures involve “system 2” (conscious, effortful, deliberative processes), while implicit
measures involve “system 1” (unconscious, fast, automatic processes). When explicit and
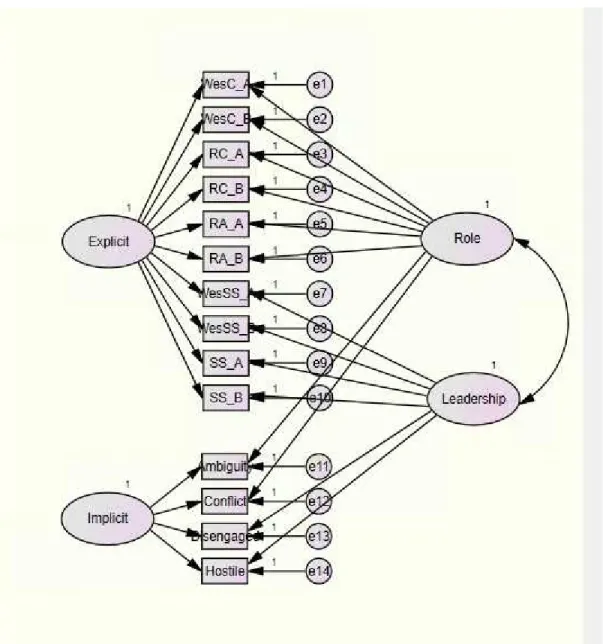
implicit measures are dissociated, as is the case with these data, we would expect that two factors are needed to explain the method variance in the measures. In an effort to further explore the hypothesis that a model involving three rather than four factors better fits the data, a sixth model was examined – one that involved two uncorrelated method factors and two perfectly correlated trait factors (i.e., two method factors but only one trait factor; see Figure 6). Although there are theoretical reasons supported by considerable empirical evidence to reject this model as well, we thought it might shed some light on whether the over-fit fell more on the method side or on the trait side of the hypothesized model. The fit statistics for this model were considerably poorer than those for Model 1 and 4 (CFI = .85 and RMSEA = .10). While this provides additional support for the discriminant validity of the climate traits, it does little to resolve the conundrum regarding the method traits.
Figure 6. CFA Model 6: Two Uncorrelated Method Factors and Two Perfectly Correlated Trait Factors
REFERENCES
Andrews, J. D. W. (1967). The achievement motive and advancement in two types of organizations. Journal of Personality and Social Psychology, 6(2), 163-168. doi: 10.1037/h0024689
Asendorpf, J. B., Banse, R., & Mücke, D. (2002). Double dissociation between implicit and explicit personality self-concept: The case of shy behavior. Journal of Personality and Social Psychology, 83(2), 380.
Babin, B. J., & Boles, J. S. (1996). The effects of perceived co-worker involvement and supervisor support on service provider role stress, performance and job satisfaction. Journal of Retailing, 72(1), 57-75. doi: 10.1016/s0022-4359(96)90005-6
Banse, R., Seise, J., & Zerbes, N. (2001). Implicit attitudes towards homosexuality: Reliability, validity, and controllability of the IAT. Zeitschrift für Experimentelle Psychologie, 48(2), 145-160. doi: 10.1026//0949-3946.48.2.145
Bentler, P. M. (1990). Comparative fit indexes in structural models. Psychological bulletin, 107(2), 238-246. doi: 10.1037/0033-2909.107.2.238
Bluemke, M., & Friese, M. (2008). Reliability and validity of the single‐target IAT (ST‐IAT):
Assessing automatic affect towards multiple attitude objects. European Journal of Social Psychology, 38(6), 977-997. doi: 10.1002/ejsp.487
Byrne, B. M. (2010). Structural Equation Modeling with AMOS, Second Edition. New York: Routledge.
Campbell, D. T., & Fiske, D. W. (1959). Convergent and discriminant validation by the multitrait-multimethod matrix. Psychological Bulletin, 56(2), 81-105. doi: 10.1037/h0046016
Cohen, J. (1992). A power primer. Psychological bulletin, 112(1), 155.
Dasgupta, N., & Asgari, S. (2004). Seeing is believing: Exposure to counterstereotypic women leaders and its effect on the malleability of automatic gender stereotyping. Journal of Experimental Social Psychology, 40(5), 642-658. doi: 10.1016/j.jesp.2004.02.003
Dunnette, M. D. (1973). Performance equals ability and what? University of Minnesota, Department of Psychology (No. 4009, p. 1150). ONR Technical Report.
Fischer, D., & Bates, J. A. (2008). The development of an IAT for workplace integrity. In 23rd annual meeting of the Society for Industrial and Organizational Psychology, San Francisco, CA.
Fischer, D., Stassen, M., Thomas, B., Willis. (2015). Predicting character failure with IATs based on Dark Side traits. S. Culbertson & A. Jackson (chairs), What makes the Dark Triad maladaptive for work.
Forehand, G. A., & Gilmer, B. Von. (1964). Environmental variations in studies of organizational climate. Psychological Bulletin, 6, 361-382. doi: 10.1037/h0045960
Glick, W. H. (1985). Conceptualizing and measuring organizational and psychological climate: Pitfalls in multilevel research. Academy of Management Review, 10(3), 601-616. doi: 10.2307/258140
Hellriegel, D., & Slocum Jr, J. W. (1974). Organizational climate: Measures, research and contingencies. Academy of Management Journal, 17(2), 255-280. doi:
10.5465/amr.1985.4279045
Greenwald, A. G., & Banaji, M. R. (1995). Implicit social cognition: Attitudes, self-esteem, and stereotypes. Psychological Review, 102, 4-27. doi: 10.1037/0033-295x.102.1.4
Greenwald, A. G., & Farnham, S. D. (2000). Using the implicit association test to measure self- esteem and self-concept. Journal of Personality and Social Psychology, 79(6), 1022- 1038. doi: 10.1037/0022-3514.79.6.1022
Greenwald, A. G., Banaji, M. R., Rudman, L. A., Farnham, S. D., Nosek, B. A., & Mellott, D. S. (2002). A unified theory of implicit attitudes, stereotypes, self-esteem, and self-concept.
Psychological Review, 109(1), 3–25. doi: 10.1037/0033-295X.109.1.3
Greenwald, A. G., McGhee, D. E., & Schwartz, J. L. (1998). Measuring individual differences in implicit cognition: The implicit association test. Journal of Personality and Social
Psychology, 74(6), 1464-1480. doi: 10.1037/0022-3514.74.6.1464
Greenwald, A. G., Nosek, B. A., & Banaji, M. R. (2003). Understanding and using the implicit association test: I. An improved scoring algorithm. Journal of Personality and Social Psychology, 85(2), 197-216. doi:10.1037/0022- 3514.85.2.197
Insel, P., & Moos, R. (1972). The work environment Scale. Palo Alto: Social Ecology Laboratory, Department of Psychiatry.
James, L. A., & James, L. R. (1989). Integrating work environment perceptions: Explorations into the measurement of meaning. Journal of Applied Psychology, 74(5), 739-751. doi: 10.1037/0021-9010.74.5.739
James, L. R., & Jones, A. P. (1974). Organizational climate: A review of theory and research. Psychological Bulletin, 81(12), 1096-1112. doi: 10.1037/0022-3514.74.6.1464
Jones, A. P., & James, L. R. (1977). Psychological climate: Dimensions and relationships of individual and aggregated work environment perceptions. Organizational behavior and human performance, 23(2), 201-250. doi: 10.1016/0030-5073(79)90056-4
Kahneman, D. (2011). Thinking, fast and slow. Macmillan.
Kelloway, E. K., Sivanathan, N., Francis, L., & Barling, J. (2005). Poor leadership. Handbook of Work Stress, 89-112. doi: 10.4135/9781412975995.n5
Ko, J., Frey, J. J., Osteen, P., & Ahn, H. (2015). Index of Supervisor Support. PsycTESTS Dataset. doi: 10.1037/t50236-000
Kozlowski, S. W., & Doherty, M. L. (1989). Integration of climate and leadership: Examination of a neglected issue. Journal of Applied Psychology, 74(4), 546.
doi: 10.1037/00219010.74.4.546
Karpinski, A., & Steinman, R.B. (2006). The single category implicit association test as measure of implicit social cognition. Journal of Personality and Social Psychology, 91, 16–32. doi: 10.1037/0022-3514.91.1.16
Lane, K. A., Banaji, M. R., Nosek, B. A., & Greenwald, A. G. (2007). Understanding and using the Implicit Association Test: IV. What we know (so far) (pp 59 – 102). In B.
Wittenbrink & N. S. Schwarz (Eds.). Implicit measures of attitudes: Procedures and controversies. New York: Guilford Press.
Leary, M. R., & Kowalski, R. M. (1990). Impression management: A literature review and two- component model. Psychological Bulletin, 107(1), 34-47.
doi: 10.1037/0033-2909.107.1.34
Likert, R. (1967). The human organization: New York: McGraw-Hill.
Litwin, G. H., & Stringer, R. A. (1968). Motivation and organizational climate.Wiley: NY. doi: 10.1037/t01302-000
MacCallum, R. C., Browne, M. W., & Sugawara, H. M. (1996). Power analysis and
determination of sample size for covariance structure modeling. Psychological Methods, 1(2), 130-149. doi: 10.1037/1082-989x.1.2.130
Marsh, H. W. (1989). Confirmatory factor analyses of multitrait-multimethod data: Many problems and a few solutions. Applied psychological measurement, 13(4), 335-361. Matsunaga, M. (2008) Item parceling in structural equation modeling: A primer. Communication
Nosek, B., Greenwald, A., & Banaji, M. (2005). Understanding and using the implicit association test: II. Method variables and construct validity. Personality and Social Psychology Bulletin, 31(2), 166-180. doi: 10.1177/0146167204271418
Nunnally, J. C., & Bernstein, I. H. (1978). Psychometric theory
Oberdiear, L., Fischer, D., Fiscus, T., Willis, D., Stassen, M. & Miles, A. (2016). Development and Validation of Implicit Measures of Emotional Intelligence. Paper presented at the 28th annual meeting of the Association for Psychological Science, Chicago, IL
Organ, D.W. (1988) Organizational citizenship behavior: the Good Soldier syndrome. Lexington, MA: Lexington.
Ostroff, C., Kinicki, A. J., & Muhammad, R. S. (2012). Organizational culture and climate. Handbook of Psychology, 12(2). 643-676. doi: 1002/9781118133880.hop212024
Pritchard, R. D., & Karasick, B. W. (1973). The effects of organizational climate on managerial
job performance and job satisfaction. Organizational behavior and human
performance, 9(1), 126-146. doi: 10.1016/0030-5073(73)90042-1
Rizzo, J. R., House, R. J., & Lirtzman, S. I. (1970). Role conflict and ambiguity in complex organizations. Administrative Science Quarterly, 150-163. doi:
https://doi.org/10.2307/2391486
Schneider, B. (1974) Organizational type, organizational success & the prediction of individual performance. Dept of Psychology Technical Report #6, U of MD: Silver Springs, MD.
Schneider, B. (1975). Organizational climates: An essay 1. Personnel Psychology, 28(4), 447-
479. doi: 10.1111/j.1744-6570.1975.tb01386.x
Schneider, B., González-Romá, V., Ostroff, C., & West, M. A. (2017). Organizational climate and culture: Reflections on the history of the constructs in the Journal of Applied Psychology. Journal of Applied Psychology, 102(3), 468-482. doi: 10.1037/apl0000090. Schuler, R. S., Aldag, R. J., & Brief, A. P. (1977). Role conflict and ambiguity: A scale analysis.
Organizational Behavior and Human Performance, 20(1), 111-128. https://doi.org/10.1016/0030-5073(77)90047-2
Shanker, M. (2014). A study on organizational climate in relation to employees' intention to stay. Journal of Psychosocial Research, 9(2), 389-397.
Skogstad, A., Einarsen, S., Torsheim, T., Aasland, M. S., & Hetland, H. (2007). The destructiveness of laissez-faire leadership behavior. Journal of Occupational Health Psychology, 12(1), 80-92. doi: 10.1037/1076-8998.12.1.80
Steffens, M. C., & Schulze König, S. (2006). Predicting spontaneous big five behavior with implicit association tests. European Journal of Psychological Assessment, 22(1), 13-20. Thakre, N., & Shroff, N. (2016). Organizational climate, organizational role stress and job
satisfaction among employees. Journal of Psychosocial Research, 11(2), 469-478. Widaman, K. F. (1985). Hierarchically nested covariance structure models for multitrait-
multimethod data. Applied Psychological Measurement, 9(1), 1-26.
Ziegert, J. C., & Hanges, P. J. (2005). Employment discrimination: The role of implicit attitudes, motivation, and a climate for racial bias. Journal of Applied Psychology, 90(3), 553-562. doi: 10.1037/0021-9010.90.3.553
APPENDICES
Appendix B: Supervisor Support Scale
1. My supervisor keeps me informed me of the things I need to know to do my job well. 2. My supervisor has expectations of my performance on the job that are realistic. 3. My supervisor recognizes when I do a good job.
4. My supervisor is supportive when I have a work problem. 5. My supervisor is fair and does not show favoritism.
6. My supervisor is responsive to my needs when I have family or personal business to take care of.
7. My supervisor is understanding when I talk about personal or family issues that affect my work.
8. I feel comfortable bringing up personal or family issues with my supervisor.
9. My supervisor really cares about the effects that work demands have on my personal and family life.
Appendix C: Role Conflict and Ambiguity Scale Role Conflict
1. I have to do things that should be done differently under different conditions. 2. I receive an assignment without the manpower to complete it.
3. I have to buck a rule or policy in order to carry out an assignment. 4. I work with two or more groups who operate quite differently. 5. I receive incompatible requests from two or more people.
6. I do things that are apt to be accepted by one person and not by others.
7. I receive an assignment without adequate resources and materials to execute it. 8. I work on unnecessary things.
Role Ambiguity
1. I have clear, planned goals and objectives for my job. 2. I know that I have divided my time properly.
3. I know what my responsibilities are. 4. I know exactly what is expected of me.
5. I feel certain about how much authority I have on the job. 6. Explanation is clear of what has to be done.
Appendix D: Work Environment Scale Supervisory Support
1. Supervisors tend to talk down to employees (R)
2. Supervisors usually complement employees who do well 3. Supervisors tend to discourage criticisms from employees (R) 4. Supervisors give full credit to ideas contributed by employees 5. Supervisors often criticize employees over minor things (R) 6. Employees generally feel free to ask for a raise
7. Supervisors expect for too much from employees (R)
8. Employees discuss their personal problems with supervisors 9. Supervisors really stand up for their people
Clarity
1. Things are sometimes pretty disorganized (R) 2. Activities are well planned
3. Rules and regulations are somewhat vague and ambiguous (R) 4. The responsibilities of supervisors are clearly defined
5. The details of assigned jobs are generally explained to employees
6. Employees are often confused about exactly what they are suppose to do (R) 7. Fringe benefits are fully explained to employees
8. Rules and policies are constantly changing (R)