T
HE
W
ILLIAM
D
AVIDSON
I
NSTITUTE
AT THE UNIVERSITY OF MICHIGAN BUSINESS SCHOOLExplaining Postcommunist Economic Performance
By: Lawrence P. King
William Davidson Working Paper Number 559
May 2003
Lawrence P. King Yale University
Abstract:
This article critiques neoliberal transition theory from a neoclassical sociological perspective. Neoliberals argue that postcommunist economic failure is the result of inadequate adherence to neoliberal precepts. This paper argues that the neoliberal policy package of “Shock Therapy” (consisting of the radical transition to a market economy through rapid and extensive price and trade liberalization, stringent monetary and fiscal stabilization, and the implementation of a mass privatization program) creates severe supply-and-demand shocks for enterprises, inducing firm failure. This leads to a fiscal crisis for the state, and an erosion of its capacity and bureaucratic character. This in turn reacts back on the enterprise sector, since the state can no longer support the institutions necessary for the effective functioning of capitalist economies. The neoliberal theory is tested against a neoclassical sociological theory by examining the experience of 12 postcommunist countries and two reform Asian communist countries.
Keywords: postcommunist performance, state capacity, liberalization, privatization JEL codes: O1, O5, P2
At the onset of the transition from state socialism to market capitalism, Western-trained economists provided the postcommunist power elite with the blueprint for constructing capitalism amid the ruins of communism (Stark 1992). They created the Shock Therapy policy package, which, when implemented, devastated the postcommunist economy and weakened the state. A review of the economic history of postcommunist countries demonstrates that “the market” provided no protection for firms during the insertion of postcommunist economies into the global capitalist system, ushering in de-industrialization and impoverishment.
Shock Therapy was, above all else, a Smithian analysis: a successful transition to capitalism could be accomplished by relying on the powers of the invisible hand,
unleashed by radical curtailment of the state’s involvement in the economy. In Sachs’s words, “Markets spring up as soon as central planning bureaucrats vacate the field” (1994: xii). Whenever politically possible, “the market mechanism” would accomplish the tasks that, in the 1960s, most would have expected to be performed by a
developmental state.
Where neoliberal reforms were not modified by policy reversals caused by voter backlash, the consequences were severe. The de-modernization of much of the
Table 1: Economic Performance in Postcommunist Society Avg. GDP Per Capita Change 1991-2000 (in 1995 US$) Change in Male Life Expectancy 1989-2000 (value in 2000) % of Population Below Poverty l993-1995 (in 1987-88) % Exper. Shortage of Food &/or Clothes 2000 (in 1989) % Age-Appropriate in Kinder-garten 1996 (change from 1989) FDI Net Inflow Per Capita 1990-2000 (BoP data in current US$) Czech 0.1 +3 (71.5) 1(0) NA 89 (-1) $2,271 Slovakia 0.4 +2 (69.1) 1(0) 15.8 (6.5) 75 (-17) $777 Poland 3.7 +2 (71.6) 20 (6) 25.7 (7.7) 47 (-2) $1,053 Hungary 1.3 +2 (67.1) 4 (1) 18.3 (12.5) 87 (-1) $2106 Slovenia 1.9 +3 (71.6) 1 (0) NA 65 (-7) $856 C.E.E. Avg. 1.2 +2.4 5.4 73 (-5.6) $1,413 Russia -3.5 -5 (59.0) 50 (2) 73.0 (45.1) 55 (-14) $141 Belarus -0.5 -3 (62.5) 22 (1) NA 64 (+1) $124 Ukraine -7.1 -5 (63.0) 63 (2) NA 41 (-20) $69 FSU Avg. -3.7 -4.3 45 53 (-11) $111 Kazakh. -2.5 -4 (60.3) 65 (5) NA 24 (-31) $524 Uzbek. -2.0 +1(66.7) 63 (25) NA 24 (-10) $38 CAFSU Avg. -2.3 -1.5 64 24 (-21.5) $281 Romania -1.8 -1 (66.1) 59 (6) 43.9 (26.2) 55 (-8) $292 Bulgaria -1.4 -1 (65.1) 15 (2) 55.1 (45.7) 69 (0) $403 E. Eur. Avg. -1.6 -1 37 62 (-4) $348 China 9.0 +2 (68.6) NA NA NA $255 Vietnam 5.5 +4 (66.7) NA NA NA $190 E. Asian Avg. 7.3 +3 $223
SP (Shock Privatization) = Privatized at least 25% of large SOEs under a mass privatization program within two years.
SL (Shock Liberalization) = Liberalized at least 75% of imports and domestic prices within two years. SS (Shock Stabilization) = Implemented an IMF approved stabilization package.
GDP and life-expectancy data from World Bank Development Indicators 2001 (CD-ROM); poverty rates from Branko Milanovic. Income, Inequality and Poverty During the Transition from Planned to Market Economy. (Washington, DC.: The World Bank, 1998); kindergarten enrollments from Human
Development Report for Central and Eastern Europe and the CIS 1999: 58 (Bratislava: United Nations DevelopmentProgram); food and clothing deprivation from Kligman and Szelenyi (2002). Policy data from historical summaries.
Outside of Central Eastern Europe and East Asia reform communism, economic performance has been disastrous. Economic output has declined dramatically, and poverty rates have skyrocketed. Extreme poverty, as measured by a survey that asked respondents if they had recently gone to bed hungry because of lack of food and if they lacked adequate clothing, is startlingly high. A full 73% of Russian respondents said they either had gone to bed hungry recently and/or had inadequate clothing. This is consistent with the amazingly rapid decline in male life expectancy at birth. By the year 2000 Male life expectancy in Russia was a full five years lower than it was 10 years ago, only 59.0 years, significantly lower than in China (68.64) and even in Vietnam (66.70).
The rest of this paper is divided into two sections. In the first, the competing theoretical claims of the neoliberals’ Shock Therapy approach is contrasted with a neoclassical sociological approach. The second presents comparative evidence on the economic performance of the postcommunist world which is consistent with the
sociological position and inconsistent with the neoliberal position. The punch line is that the key “switching point” (see Weber 1978) in the brief history of postcommunism was the decision to pursue Shock Therapy -- and especially all three components -- within a relatively brief period. These policies, when carried out in the absence of large-scale foreign direct investment and/or cooperative production arrangements with
multinationals, “derails” the postcommunist transition on the way to Western European-style capitalism.
Neo-Smithian Transition Theory
The restructuring of the postcommunist economies along capitalist lines was intended to be guided by market forces, plain and simple. The IMF and the World Bank no longer tolerated the developmental state as they did in the 1960s and 1970s. In its place, the “market” would restructure firms and thus economies. Neoliberal academics and experts argued that, by allowing the market to work its magic, a new efficient set of organizations would replace the deformed inefficient state-owned enterprises (SOEs) inherited from socialism (Sachs 1991: 3; see also Sachs 1996; Frydman, Gray, and Rapaczynski 1996; Kosolowski 1992; Lipton and Sachs 1990; Fischer and Gelb 1991; Blanchard et al. 1993: 10-11; Carlin, Reenen, and Wolfe 1994: 72; see also Spenner et al. 1998). The notion of pursuing an industrial policy, let alone relying on SOEs to
spearhead development, “flies in the face of everything we know about the behavior of states around the world” (Frydman, Rapaczynski, and Turkewitz 1997: 85).
The “big-bang” or Shock Therapy policies shared the neoclassical economic assumption of atomized, rational actors without systematic information deficiencies.2 Once the incentive structure was correct, everything else would follow (see Murrell 1993; Gowan 1995). As Vaclav Klaus, the architect of the Czech transition and the chief
spokesperson for neoliberalism in the region in the first half of the 1990s, stated, “[C]reating the conditions for the market to work and for private institutions to flourish can accomplish the economic and the social transformation ... [people will] change their patterns of behavior and ... adjust their activities rationally and voluntarily if the market provides the right incentives” (quoted in Blejer and Coricelli 1995: 100).
The neoliberals planned to let the market work by freeing up prices and allowing foreign firms to compete in the domestic economy. Given these “true” price signals, and a stable economic environment created by stabilization (i.e., austerity) programs, the Smithian private actors created by privatization would utilize resources in such a way as to maximize efficiency, and quickly establish a growth trajectory based on each country’s “comparative advantage.” By allowing the invisible hand to guide restructuring, Eastern Europe would quickly catch up with the West or, as Sachs puts it, experience a
“democratically based rise in living standards” (Sachs 1994: 25).
This Smithian transition strategy won the day: “the majority of countries in the former Soviet Union and in Central and Eastern Europe adopted what can best be described as shock therapy or the big bang approach …” (UNDP 1999: 30). This was “the most dramatic episode of economic liberalization in economic history” (Murrell 1996: 31), “a landslide victory of the neoliberal project” (Greskovits 1998: 22-23). Of course, things haven’t turned out the way the neoliberals thought they would, as all but the most outlandishly Panglossian takes on the Former Soviet Union (FSU) see it as an unmitigated disaster.
The neoliberal explanation for the obvious failure of Russia and other
postcommunist countries is that they did not adequately implement the Shock Therapy package. A failure to stabilize (Åslund, Boone, and Johnson 1996; de Melo, Denizer, and Gelb 1996; Fisher, Sahay, and Vegh 1996; Sachs and Warner 1996; Sachs 1997) and to carry out price and trade-liberalization policies (de Melo and Gelb 1996; Selowsky and Martin 1997) were identified as causes of poor performance. In addition, poor outcomes were explained by the corrupt behavior of elites and the maintenance of public finance
(Johnson, Kaufmann, and Shleifer 1997). Indeed, this is the position taken in the official publications of the World Bank and the European Bank for Reconstruction and
Development (see EBRD 1999). For some neoliberal observers, failures are the result not of bad policies but of the “cronyism” that is seen as implicitly endogenous to a nation’s culture.
I start from a neoclassical sociological position, building on the Marxian and Weberian understandings of capitalism. In this tradition, successful capitalist
development requires not just markets but capitalist social-property rights (see Brenner 1986) and a strong bureaucratic state (see Weber 1978; Evans and Rauch 1999). From this perspective, the radically anti-statist Shock Therapy package does more harm than good, because it weakens the state. As a result, it was precisely the Shock Therapy policies implemented by neoliberals that resulted in the de-modernization and impoverishment of large parts of the postcommunist world. Although neoliberals are correct in their view that “corruption” is intimately connected to economic activity in postcommunist society, in many important ways this corruption is a by-product of Shock Therapy itself, as will be explained below. In my sociological analysis, corruption is a by-product of the transformation of the bureaucratic state into a patrimonial one, in which personalistic networks permeate the state, and the separation of the officeholder from the office becomes blurred.
Of course, other factors contribute to postcommunist performance. Foreign direct investment (FDI) confers enormous advantages in terms of securing investment capital, technology transfer, and access to Western markets (see King 2000; 2001a, 2001b; King and Varadi 2002).3 From the neoclassical sociological position, this is likely stemming
from the fact that MNCs “transplant” capitalist social-property relations in the host country.4 Those countries in the postcommunist world which have been able to avoid a Russian-style debacle and resume growth trajectories have been able to do this because their firms managed to insert themselves into global networks producing high value-added manufactured goods. So far, central Eastern Europe and Estonia have been able to avoid the fate of the Soviet Union only because of Western investments and
co-production agreements. This position is not unique to the neoclassical sociological position, since many neoliberals are also boosters of FDI.
Another factor that is important in explaining the variation in growth of
postcommunist economies from the neoclassical sociological position is the “advantage of lateness,” or the initial level of development; in particular, the extent of
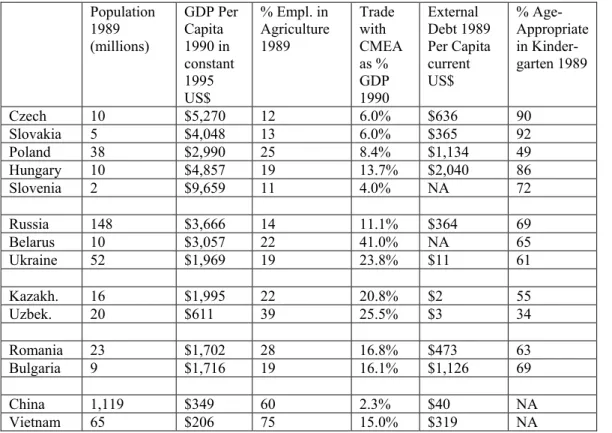
industrialization. The advantage of switching resources from low-productivity traditional agriculture to a system of rural industry provides enormous one-time gains in labor productivity, since human muscle is greatly multiplied when put to work on machines. Conversely, once industrialization has been completed, more developed countries should have a greater stock of human capital and more developed infrastructure, and therefore should have an advantage in global markets relative to less developed societies. Table 2 provides data on some “initial conditions” of countries in the postcommunist world. Again, although there is some disagreement with the neoliberal camp, most neoliberal economists would agree with this position.
Table 2: Initial Conditions Population 1989 (millions) GDP Per Capita 1990 in constant 1995 US$ % Empl. in Agriculture 1989 Trade with CMEA as % GDP 1990 External Debt 1989 Per Capita current US$ % Age-Appropriate in Kinder- garten 1989 Czech 10 $5,270 12 6.0% $636 90 Slovakia 5 $4,048 13 6.0% $365 92 Poland 38 $2,990 25 8.4% $1,134 49 Hungary 10 $4,857 19 13.7% $2,040 86 Slovenia 2 $9,659 11 4.0% NA 72 Russia 148 $3,666 14 11.1% $364 69 Belarus 10 $3,057 22 41.0% NA 65 Ukraine 52 $1,969 19 23.8% $11 61 Kazakh. 16 $1,995 22 20.8% $2 55 Uzbek. 20 $611 39 25.5% $3 34 Romania 23 $1,702 28 16.8% $473 63 Bulgaria 9 $1,716 19 16.1% $1,126 69 China 1,119 $349 60 2.3% $40 NA Vietnam 65 $206 75 15.0% $319 NA
For % in agriculture, Czech Republic, Russia, Kazakhstan, Uzbekistan data is for 1990. For Slovakia and Vietnam, data is for 1991, and for Slovenia data is for 1993.
For debt, Kazakhstan and Uzbekistan data is for 1992, Ukraine data is for 1993.
Source: Population, GDP, agriculture, and external-debt data from World Bank 2001. CMEA trade data from De Melo et al. 2001. Kindergarten data from UNDP 1999. Policy data from historical summaries.
The Neoclassical Sociological Theory of the Transition to Capitalism in Postcommunist Society: Shock Therapy as Generating De-Modernization
Whereas the neoliberals advocate Shock Therapy, including the rapid
privatization of large state-owned enterprises (SOE), the sociological theory of transition posits that these policies will create supply-and-demand shocks that devastate the
financial position of postcommunist firms. These firms are subsequently unable to restructure themselves to be competitive on international markets or the liberalized domestic market. As output declines, so do taxes, creating a severe fiscal crisis of the state, which in turn leads to the weakening of its bureaucratic character and the erosion of
its support for the institutions that are necessary for modern capitalist development. The result is a system of capitalist property relations (albeit with a significant non-capitalist sphere) without a bureaucratic state. Rather than locking in “market reforms,” the neoliberal policy package managed to lock in a type of capitalism that produces de-modernization. In other words, Shock Therapy induced a new equilibrium -- one that is incapable of generating significant investment and thus dynamic growth, and instead brings about an “involutionary” outcome (Burawoy 1996).
The Three Shocks
The negative shocks to the domestic economy which follow rapid liberalization of prices and foreign trade, as well as the shock associated with the austerity of
“stabilization” programs, have been extensively discussed by critics of the Washington Consensus (the most prominent is Nobel Laureate Joseph Stiglitz 2002; see also Gowan 1995, 1999; Andor and Summers 1998; Chussodovsky 1997; Amsden, Kochanowicz, and Taylor 1994; UNDP 1999: 29). Rapid price deregulation, given the often monopolistic structure of Soviet-style economies, will lead to a rapid increase in the prices of inputs, creating an enormous supply shock as producers are unable to afford adequate levels of necessary inputs. In addition, the wholesale liberalization of imports created a large drop in aggregate demand for domestic producers, since they now faced global competitors -- some were more technologically advanced, and others had cheaper labor.
The shock that accompanies the fiscal and monetary austerity of “stabilization” packages is also well documented. With tight money, government subsidies cut, and
credit dramatically more expensive, most firms run into severe cash-flow problems and a shortage of capital for investments and even day-to-day operations.
There was also the devastating shock resulting from the political destruction of the old Warsaw Pact CMEA (or COMECON) trading system. For many states, a vast majority of exports and imports were from the former CMEA, accounting for a huge amount of economic activity, as shown in Table 2. The breakdown of this trading system therefore disrupted supply chains and created a gigantic loss of markets.
In addition to these shocks, this paper adds the shocks resulting from large-scale privatization, a pillar of the neoliberal package which is not often directly criticized. My neoclassical sociological account of privatization distinguishes between two different types: that of small enterprises and that of large and medium-sized enterprises. The rapid privatization of small and some medium-sized businesses is beneficial, because it
provides a superior incentive structure for those in control of these enterprises. Large SOEs, however, cannot be privatized rapidly without unacceptable costs. King has refered to the neoliberal policy of rapid privatization of large enterprises via mass privatization techniques as “shock privatization” (2003). Shock privatization creates severe direct and indirect supply-and-demand shocks for enterprises.5 Most important, shock privatization means that the resulting private corporation will not have an owner or owners with sufficient resources to restructure the company. This is, of course, a
consequence of attempting to “make capitalism without capitalists” (Eyale, Szelenyi, and Townsley 1998), and is probably the single biggest negative effect of shock privatization. A typical large postcommunist firm, when it begins its life as a privatized enterprise, will face the devastating crises induced by the destruction of the CMEA trading system, as
well as stabilization and liberalization shocks. Without any capital to carry out
desperately needed restructuring, and without the injection of any new managerial talent, many firms found themselves in untenable positions. It is only logical that owners, managers, and workers, unable to work cooperatively through the firm to better their common cause, would look to find solutions to their personal problems -- in this case, their quest to accumulate wealth and survive the transition. Shock privatization also frequently created outside owners with very poor arrangements to monitor firm managers or even to monitor other (typically inside) owners. This was virtually inevitable, since there was almost none of the enormous business infrastructure (Elson 1991), or the protection of shareholder rights, that help “make markets” in advanced capitalist systems. The combination of these two conditions led to large amounts of asset stripping in the postcommunist economy, wreaking havoc on the functioning of many firms. This is a paradox from the neoliberal perspective: while involving the state in the economy is allegedly a recipe for rent-seeking behavior, not involving the state in the transition creates an environment that encourages corruption (see King 2001a, 2001b).
All of these effects combine to create newly privatized firms that were unable to carry out desperately needed restructuring (they had often experienced a long period of decline or had never been modernized). Not only could these firms not afford to
meaningfully restructure; they also suffered from severe financial crises. Firms responded in a number of ways. First, there was a huge decrease in paid wages, made primarily through arrears but also through payment in kind. Firms often resorted to providing workers with direct access to the means of subsistence (typically via garden plots and/or collective potato farming) as a means of keeping their workers (Southworth 2001; King
2002). As Table 3 shows, in 1999 many firms throughout the region still had wage arrears. Second, firms reduced their demand for inputs. This drop in demand was led by the drop in investments. As Table 3 also indicates, there was a huge decline in gross capital formation in constant dollars throughout the postcommunist world outside of Central Europe and East Asia. By the end of Russia’s mass privatization program in 1994, investment was only 30% of its 1990 level. By 2000, it was a dismal 18% of its 1990 level, the same level of decline as in Ukraine.
These three shocks -- swift and extensive liberalization, stabilization, and mass privatization -- all weaken firms. When these shocks overwhelm upstream producers of crucial industrial inputs, additional supply shocks occur for downstream industries. Many industrial-supply firms had developed what Williamson calls “asset specific knowledge”; that is, they produced goods with the special knowledge of the specific needs of their purchaser (Williamson 1975). These types of suppliers will be very difficult or impossible to replace in the short term. Even if the firm finds a replacement, it will probably be a foreign supplier, and the cost may well be prohibitive even if the firm has access to credit to finance the purchase.
These direct supply-and-demand shocks create additional shocks by weakening the state. As firms entered into financial crisis and technical bankruptcy, the first thing to go was often their payment of taxes, which at any rate were contracting along with the economy. In Russia, for example, receipts of the consolidated state budget declined from 41% of GDP in 1990 to only 26.8% in 1997 (Vorobyov and Zhukov 2000: 5). This had the rather immediate and obvious effect of drastically reducing state orders from
(see King 2002). As Table 3 indicates, the decline in total government consumption is generalized throughout the postcommunist world outside of Central Europe and East Asia. This loss of sales revenues from the state constitutes another major demand shock for firms.
This loss of revenues, when combined with the anti-statist ideology of the neoliberals, quickly led to a lack of state support for the basic institutions that enable firms to successfully restructure by raising their quality and changing their product line so that they can compete in the world market. An important instance of this occurs when the state stops supporting the educational institutions that turn out skilled manpower, leading to a crisis for many firms. Of particular importance is the production of experts with scientific credentials by local polytechnic institutes. In only two years (from 1993 to 1995), the number of technicians in R. & D. per million of the Russian population fell from 905 to 688, a drop of just under 24% (World Bank 1999). While some of this is brain drain, case-study data indicates that much is also the result of a shortage of new technicians (King 2002). Table 3 shows a measure of the decline of scientists during the 1990s. Russia’s level fell by 19% from 1994 to 1999, after the biggest decline must already have occurred. Similarly, Ukraine’s level declined by a full 36% from 1995 to 1999, after what also had to be enormous earlier declines. This decline in education affected not only institutions of higher learning but primary education as well, as indicated in the decline of the proportion of children attending kindergarten, which is reported in Table 1. Thus, it looks like the shortage of skilled manpower will only intensify in the future.
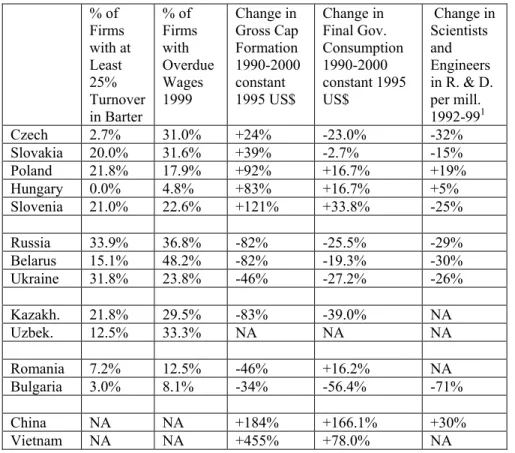
As a result of widespread financial crises, firms up and down commodity chains are unable to get the money or credit they need in order to continue production. Rather than go out of business, however, managers reactivate old “horizontal” ties (or generate new ones) to managers at other firms that functioned to compensate for the scarcity of inputs in the shortage economy (see Kornai 1980). These networks now function to aid in production, given the absence of money and credit in the new capitalist economy, and the network ties allow the firms to withdraw from the market through inter-enterprise arrears, debt-swaps, and barter (see David Woodruff [1990] for an outstanding account of these processes in Russia). Table 3 lists the extent of barter in 2000, based on a firm-level sample conducted by the World Bank and the EBRD. Barter decreases the efficiency of these transactions (because typically a middleman must be used), shields firms from market pressures (because business partners are based on network ties, not price considerations), and makes taxation highly problematic (because it makes it easy to conceal transactions from the state, since in-kind taxes, which are difficult and expensive to collect anyway, are easy to overvalue when they are paid).
Table 3: Firm Behavior and Restructuring % of Firms with at Least 25% Turnover in Barter % of Firms with Overdue Wages 1999 Change in Gross Cap Formation 1990-2000 constant 1995 US$ Change in Final Gov. Consumption 1990-2000 constant 1995 US$ Change in Scientists and Engineers in R. & D. per mill. 1992-991 Czech 2.7% 31.0% +24% -23.0% -32% Slovakia 20.0% 31.6% +39% -2.7% -15% Poland 21.8% 17.9% +92% +16.7% +19% Hungary 0.0% 4.8% +83% +16.7% +5% Slovenia 21.0% 22.6% +121% +33.8% -25% Russia 33.9% 36.8% -82% -25.5% -29% Belarus 15.1% 48.2% -82% -19.3% -30% Ukraine 31.8% 23.8% -46% -27.2% -26% Kazakh. 21.8% 29.5% -83% -39.0% NA Uzbek. 12.5% 33.3% NA NA NA Romania 7.2% 12.5% -46% +16.2% NA Bulgaria 3.0% 8.1% -34% -56.4% -71% China NA NA +184% +166.1% +30% Vietnam NA NA +455% +78.0% NA
Change in scientists and engineers in Slovenia 1992-1998, Russia 1995-1999, Ukraine 1995-1999, Belarus 1992-1996, China 1994-1996. Policy data from historical summaries presented below. Barter and wages from the World Bank’s BEEPS survey. Capital formation, government consumption, and scientist and engineer data from World Bank 2002 (CD-ROM).
The loss of tax revenue from enterprise failure, exacerbated by the rise of hard-to-tax barter, inevitably weakened the state. As the state was increasingly unable to meet its formal obligations, it began to break down. Poorly paid (or unpaid) state officials are easily corrupted, and the bureaucratic nature of the state decomposed. It became riddled by reactivated (as well as new) patron-client ties between government officials and businessmen. Private market success came to depend to a great extent on arbitrary political decisions and the exercise of private force.
It is notoriously difficult to provide a reliable and valid measure of the
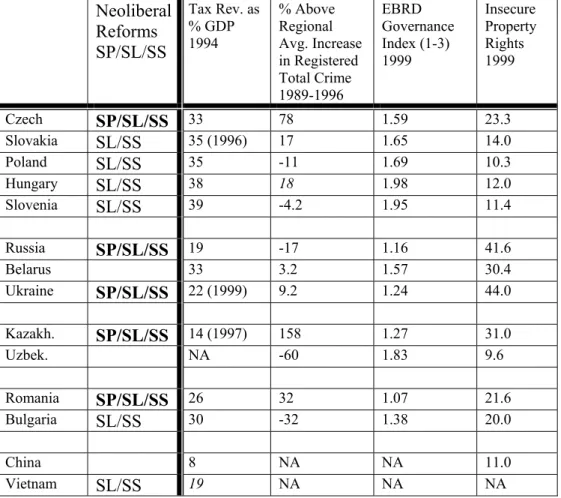
bureaucratic nature of the state or of state capacity. Table 4 provides several attempts at such measures. The EBRD Governance Indicator is a composite score ranging from 1 to 3, taken from the World Bank’s Business Environment and Enterprise Performance Survey, that averages firms’ perceived hindrance resulting from microeconomic factors, macroeconomic factors, physical infrastructure, and law and order (EBRD 1999: 116). Of course, as will be argued below, we should use composite indicators with great caution. Still, this indicator represents something -- at the very least, the reported perceptions of the provision of infrastructural support and the bureaucratic nature of the state (it measures bureaucracy because it gets at the impersonal application of formal rules and regulations, and the separation of the office from the officeholder [Weber 1978]).6
Another measure is the tax revenue as a percentage of GDP, the idea being that a stronger state can extract more resources from society than a weaker state can. While longitudinal data on revenues would be best, the World Bank doesn’t report tax revenue for most transition states prior to 1994, and thus it is impossible to discern the change in revenues during the crucial period from the system change until 1994.7 The security of property-rights values are taken from the World Bank’s World Business Environment Survey, which asked firms, “To what degree do you agree that the legal system will uphold contracts and property rights?” The score is the combined answers of “Strongly disagree” and “Disagree.” The higher the score, the lower the perceived bureaucratic nature of the state.
Change over time in state capacity is also captured by the increase in registered total crimes: the argument being that a state with greater capacity can prevent or deter
more crime than a state with less capacity. However, crime rates are clearly very much a reflection of state capacity: in weaker states, fewer crimes will be recorded, and they are likely to be more serious and violent (UNDP 1999: 23). In a weak state like Russia, for example, “recorded crime in the federation might be no more than one quarter to one third of total crime” (UNDP 1999: 23). Thus, comparisons within regions (which are likely to have similar overall levels of state capacity) are more valid measures of state capacity than comparisons across regions.
These indicators, while very far from perfect, give us some purchase on relative state capacity or strength of bureaucracy. A startling pattern in the data is that, in regional comparisons, those countries that implemented mass privatization programs had worse state capacity and less secure property rights than those which privatized in other ways. The major exception to this pattern is Russian crime rates, which are substantially below their true level.
Table 4: Measures of State Capacity, Security of Property Rights, and Mass Privatization Programs Neoliberal Reforms SP/SL/SS Tax Rev. as % GDP 1994 % Above Regional Avg. Increase in Registered Total Crime 1989-1996 EBRD Governance Index (1-3) 1999 Insecure Property Rights 1999 Czech SP/SL/SS 33 78 1.59 23.3 Slovakia SL/SS 35 (1996) 17 1.65 14.0 Poland SL/SS 35 -11 1.69 10.3 Hungary SL/SS 38 18 1.98 12.0 Slovenia SL/SS 39 -4.2 1.95 11.4 Russia SP/SL/SS 19 -17 1.16 41.6 Belarus 33 3.2 1.57 30.4 Ukraine SP/SL/SS 22 (1999) 9.2 1.24 44.0 Kazakh. SP/SL/SS 14 (1997) 158 1.27 31.0 Uzbek. NA -60 1.83 9.6 Romania SP/SL/SS 26 32 1.07 21.6 Bulgaria SL/SS 30 -32 1.38 20.0 China 8 NA NA 11.0 Vietnam SL/SS 19 NA NA NA
SP (Shock Privatization) = Privatized at least 25% of large SOEs under a mass privatization program within two years.
SL (Shock Liberalization) = Liberalized at least 75% of imports and domestic prices within two years. SS (Shock Stabilization) = Implemented an IMF approved stabilization package.
Insecure property rights is the percentage in the World Bank’s World Business Environment survey that reported that they disagreed in most cases or strongly disagreed that the legal system will uphold contract and property rights. Governance Index from World Bank 1999; revenue data from World Bank 2002 (CD-ROM). Crime rates from UNDP 1999: 24. Transition policies from historical narratives.
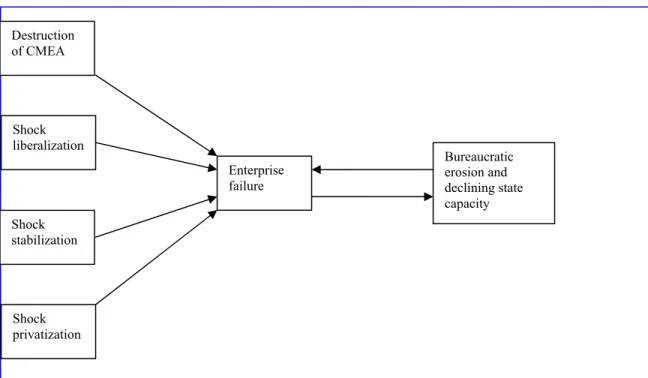
Putting all of these causal arguments together, we see the disadvantages from the full package of Shock Therapy for firm performance, as well as the indirect effects on state capacity. Failing firms and a failing state creates a vicious cycle of enterprise failure and bureaucratic breakdown, resulting in what Burawoy calls “involution” (1996) as wealth is pumped out of the system. Figure 1 captures the causality in this circle.
Figure 1: The Vicious Cycle of Enterprise and State Failure Created by Shock Therapy
Rather than a system of rational modern capitalism emerging in the Former Soviet Union and much of Eastern Europe, a system of “patrimonial capitalism” seems to have taken root (King 2002; King and Szelenyi 2003). Following Weber (1978), this is a system in which extensive personal networks link (1) state elites and enterprise owners (political capitalism), (2) enterprise managers and their employees (merging workers with the means of production and subsistence), and (3) managers in upstream and downstream companies (market mechanisms of exchange). It is also characterized by a non-bureaucratic state.8
To the extent that firms can retreat from product markets via horizontal networks with other firms, and from labor markets through the binding of workers to the enterprise
Shock privatization Enterprise failure Shock liberalization Bureaucratic erosion and declining state capacity Destruction of CMEA Shock stabilization
reinvest in the means of production to maximize the price-cost ratio. Indeed, given the pervasiveness of political capitalism and the non-bureaucratic nature of the state, such a strategy will be risky. Rather, it is more rational to invest resources to maximize political power (see Brenner’s notion of “political accumulation” [1976]), or to “capture the financial flow” and channel as much money out of the country into private bank accounts as possible. By all indications, this is what has been, and still is, happening in Russia on an enormous scale. “[T]he dimensions of capital flight from Russia is about $40 billion a year,” an amount, coincidentally, that is about equal to the extremely high level of foreign investment in China in the late 1990s (Golovachev 2002).
The Empirical Record
A comparison of the reform experience of the central Eastern European countries (Hungary, the former Czechoslovakia, Poland, and Slovenia) and the biggest
postcommunist states (Russia, Ukraine, Belarus, Kazakhstan, and Uzbekistan), along with East Asian reform-communist systems (China and Vietnam), reveals a very strong pattern that is almost completely inconsistent with neoliberal theory and completely consistent with sociological theory. Owing to space considerations, this paper does not discuss all cases. Most of the unexamined cases are quite small -- Moldova (population: 4 million), Armenia (4 million), Azerbaijan (8 million), Croatia (4 million), Serbia (11 million), Georgia (5 million), Macedonia (2 million), Tajikistan (6 million) -- and have experienced very serious external or internal wars, events that are likely to overwhelm any effect of economic policy on economic performance.
The remaining unanalyzed states are also very small, and were very dependent on imports and exports from Russia, as can be seen by the ratio of imports and exports to the CMEA as a percentage of GDP in 1990: Turkmenistan (population: 5.2 million, and 33.0%), Kyrgyzstan (4.9 million and 27.7%), Lithuania (3.7 million and 40.9%), Latvia (2.4 million and 36.7%), Estonia (1.4 million and 30.2%), Mongolia (2.4 million and 31%). Albania (3.4 million and 6.6%), although not greatly influenced by the collapse of CMEA trade and Russia, was severely affected by the Kosovo crisis (the country was inundated by more than 450,000 refugees). Generally, the smaller the country, the greater the chance that it will be even more dependent on the fate of the Russian economy, or that it is able to get enough FDI to partially reorient the economy toward manufacturing exports to the West (as seems to be happening in the Baltic States, most prominently Estonia).9 Thus, the less likely domestic economic policy will have a major effect on performance.
Russia Compared with China: Neoliberal Versus Gradualist and Statist Transition Policies
Looking first at the two biggest cases of postcommunist transformation broadly conceived, China and Russia, we see a pattern that is impossible to square with neoliberal theory. Russia’s transition policy was crafted and implemented by radical neoliberal reformers with extremely close working relationships with Jeffrey Sachs and other leading neoclassical theorists (see Wedel 2001: 123-174). Yeltsin and the young reformers led by Gaidar and Chubais implemented all three elements of the Shock Therapy package in spectacular fashion. China, in contrast, systematically violated every
neoliberal precept. China’s vastly superior performance, as compared with Russia’s, is thus inconsistent with neoliberal theory.
In Russia, in January 1992, “[a] radical reform package focusing on economic liberalization and privatization was adopted …” (EBRD 1996: 169). This also included a stabilization policy, initiated by Yegor Gaidar (the acting prime minister in 1991-92), that is justly famous. “An extraordinary improvement in the budget balance -- a text book example -- was accomplished. Arms procurement was initially cut by 85 percent, … Many subsidies were cut and state investments were minimized…. The old Soviet government administration had also been radically reduced through its merger with the Russian government” (Aslund 1995: 187). As a result, government spending (along with the government) shrank enormously in one year. Russia also moved to curtail credit: “The refinance rate was only 20 percent per annum at the beginning of 1992. It was raised to 50 percent per annum that April and to 80 percent per annum in June” (Aslund 1995: 188). In an endnote, the author writes, “These official rates are not properly compounded. The official interest … rate of 80 percent …was actually 117 percent per annum” [note 6]).
Liberalization was accomplished equally swiftly. “Price liberalization was imposed through a presidential decree of December 3, 1991, ‘Measures to Liberalize Prices,’ which [stated] that ‘on January 2, 1992 [the Russian Federation would undertake] the basic transition to free (market) prices and tariffs formed under the influence of demand and supply’ on producer goods, consumer goods, services and labor…. [The plan] took place as announced on January 2, 1992” (Aslund 1995: 140). Similarly, “a substantial liberalization of foreign trade went into effect in January 1992 …,” even if this was less
than desired. The state trading monopoly was also abolished (EBRD 1999: 258). Six months after Gaidar’s stabilization and liberalization measures were implemented, a mass privatization program relying on citizen vouchers was launched in June of 1992. “By July of 1994, 15,052 medium and large-scale enterprises, employing more than 80 per cent of the industrial workforce, had been privatized …” (EBRD 1996: 169). This was far and away the largest transformation of property in history.
Russia’s horrid performance is in sharp contrast to the spectacular growth in China in this same period. China achieved stunning success despite the fact that it carried out none of the three elements of Shock Therapy. Rather than pursue radical capitalist reforms, China implemented an agrarian reform in 1978 that transferred the control of land to peasant households (with long-term leases) and allowed them to market their production after meeting state quotas. Combined with 1984 reforms allowing the formation of village and township enterprises (VTEs), dynamic rural industrialization took off. These VTEs were marketized firms with hybrid ownership patterns (part local state, part private ownership) (see Nee 1992; Walder 1995; Oi 1999). The VTEs, combined with significant flows of FDI, more than 70% of it from Taiwan and Hong Kong, created a large group of export-oriented labor-intensive manufacturers (Naughton 1997: 11).
Privatization of large SOEs began only in 1994, after a large class of domestic capitalists already exists. Local governments adapt the speed of privatization, and local welfare policies, to minimize negative externalities. As a result, rapid large-scale privatization is normally carried out only in those areas where there are many private firms, so that the economic disruption (such as unemployment) is minimized (Cau,
Quian, and Weingast 1997: 15; Naughton 1998: 276). Instead, many SOEs have been “corporatized” or turned into Joint Stock Companies. Typically, the government (through the treasury remains the biggest shareholder, while other state-owned investment
institutions also have large blocks of shares. In spite of this momentous change, by 2002 only a tiny fraction of SOEs had been privatized.
By growing a capitalist sector from below, China developed a mixed economy in the course of two decades. Price liberalization proceeded in connection with the growth of the unplanned private and VTE sectors. It began in agriculture in 1978, with peasants allowed to sell their surplus production for market prices once they met their quota to the state at fixed prices. As these reforms proved effective, they were extended to the rest of the economy, so that SOEs could sell their output that was above the requirements of the plan at market prices. As the non-planned sector grew, more and more of the economy was free of price controls (McKinnon 1995: 98). Thus, China has “grown out of the plan,” in Naughton’s apt phrase (1995). Prices in the planned sector were also gradually rationalized to reflect the market price; by the early 1990s, more than 70% of prices were decontrolled, up from 10% in 1981 (McKinnon 1995: 104).
Trade liberalization was handled in the same manner, with special economic zones set up in Guangdong (these were connected to Hong Kong trade). In these zones, which became numerous and spread along the coast, “exporters could retain all of the foreign exchange earnings while having freer access to imported materials and foreign capital or trading services” (McKinnon 1995: 99). By the 1990s, “the difference between ‘special economic zones’ and the rest of the economy had been eroded” (McKinnon 1995: 99). Finally, even though China managed to avoid the hyperinflation that had
devastated Russia after liberalization, it did so not because of the implementation of monetarist stabilization policies. Broad money, which includes printed money plus easily available credit, “[H]as been very high -- averaging about 23 percent per year for more than a decade” (McKinnon 1995: 107).
The contrast between Chinese and Russian performance couldn’t be more stark. Measured in 1995 US$, GDP per capita shrank by 35% in Russia and expanded by 137% in China. Male life expectancy during the period from 1991 to 2000 declined by five years in Russia and grew by two years in China. By the late 1990s, Russia was losing about $40 billion a year in official and unofficial capital flight, about equal to the amount of FDI flowing into China. Indeed, China has had the best growth in the world since starting its reforms, while Russia (along with other postcommunist countries) has experienced the greatest peacetime decline ever recorded (Stiglitz 2002).
Neoliberals could dismiss the Russian-Chinese comparison by arguing that the “advantages of lateness” are actually much more important than economic policy, and that they account for the observed difference between East Asia and the rest of the postcommunist world (see Parker, Sachs, and Woo 1994). As Table 2 indicates, China and Russia had two very different starting points. China was experiencing not only a transition to a more capitalistic economy but a transition to an industrial society as well. The argument is that a very large gain in labor productivity occurs as people leave ultra-low-productivity traditional agriculture for rural industrial production. The late
industrializer is able to combine super-cheap labor with recent, if not the newest,
technological production methods (the “trailing edge” technologies and industries). This gives exporters enormous price advantages in international markets, allowing them to
earn hard currency to fund the purchase of technology for further labor-productivity-enhancing investments (and further exports).
In addition, the communists lost power in Russia, whereas the Chinese
Communist Party is alive and well after crushing the democracy movement at Tiananmen Square. Competitive elections might arguably make a difference, as special interests could exert influence to weaken necessary reforms. Alternatively, competitive elections can reduce corruption by making politicians accountable, and thereby contribute to growth. However, looking at the diversity of political outcomes in the postcommunist world (Table 2), we see that China and Russia are actually on a continuum. Belarus and the Central Asian countries are dictatorships, while Russia, Ukraine, and many of the countries of southern Europe are best understood as semi-authoritarian regimes (McFaul 2002). Similarly, the communists in China are well on their way to being just another dictatorship, as communist ideology becomes hollowed out, as typified by the invitation of private entrepreneurs into the Party.
Still, because countries in different regions have very different histories and may well be operating in very different environments, comparisons between countries in different regions makes it more difficult to discern causality. It is therefore useful to compare postcommunist countries in the same region. This provides a very rough control for a host of variables that can affect economic performance, such as geographical proximity to the advanced core, geopolitics, culture (or religion), level of development, political stability, and strength of democracy. For this reason, these comparisons are perhaps the most compelling demonstration of the dangers of Shock Therapy.
The following comparisons, as well as the coding of policy variables in Tables 1, 3, 4, and 5, are based on the sources listed in the historical narratives in Appendix 1.
The Central European Cases Compared
It is rather remarkable that the Czech Republic has had the lowest economic growth in the region (see Table 1), a meager one percent in 10 years, despite the fact that it was the most developed country in the region (excluding tiny Slovenia), obtained the largest amount of FDI per capita, had a very low level of external debt, and had the historical legacy of being the industrial heartland of the Austro-Hungarian empire.
Because of these advantages, the fact that the Czech Republic pursued the most ambitious mass privatization is a gigantic problem for advocates of the full neoliberal package. In Poland and Slovenia, the legacy of worker organizations prevented the rapid privatization of large socialist-era enterprises. In the Slovak Republic, Vladimir Meciar, at the time the bête noire of the West, canceled the second wave of voucher privatization after the split with the Czech Republic. Thus, Slovakia experienced a significantly smaller privatization shock than the Czech Republic.
The argument advanced in this paper about the negative effects of mass
privatization on state capacity (bureaucratization) is similarly supported by the Central European comparison. As is clear from Table 4, the Czech Republic records a lower value for the EBRD’s indicator of state capacity, and has by far the largest increase in recorded crime. The greater insecurity of property rights relative to its neighbors should be deeply troubling to the neoliberals as well. Since the Czech Republic is as democratic as other countries in the region, it is quite plausible that this is the direct result of the
greater privatization shock experienced in that country. As Table 3 clearly shows, the Czech Republic also had the smallest level of capital formation, the greatest decline in government consumption, and the greatest decline in the number of scientists and engineers in R. & D., in spite of its very high level of FDI. If not for the Czech Republic’s privileged location and history, which enabled this high level of FDI, its economic performance would have been substantially worse.
The Central European cases are also interesting when assessing the role of FDI in the transition. In comparison to the FSU, there are much higher levels of FDI overall, and thus a much greater export of Western capitalist property relations. This does not favor the neoliberal position, however, because even if FDI is a consequence of pro-FDI (presumably neoliberal) policies, a position that is very difficult to sustain empirically,10 the fact remains that in Central Europe the developmental outcome is the opposite of the neoliberal expectation. That is, even if high levels of FDI accrue to countries with more neoliberal policy regimes, thus far this has not balanced out the negative effects of the Shock Therapy package -- especially mass privatization.
Eastern Europe: Bulgaria and Romania Compared
Both Romania and Bulgaria pursued a good deal of Shock Therapy, although only Romania implemented a significant mass privatization program. As Table 1 shows, Romania, the more complete neoliberal reformer, performed slightly more poorly than Bulgaria.11 Not only did it have worse growth; it had a sharper increase in poverty, and a much greater fall in kindergarten enrollment rates. And, as my neoclassical sociological theory would predict, Bulgaria had a relatively stronger state than Romania on all four
indicators (although the difference in property rights is too small to be significant) (Table 4). Still, in both countries, generally, economic performance has been terrible,
somewhere between the central Eastern European nations and the Former Soviet Union. This is partially explained by the higher level of integration that Bulgaria and Romania had in the CMEA relative to the central Eastern European cases (Table 2) and their inability to attract FDI (cumulative net FDI inflows per capita 1990-2000 were only $403 in Bulgaria and $292 in Romania).12
Overall, Shock Therapy advocates would have a tough time explaining Bulgarian and Romanian performance. If they claim that stabilization and liberalization policies are enough Shock Therapy to be responsible for growth in Poland, they will have a hard time explaining why these policies did not produce more growth in Romania and Bulgaria. Neoliberals would claim, especially in Bulgaria, that the policies did not work because they were not implemented consistently. However, Poland also reversed many of the neoliberal policies of the Balcerowicz program after 1993 without damaging Poland’s performance. Indeed, growth took off only after policy was changed following the election of a left-wing government that had an explicitly interventionist policy (see Kolodko and Nuti 1997; Snadjer and King 2002).
European States of the Former Soviet Union
The pattern found in Central and Eastern Europe also appears to hold among the successor states of the Former Soviet Union. The neoliberal explanation would predict that, all things being equal, those successor states which pursued more Shock Therapy
would perform better than those which performed less Shock Therapy. Here, again, the comparative evidence disconfirms the neoliberal position.
Russia, as discussed above, had a triple dose of Shock Therapy. Belarus, under the anti-Western populist Alyaxandar Lukashenka, had none of the three components. Belarus’s average rate of growth per capita was a poor -0.5%, but Russia, which adhered far more stringently to neoliberal prescriptions than Belarus did, had a -3.5% growth rate in the same period, six times as big a fall. Ukraine’s transition policies were somewhere between Russia’s and Belarus’s, but much closer to the former. Ukraine clearly had enough Shock Therapy that neoliberals would predict much higher growth than in Belarus. Again, the record is inconsistent with the neoliberal position: average GDP per capita shrank by an amazing 7.5% per year from 1991 to 2000.
The relationship between neoliberal policy (especially mass privatization) and state capacity follows the same pattern as in central Eastern Europe. Belarus is superior to Russia and Ukraine on three of the four indicators of state capacity. The only exception is Russia’s lower crime rate, but this is probably a consequence of underreporting in Russia, as discussed above.
Central Asian States of the Former Soviet Union
Let us take a final look at the last two large successor states, both part of Central Asia: Kazakhstan (population: 16 million) and Uzbekistan (24 million). Kazakhstan was the star reformer of Central Asia, and implemented all three of the postcommunist reforms. Despite this fairly close adherence to the Shock Therapy package, the economy shrank by 2.5% a year. Uzbekistan pursued a transition policy that was much more at
odds with neoliberal prescriptions, implementing none of the neoliberal package. Yet Uzbekistan’s GDP per capita decreased an average of 2.0% a year, 25% less than the decline in Kazakhstan (this despite the high level of FDI drawn to Kazakhstan’s oil reserves). In Kazakhstan, a quarter of this growth occurred in 2000, when there was a dramatic increase of 10%. This growth followed a huge spike in oil prices in that year ($28 per barrel, compared with only $10 per barrel in February 1999 [UNCTAD 2001: 294]).
From 1991 to 2000, poverty in Kazakhstan increased by 1300%, compared with 160% in Uzbekistan. Even the decline in kindergarten enrollment was more than three times as great (see Table 1). Similarly, in the indicators for which both countries have data, Uzbekistan has much higher state capacity than Kazakhstan (see Table 4). This outcome is, from the neoliberal perspective, quite unlikely, and is all the more surprising because of Kazakhstan’s far more favorable starting point. Kazakhstan was much more developed and better educated, and marginally less integrated into the CMEA system (Table 2).
Table 5 summarizes the neoliberal reforms carried out in the 14 countries, as well as the key initial conditions and the outcomes of growth, state capacity, and security of property rights. It is clear that in every region except in East Asia the countries that came the closest to the neoliberal blueprint (often because they carried out mass privatization schemes) had worse growth performance, less state capacity, and weaker property rights. This finding is even more striking considering that in three of the regions the most neoliberal states also had significant advantages. The Czech Republic had a high level of development, low debt, and low dependence on the CMEA. Only Slovenia had a higher
GDP, but it also lost the huge Serbian market. Bulgaria had far higher external debt than Romania. In the European FSU, Russia was, compared with Belarus and Ukraine, advantaged in terms of initial starting position and the impact of the breakup of the CMEA. And Kazakhstan was far more advantaged than Uzbekistan, without even considering its oil reserves.
In East Asia, Vietnam, the country with the closer adherence to Shock Therapy, grew at only 60% of the rate that China grew. Because countries in this regions are also undergoing a transition to industrialization, China was disadvantaged compared with Vietnam. Vietnam was even less industrialized, and started its reforms a decade later. Unfortunately, the comparison of Chinese and Vietnamese state capacity is complicated by missing data. Taxation as a percentage of GDP measure of state capacity is much lower in China than in Vietnam, but China’s giant size and enormous growth makes this measure potentially very misleading. China has grown so fast that the government still increased its revenues faster than all the other countries in the comparison, and, as Table 3 indicates, it had the greatest gain in government consumption by far. By all accounts, its bureaucracy is fairly well functioning, and a command issued by the Standing Committee of the Politburo will be carried out in the most remote village in short order. And, as measured by perceived enforcement of contracts and property rights, China is among the best performers in the postcommunist world.
Inconsistent Data
Before concluding, let me preemptively address some of the cases that readers might have noticed which don’t seem to fit the pattern of causality implied in my model.
The first thing about these outliers is that they underline the number of variables affecting economic outcomes. As a result, there is bound to be a lot of unaccounted-for variance. One major uncaptured variable concerns the historically contingent development of different leading sectors at different points in time. Thus, a country’s economic success will in part be determined by the dynamics of the particular global markets they are most embedded in. Furthermore, there are likely to be significant uncaptured political
variables. Things like “the balance of political power” (both domestically and
geopolitically) are very difficult to measure in any kind of reliable way, although this balance of power undoubtedly has an impact on economic actors in myriad ways. As a result of this complexity, we should not be surprised that all indicators do not line up perfectly for any theory, either neoliberal or neoclassical sociological. The claim of this paper is that, in terms of economic growth, human welfare, and state capacity
(summarized by Table 5), the data is far more consistent with the sociological theory than with the neoliberal theory.
Table 5: Economic Policy, Growth, State Capacity, and Property Rights Neoliberal Reforms SP/SL/SS GDP Per Capita 1990 in constant 1995 US$ Trade with CMEA as % GDP 1990 External Debt 1989 Per Capita current US$ Avg. GDP Per Capita Change 1991-2000 (in 1995 US$) EBRD Governance Index (1-3) 1999 Insecure Property Rights 1999 Czech SP/SL/SS $5,270 6.0% $636 0.1 1.59 23.3 Slovakia SL/SS $4,048 6.0% $365 0.4 1.65 14.0 Poland SL/SS $2,990 8.4% $1,134 3.7 1.69 10.3 Hungary SL/SS $4,857 13.7% $2,040 1.3 1.98 12.0 Slovenia SL/SS $9,659 4.0% NA 1.9 1.95 11.4 Russia SP/SL/SS $3,666 11.1% $364 -3.5 1.16 41.6 Belarus $3,057 41.0% NA -0.5 1.57 30.4 Ukraine SP/SL/SS $1,969 23.8% $11 -7.1 1.24 44.0 Kazakh. SP/SL/SS $1,995 20.8% $2 -2.5 1.27 31.0 Uzbek. $611 25.5% $3 -2.0 1.83 9.6 Romania SP/SL/SS $1,702 16.8% $473 -1.8 1.07 21.6 Bulgaria SL/SS $1,716 16.1% $1,126 -1.4 1.38 20.0 China $349 2.3% $40 9.0 NA 11.0 Vietnam SL/SS $206 15.0% $319 5.5 NA NA
SP (Shock Privatization) = Privatized at least 25% of large SOEs under a mass privatization program within two years.
SL (Shock Liberalization) = Liberalized at least 75% of imports and domestic prices within two years. SS (Shock Stabilization) = Implemented an IMF approved stabilization package.
Source: Historical summaries and previous tables.
Still, we should closely examine the data that doesn’t fit neatly into the causal theory traced above, and see if any patterns are revealed. The majority of surprising findings are found in Table 3, on enterprise restructuring. The relevant part of the theory for this table is that Shock Therapy induces (1) barter, (2) overdue wages, (3) a decrease in investment, (4) a decrease in government spending, and (5) a decrease in highly educated skilled manpower. It is clear from Table 3 that these processes are going on to a
large extent in many of the postcommunist countries. To the extent that these are above all else “survival strategies” of firms, and that all firms in the postcommunist world suffered severe economic dislocation (if by nothing else than the collapse of their core: Russian inputs and markets accessed through the CMEA system), this data is consistent with the overall causal story traced above.
Close scrutiny of the data, however, reveals what appears to be some strange outcomes. For example, the Central European prevalence of strategies of non-market withdrawal is surprising. In particular, the Czech Republic’s and Hungary’s much lower measurements of these practices than Slovakia, Slovenia, and Poland. In this case, the differences in the structure of property among the cases account for this apparent anomalous pattern, because different types of property have different propensities for engaging in this type of activity.
Slovenia, Slovakia, and Poland had high levels of state ownership of large enterprises, and more modest levels of foreign ownership, compared with Hungary and the Czech Republic. Research in Hungary (Toth 2001) indicates that firms with foreign ownership are much less likely to tolerate inter-enterprise arrears, and do not make late payments to employees, taxes, or other firms. Large SOEs, by contrast, are likely to find it relatively easy to engage in these practices, because they have the same network links to managers at other SOEs that served for this type of “horizontal” exchange in the socialist period. The state is also likely to tolerate such behavior, when it is advantageous for “their” firms to do this. Thus, the much higher levels of FDI in Hungary and the Czech Republic and corresponding lower levels of large SOEs probably overwhelm the impact of Shock Therapy on these indicators by 1999.
The only other indicator in the Central European group which seems surprising is the very high level of erosion of the human capital base in Slovenia and Slovakia
compared with Hungary and Poland, as measured in the change in the number of scientists and engineers in R. & D. In Slovakia’s case, sectoral effects are probably at work. The split with the Czech Republic left Slovakia with most of the military industrial complex, a sector whose market (Soviet and Czechoslovak military purchases) all but disappeared. Political commitments prohibited finding alternative markets for these weapons. Thus, much of Slovakia’s R. & D. capacity would necessarily be eliminated, with daunting chances for real civilian conversion.
Another factor at work, quite possibly in Slovenia, is that this indicator also indicates brain drain -- the migration of those with scientific training to Western Europe. Bulgaria, the overall outlier on this indicator (-71%), is probably catching the
exceptionally large brain drain that occurred from that country (more than 10% of Bulgaria’s population, and a higher proportion of the educated workforce, emigrated [Stiglitz 2002: 154]). Slovenia, given its proximity to Western Europe and the rise of trade with Europe in the late 1960s, had a long-established practice of “labor contracting” in the West. Once real labor markets were established, and technical personnel were free to work anywhere they wanted, it would not be surprising if many found employment right next door in Italy or Austria.
Overall, there is not a very tight fit between pursuing Shock Therapy policies and these indicators of enterprise restructuring, for all of the reasons stated above. This is not really surprising. Things like barter arrangements, and especially inter-enterprise arrears, in the Central European context, for example, might not be terribly inefficient and
“non-rational” given the more substantial state capacity in the region. By the late 1990s, these practices could simply be functional replacements for things like inter-firm trade credits in the West (Shaffer 2000).
There are only a couple of outliers remaining. Vietnam’s higher change in capital formation compared with China’s is explained by Vietnam’s lower starting point at the beginning of its reforms in the late 1980s, about a decade later than China’s first major reforms. Export-led takeoff in a very poor agricultural society means that increases in investment will be proportionally higher, even though overall investment is less.
The final outlier in the table is the change in final government consumption in Bulgaria compared with Romania. This apparent anomaly isn’t such a problem. First, the difference between Bulgaria and Romania in terms of neoliberalism is fairly small, despite Romania’s being coded as implementing a mass privatization program. Romania had the smallest program coded as “mass privatization” -- covering around 25% of SOEs. Thus, differences between these indicators in these two countries might reflect other factors relatively more than in the other comparisons. Second, Romania pursued policies that were much less monetarist, when measured in annual increases in broad money (Romania increased M2 -- money plus credit -- significantly more than Bulgaria did in all but one of the years that the World Bank recorded this data [World Bank 2002]). To the extent that this spending funded government consumption (i.e., Romania reaped an inflation tax), this accounts for the difference.
Despite a lot of noise in the tables, the relationship of Shock Therapy to measures of growth, human welfare, and state capacity have a much tighter fit with sociological
theory than with neoliberal theory (as seen in Tables 4 and 5). On these comparisons, its superiority to neoliberal theory is established.
Conclusion
The market was not an adequate substitute for a developmental state, and therefore the insertion of the postcommunist states into the global capitalist economy resulted in de-industrialization, de-modernization, and widespread impoverishment. As Sachs suggested, markets do spring up as soon as state bureaucrats vacate the field, only they spring up in low-tech small and medium-sized businesses with some type of “natural protection” (e.g., the high cost of shipping furniture means that there is a furniture
industry in virtually every country). This produces a capitalist economy dominated by a few politically connected financial-industrial groups centered on the exploitation of raw materials; a relatively small, poorly paying, and non-dynamic small and medium-sized enterprise sector; and a huge base of “kiosk” capitalism and various types of petty-trading and self-provision strategies. This is nothing less than a “great leap backward” moving most of the postcommunist world closer to the Third World than to Europe. Only those countries that violated neoliberal precepts or were able to re-industrialize on the basis of very large flows of FDI avoided this fate. This finding presents a very large paradox for the neoliberals. They believe that Shock Therapy will allow the free market to create a liberal capitalist society. Rather, the application of the neoliberal transition program results in a less liberal outcome.
We can see this when comparing Poland and Russia. According to the EBRD, on a scale of 1 to 10, with 10 being the most liberal, Russia is a 2 and Poland an 8 (2000: 21). And few analysts would disagree that Poland’s economy is far closer to the “liberal
capitalist” societies found in Western Europe. Many analysts take this to mean that Poland has been far more faithful to neoliberal policy advice than Russia has. However, the fact that Poland is more “liberal” than Russia in 1999 is not the same thing as saying that neoliberal strategies work better than statist and gradualist ones. As measured by the speed of liberalization, the severity of stabilization, and the extent of rapid large-scale privatization of SOEs via mass privatization, Russia was far more neoliberal than Poland, at least up through the mid-1990s. By 1994, all three major reforms were implemented in Russia, and Poland was acknowledged to be more of a protectionist, a less stringent monetarist, and a much slower privatizer than Russian (see Appendix 1; see also Murell 1993; Stiglitz 2002: 181-2; see also comments to this effect by Sachs and Lipton 1992 and Aslund 1995).
Thus, neoliberal policies, when really implemented, have the opposite effect than what was intended. We can see this in many areas. A clear example is in monetary policy. Neoliberals want tight money and high interest rates in order to limit the amount of money circulating, and thereby to control inflation. However, in Russia, these
monetarist policies contributed to financial crises for firms, with the response being the rise of barter and inter-enterprise arrears and the production of local monies. This in turn induced the federal government to print more money, in order to try to “re-nationalize” the economy (Woodruff 1999). Time-series data shows that increases in inter-enterprise debt correlate with an increase in tax non-remittance, as well as with an increase in the supply of broad money (Bernstam and Rabushka 2002: 6). Therefore, to the extent that Shock Therapy damages firms, this damages state revenues, forcing the state to print money to cover the deficit, thereby inducing inflation. In other words, enterprise failure
in Russia produces a stream of events that produces the opposite monetary effect than the neoliberals intended. Thus, extreme neoliberal transition programs are likely to create havoc, causing changes in the state and the economy which are distinctively nonliberal.
In retrospect, we can see that Sachs, perhaps the most visible intellectual leader of the neoliberal vanguard, had got it half right back in the early 1990s: “At the base of all of this transformation [is] … the idea … that the postcommunist world has the potential to grow more rapidly than the develop[ed]13 world and thereby to narrow the gap in living standards, if they harmonize institutions and join their economies to the global economic system” (Sachs 1994: 25. Emphasis in original). Unlike some formulations that equate globalization with neocolonial exploitation in the tradition of world systems analysis (Chussodovsky 1997; Gowan 1999; Ander and Summers 1998), the sociological analysis I offer suggests that postcommunist economies should “join their economies to the global system.” The ability of Central European states to attract foreign investment and to export manufactured goods to Western Europe has allowed them to avoid the fate of the FSU and Eastern Europe. The disagreement with the neoliberals from the
neoclassical sociological position sketched here is that, “if they harmonize institutions” along the lines laid out by the IMF and the World Bank, they initiate their own modernization, making sure that they join the global economy not as equals but as de-industrialized and substantially poorer economies with less effective states.
While this analysis has emphasized Shock Therapy’s developmental pathologies, we must also acknowledge that the postcommunist countries needed economic reforms. State socialism was in a long-term economic crisis, even if the actual breakdown of communist regimes is best understood as a legitimacy crisis (Szelenyi and Szelenyi