APPLICATION OF SLIDING MODE
TECHNOLOGY IN PV MAXIMUM POWER
POINT TRACKING SYSTEM
A THESIS IN PARTIAL FULFILMENTS OF REQUIREMENTS
FOR THE AWARD OF THE DEGREE OF
Bachelor of Technology
BY
BISWAJIT SETHY
109EE0460
Under the supervision of
PROF. SOMNATH MAITY
DEPARTMENT OF ELECTRICAL ENGINEERING
NATIONAL INSTITUTE OF TECHNOLOGY
ROURKELA – 769008
DEPARTMENT OF ELECTRICAL ENGINEERING NATIONAL INSTITUTE OF TECHNOLOGY, ROURKELA- 769 008 ODISHA, INDIA
CERTIFICATE
This is to certify that the draft report/thesis titled “Application of sliding mode technology in pv maximum power point tracking system”, submitted to the National Institute of Technology, Rourkela by Mr.Biswajit Sethy, Roll No: 109EE0460 for the award of Bachelor of Technology in Electrical Engineering, is a bonafide record of research work carried out by him under my supervision and guidance.
The candidate has fulfilled all the prescribed requirements.
The thesis which is based on candidate’s own work, has not submitted elsewhere for a degree/diploma.
In my opinion, the thesis is of standard required for the award of a Bachelor of Technology in Electrical Engineering.
Prof. Somnath Maity
Supervisor Department of Electrical Engineering National Institute of Technology Rourkela – 769 008 (ODISHA)ACKNOWLEDGEMENT
I would like to express my deepest of gratitude to my supervisor Prof. SOMNATH MAITY, Department of Electrical Engineering, N.I.T Rourkela, for his support and motivation during the course of my work since last one year. I truly appreciate his educative inputs,concern and assistance for the above project assigned by him.
I would like to extend my sincere thanks to my friends and colleagues.
Last but not least, we would like to thank the staff of Electrical engineering department for constant support and providing place to work during project period.
Date:
Place: BISWAJIT SETHY (109EE0460)
Department of Electrical Engineering National Institute of Technology Rourkela - 769008
CONTENTS
Certificate……….. i Acknowledgement ………... ii Contents………... iv List of Tables………... vi List of figures……… viAbbreviations and Acronyms……… vii
ABSTRACT... 1 CHAPTER 1: INTRODUCTION 1.1Motivation………... 2 1.2Historical Development………... 2 1.3 Application………. 3 1.4 Work Summary………... 3
CHAPTER 2: BACKGROUND AND LITERATURE REVIEW 2.1 Background………. 4
2.2 Literature Review………... ... 4
CHAPTER 3: PHOTOVOLTAIC SYSTEM 3.1 Definition……….. 5 3.2 Photovoltaic Arrangement………... 5 a. Photovoltaic Cell………. 5 b. Photovoltaic Module………... 6 c. Photovoltaic Array………... 6 3.3 Characteristicof PV cell……….... 7 3.4 Efficiency of PV cell ………. 8 3.5 Modeling of PV Array………... 9
iv
3.5.3 Simulation Model of PV array……….. ... 12
CHAPTER 4: CONVERTERS 4.1 DC-DC Converter……….... … 13
4.1.1 Buck Converter………. … 13
4.1.2 Inductor and Capacitor Design………. … 16
CHAPTER 5: SLIDING TECHNOLOGY 5.1 Mppt Modeling System……… 18
5.2 The Controller Design……….. 19
CHAPTER 6: TABLES AND RESULTS 6.1 Parameters used in Matlab code……….. 21
6.2 Matlab code for PV array……… 22
6.2.1 Results……… 24
6.3 Sliding mode control system simulation and results………... 27
CHAPTER 7: CONCLUSION………. … 29
REFERENCES……….. 30
LIST OF TABLES
TABLE NO TITLE PAGE NO
1 Parameters value used in MATLAB code 21
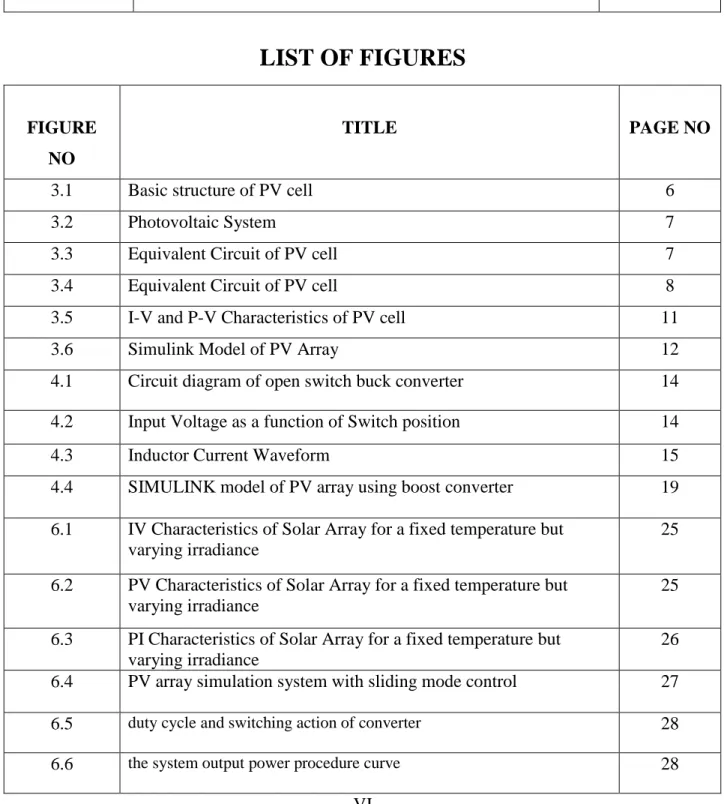
LIST OF FIGURES
FIGURE NO
TITLE PAGE NO
3.1 Basic structure of PV cell 6
3.2 Photovoltaic System 7
3.3 Equivalent Circuit of PV cell 7
3.4 Equivalent Circuit of PV cell 8
3.5 I-V and P-V Characteristics of PV cell 11
3.6 Simulink Model of PV Array 12
4.1 Circuit diagram of open switch buck converter 14
4.2 Input Voltage as a function of Switch position 14
4.3 Inductor Current Waveform 15
4.4 SIMULINK model of PV array using boost converter 19
6.1 IV Characteristics of Solar Array for a fixed temperature but varying irradiance
25
6.2 PV Characteristics of Solar Array for a fixed temperature but varying irradiance
25
6.3 PI Characteristics of Solar Array for a fixed temperature but varying irradiance
26
6.4 PV array simulation system with sliding mode control 27
6.5 duty cycle and switching action of converter 28
6.6 the system output power procedure curve 28
ABBREVIATIONS AND ACRONYMS
PV - Photo Voltaic
DC - Direct Current
MPPT - Maximum Power Point Tracking
VSS - Variable Structure System
CDM - Clean Development Mechanism
BJT - Bipolar Junction Transistor
MOSFET - Metal Oxide Semiconductor Field Effect Transistor IGBT - Insulated Gate Bipolar Transistor
PWM - Pulse Width Modulation
MATLAB - MATrix LABoratory
ABSTRACT
The recent upsurge in the demand of PV systems is due to the fact that they produce electric power without hampering the environment by directly converting the solar radiation into electric power. However the solar radiation never remains constant. It keeps on varying throughout the day. The need of the hour is to deliver a constant voltage to the stand-alone system of the variation in temperatures and solar insolation.Here we intend to examine a schematic to draw out maximum obtainable solar power from a PV module for use in a DC application. The concept of Maximum Power Point Tracking is to be implemented which results in appreciable increase in the efficiency of the Photovoltaic System. In this paper, a new MPPT has been developed consisting of a Buck-type dc-dc converter, which is controlled by a micro-controller based unit. Based on the non-linear characteristics of PV, these thesis designs a VSS controller to realize the maximum power output of PV arrays. Comparing to the other techniques used in the past, the use of proposed MPPT control improves the PV system performance.
C
HAPTER
-
1
:
INTRODUCTION 1.1MOTIVATIONThe energy which is harvested from the natural resources like sunlight, wind, tides, geothermal heat etc. is called Renewable Energy. As these resources can be naturally replenished, for all practical purposes, these can be considered to be limitless unlike the tapering conventional fossil fuels. The global energy crunch has provided a renewed impulsion to the growth and development of Clean and Renewable Energy sources. Clean Development Mechanisms (CDMs) are being adopted by organizations all across the globe. It also helps in significant reduction in pollution level.
The solar energy has been a promising alternative against rising cost of conventional energy. They are abundant, pollution free, distributed throughout the earth and recyclable. PV arrays consist of parallel and series combination of PV cells that are used to generate electrical power depending upon the atmospheric specifies (e.g. solar insolation and temperature). 1.2HISTORICAL DEVELOPMENT:
Photovoltaic technology in reality goes back over 160 years. The basic science was first came upon in 1839 but the pace of advancement really hastened in two major drives in the 20thcentury.Bell Laboratories, discovered silicon had photoelectric attributes and quickly developed Si solar cells, achieving 6% efficiency and former satellites were the elemental use for these first solar11cells. To spur acceptance, Germany and then Japan initiated appreciable
subsidy programs and now those markets exist largely without grants. In 2007, California leads the US with a similar10-year program.
1.3APPLICATION :
Solar technologies are broadly qualified as either passive or active depending on the way they catch, change over and distribute sunlight. Active solar proficiencies use photovoltaic arrays,pumps, and fans to convert sunlight into executable outputs.. The standalone PV Systems have been used for solar street lighting, home lighting system,SPV water pumping system. A hybrid system installed with a backup system of diesel generator can be used in remote military installations, health centers and tourist bungalows. In grid connected system the major part of the load during the day is supplied by the PV array and then from the grid when the sunlight is not sufficient.
1.4WORK SUMMARY :
Different forms of renewable energies have been discussed along with the most important one,the solar energy. The concepts of a PV cell and its characteristics have been studied and obtainedthrough its characteristic equation. Buck converter has been studied under both open loop andclosed loop conditions. The P-V, I-V, P-I curves have been obtained at varying irradiation levelsand temperatures. An MPPT model has beendesigned to extract maximum power from the photovoltaic array with the application of slide technology.
C
HAPTER
-
2
:
BACKGROUND AND LITERATURE REVIEWA
.
BACKGROUND:In the PV generating system, the research of power converter has become an important content. In order toimprove the PV array efficiency and short the recycle of the system cost, it is the fundamental function and requirement of the PV power control circuit to make the PV array output maximum power under any circumstance.
In recent years, the research of the PV MPPT control methods has been paid extensive attention by many specialistsand obtained some fruits such as: comparison and fuzzy control etc. Because the output energy of the PV arrays changes frequently by the surroundings, improving the speed of tracking the PV power system could obviously improve the system performance. In this paper, the slide variable structure technology is adopted to realize the maximum power output ofthe PV arrays, and the results of simulation and experiment are presented.
B. LITERATURE REVIEW
:
A maximum power point tracking algorithm is absolutely necessary to increase the efficiency ofthe solar panel as it has been found that only 30-40% of energy incident is converted intoelectrical energy. A number of methods have been used to obtain the MPPT. But Sliding mode control is a kind of non-linear control which is robust in the presence of parameter uncertaintiesand disturbance.It is able to constrain the system statusto follow trajectories which lie on a suitable surface in the sliding surface. Therefore, the design of the sliding mode controller starts with the design of the sliding surface. In this case, the surface sliding can bedesigned with the error of the inductor current and the integral output error was added to achieve zero steady stateerror in the buck converter.
C
HAPTER
-
3:
PHOTOVOLTAIC SYSTEMS 3.1DEFINITION:A photovoltaic system is a system which uses one or more solar panels to convert solar energy into electricity. It consists of multiple components, including the photovoltaic modules, mechanical and electrical connections and mountings and means of regulating and/or modifying the electrical output.[11]
3.2 PHOTOVOLTAIC ARRANGEMENTS: (a) PHOTOVOLTAIC CELL
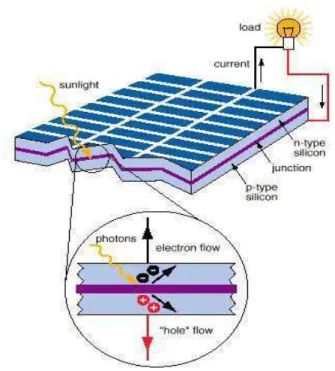
PV cells are made of semiconductor materials, such as silicon. For solar cells, a thin semiconductor wafer is specially treated to form an electric field, positive on one side and negative on the other. When light energy strikes the solar cell, electrons are knocked loose from the atoms in the semiconductor material. If electrical conductors are attached to the positive and negative sides, forming an electrical circuit, the electrons can be captured in the form of an electric current - that is, electricity. This electricity can then be used to power a load. A PV cell can either be circular or square in construction.
Figure 3.1 Basic Structure of PV Cell
(b) PHOTOVOLTAIC MODULE
Due to the low voltage generated in a PV cell (around 0.5V), several PV cells are connected in series (for high voltage) and in parallel (for high current) to form a PV module for desired output. Separate diodes may be needed to avoid reverse currents, in case of partial or total shading, and at night. The p-n junctions of mono-crystalline silicon cells may have adequate reverse current characteristics and these are not necessary. Reverse currents waste power and can also lead to overheating of shaded cells. Solar cells become less efficient at higher temperatures and installers try to provide good ventilation behind solar panels.[12]
(c) PHOTOVOLTAIC ARRAY
The power that one module can produce is not sufficient to meet the requirements of home or business. Most PV arrays use an inverter to convert the DC power into alternating
current that can power the motors, loads, lights etc. The modules in a PV array are usually firstconnected in series to obtain the desired voltages; the individual modules are then connected in parallel to allow the system to produce more current.[11]
Figure 3.2 Photovoltaic system [13]
3.3 CHARACTERISTICS OF PV CELL
Figure 3.3 Equivalent circuit of a PV cell
An ideal is modeled by a current source in parallel with a diode. However no solar cell is ideal and thereby shunt and series resistances are added to the model as shown in the PV cell diagram above. is the intrinsic series resistance whose value is very small. is the equivalent shunt resistance which has a very high value.
Applying Kirchoff’s law to the node where Iph, diode, and. meet, we get
(3.1)
We get the following equation for the photovoltaic current
(3.2)
[ ( ) ] ( ) (3.3)
Where, is the Insolation current, I is the Cell current, is the Reverse saturation current, V is the Cell voltage, Rs is the Series resistance, Rp is the Parallel resistance, is the Thermal voltage (KT/q) K is the Boltzman constant, T is the Temperature in Kelvin, q is the Charge of an electron.
3.4 EFFICIENCY OF PV CELL
The efficiency of a PV cell is defined as the ratio of peak power to input solar power.
( ) (3.4)
where, is the voltage at peak power, is the current at peak power, I is the solar intensity per square meter, A is the area on which solar radiation fall.
The efficiency will be maximum if we track the maximum power from the PV system at different environmental condition such as solar irradiance and temperature by using different methods for maximum power point tracking.
3.5 MODELLING OF PV ARRAY
The building block of PV arrays is the solar cell, which is basically a p-n junction that directly converts light energy into electricity: it has a equivalent circuit as shown below in Figure 3.4.
Figure 3.4 Equivalent circuit of a PV cell
The current source represents the cell photo current; is used to represent the non-linear impedance of the p-n junction; and are used to represent the intrinsic series and shunt resistance of the cell respectively. Usually the value of is very large and that of is very small, hence they may be neglected to simplify the analysis. PV cells are grouped in larger units called PV modules which are further interconnected in series-parallel configuration to form PV arrays or PV generators.The PV mathematical model used to simplify our PV array is represented by the equation:
[ ( ) ] (3.5)
where I is the PV array output current; V is the PV array output voltage; ns is the number of cells in series and np is the number of cells in parallel; q is the charge of an electron; k is the Boltzmann’s constant; A is the p-n junction ideality factor; T is the cell temperature (K); Irs is the cell reverse saturation current. The factor A in equation (3.5) determines the cell deviation from the ideal p-n junction characteristics; it ranges between 1-5 but for our case A=2.46.
The cell reverse saturation current varies with temperature according to the following equation
[ ] ( [ ]) (3.6)
Where is the cell reference temperature, is the cell reverse saturation temperature at and is the band gap of the semiconductor used in the cell.
The temperature dependence of the energy gap of the semiconductor is given by :
(3.7)
The photo current depends on the solar radiation and cell temperature as follows:
(3.8)
Where is the cell short-circuit current at reference temperature and radiation, is the short circuit current temperature coefficient, and S is the solar radiation in W/ .
The PV power can be calculated using equation (3.5) as follows:
[( ) ] (3.9)
3.5.1 PV ARRAY CHARACTERISTIC CURVES
The current to voltage characteristic of a solar array is non-linear, which makes it difficult to determine the MPP. The Figure below gives the characteristic I-V and P-V curve for fixed level of solar irradiation and temperature.
Figure 3.5 I-V and PV curve characteristics.
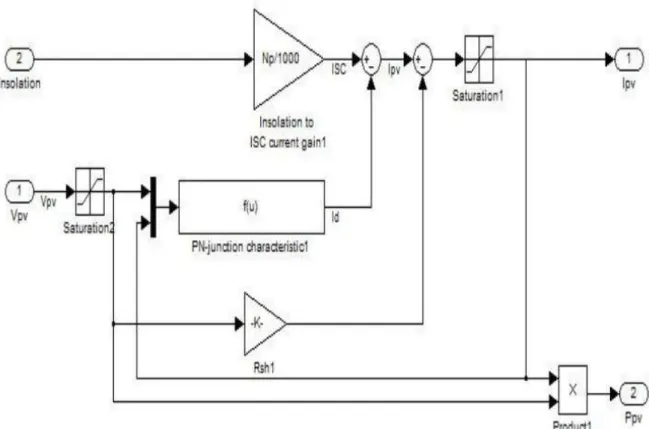
3.5.3 SIMULINK MODEL OF PV ARRAY
Fig 3.6: SIMULINK model of photovoltaic array
C
HAPTER
-
4: CONVERTERS
4.1 DC-DCCONVERTERSDC-DC converters can be used as switching mode regulators to convert an unregulated dc voltage to a regulated dc output voltage. The regulation is normally achieved by PWM at a fixed frequency and the switching device is generally BJT, MOSFET or IGBT. The minimum oscillator frequency should be about 100 times longer than the transistor switching time to maximize efficiency. This limitation is due to the switching loss in the transistor. The transistor switching loss increases with the switching frequency and thereby, the efficiency decreases. The core loss of the inductors limits the high frequency operation. Control voltage is obtained by comparing the output voltage with its desired value. Then the output voltage can be compared with its desired value to obtain the control voltage . The PWM control signal for the dc converter is generated by comparing with a saw tooth voltage .[8]. There are four
topologies for the switching regulators: buck converter, boost converter, buck-boost converter, cứk converter. However my project work deals with the buck regulator and further discussions will be concentrated towards this one.
4.1.1 BUCK CONVERTER
A buck converter falls in to the category of switch-mode DC-DC converters. These switch-mode DC-DC converters convert one DC voltage level to another level by temporarily storing the input energy and then releasing that energy to the output at a different voltage level. The preferred storage element can be either a magnetic field storage component (inductors) or electric field storage components (capacitors). This conversion methodology has greater power efficiency (often 75 to 98 percent) than linear voltage regulation (which dissipates unwanted power as
heat). A buck-converter produces a lower average output voltage than the DC input voltage Regulated DC power supplies and DC motor speed controls are the main applications.
Figure 4.1 circuit diagram of open switch Buck converter
∫ (∫ ∫
)
(4.1)
When an ideal condition is assumed i.e. an ideal switch, a constant input voltage and a pure resistive load, then the instantaneous voltage waveform is shown in figure 4.2 as a function of the switch of position. Generally the average output voltage is expressed in terms of the switch duty ratio.
Fig.4.2 – Input Voltage as a function of Switch position 14
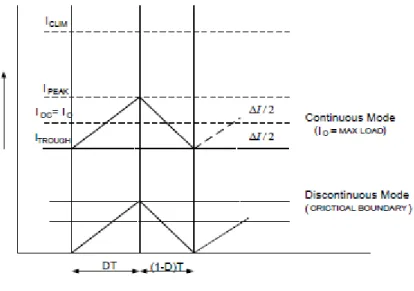
It is noted that the diode enters the reverse biased mode during the interval when the switch is ON and the input provides energy to the load as well as to the inductor. During the interval when the switch is OFF, the diode carries the inductor current flowing in the circuit and transfers some of stored energy of the inductor to the load. Under the ideal conditions the filter capacitor at the output is assumed to be very large. This is the common consideration in applications requiring a constant or nearly constant instantaneous output voltage ≅ Figure4.3 shows the average inductor current in the buck-converter which is equal to the average output current, the main reason behind this being the average capacitor current in the steady-state is zero.
Fig. 4.3 – Inductor Current waveform
4.1.2 INDUCTOR AND CAPACITOR DESIGN
Inductor voltage current relation is given by . During time interval, the change in the inductor current Δ𝑖𝐿 and voltage across the inductor is . Hence, we have
𝑖 (5.2)
(5.3)
which yields a current ripple of
(5.4) The charge carrying capacity of the capacitor must be (refer fig. 4.3)
(5.5)
(5.6) So, the value of ripple voltage is given by
(5.7)
By fixing the average load current, source voltage, average load voltage, voltage and current ripple, the critical minimum values of the inductor and capacitor can be found out using eq. (4.3) and eq. (4.7). In all our analysis, we assume that the converter operates in the continuous current conduction mode. The inductor designed has EI core with 80 turns.
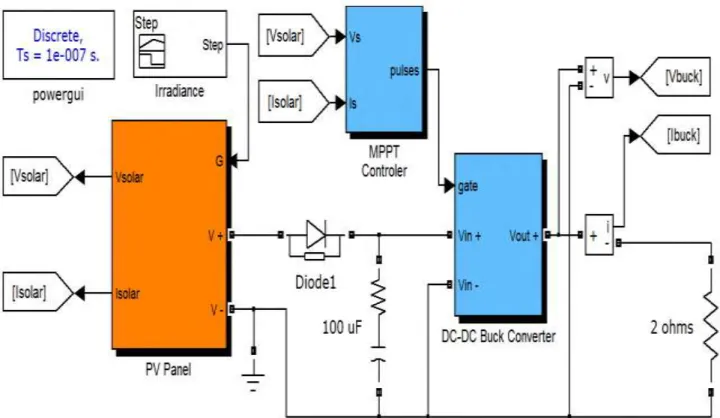
Figure 4.4 SIMULINK model of PV array using buck converter
CHAPTER 5 : THE SLIDING MODE TECHNOLOGY 5.1 MPPT SYSTEM MODELLING:
The system can be written in two sets of state equation depending on the switch position S. If the switch position S=0,the differential equation can be written as
𝑖 (6.1)
(6.2)
the differential equation if switch is in position S=1
𝑖
(6.3)
(6.4)
By using state space averaging method eq (6.1) (6.2) and eqn (6.3) (6.4) can be combined into one set of state eqn to represent the dynamic of the system.
Base on the idea of PWM, the ratio of the switch in position in a period is defined as duty ratio. The distinct eqn. sets are weighted by the duty ratio and superimposed
̇ ̇ ̇ (6.5)
Where ̇ [ ̇ ̇ ] ̇ [ ̇ ̇ ] is the duty ratio
Hence the dynamic equation of the system can be described by
𝑖 (6.6) (6.7) (6.8) 18
̇ [𝑖 ] [ 𝑖 𝐿 𝑖 𝑖 ] [ 𝑖 𝐿 𝑖 ]
The system of equation can be written in general form of the non-linear time system as
̇ (6.9)
5.2 THE CONTROLLER DESIGN : PV array output power =
Based on the solar array characteristic curve shown in fig1 when the solar array is operating in its maximum output power state, we can get
(6.10) i.e [( ) ( ) 𝑖 ] 𝑖 (6.11)
From eqn (6.11) the switch function can be selected as
𝑖 (6.12)
Based on the two states of the PV array in fig shown below and the system circuit diagram,the switch control can be selected as
{ (6.13) Let ̇ ̇ (6.14) 19
Among them 𝐿 ( 𝜕 ) (6.15) 𝐿 ( 𝜕 ) (6.16) by using equation (6.15) (6.16) in equation (6.14)
(6.17)
Using equation (6.17) in equation (6.6) (6.7) (6.8)
𝑖 𝐿 𝑖 𝐿𝑖 ( ) ( ) (6.18) For the system shown in eqn 9 and switch function 12 ,if the expression (13) is adopted, they could make the system eventually stabilize at the status that the switch function is equal to zero from any initial state.
Testify : let Lyapunov function
V=1/2 ( ) ̇
Substituting eqnof 𝑖 into eqn (12) 𝑖 ⌊ ( ) ⌋ = ⌊ ( ) ⌋ = ( ) [ ( )] (6.19) 20
1)When S>0
Based on eqn(6.12) (6.13)the system is operating in state 1,the switch function u=0 and is
increasing (6.20) [ ( )] ( ) [ ( )] (6.21)
Taking eqn (6.21) in to (6.20) ,then <0, i.e
2) when S< 0
The system is operating in state 2,switch function u=1,and is decreasing,namely
(6.22)
Substituting, eqn (6.22) into (6.21),then
Obviously, the system could reach global stability and the switch function is trend to zero whether function is trend to zero whether the system is operating is operating in state 1 or in in state 2.
C
HAPTER
-
6
:TABLES AND EXPERIMENTAL RESULTS 6.1 PARAMETERS USED IN THE MATLAB CODEPARAMETER
VALUES 4 60 3.75 A 0C 0.00023 A/K 0.000021 A K 1.38065*10-23 J/0K Q 1.6022*10-19 C A 2.15 0 1.66 eV Α 4.73*10-4 eV/K Β 636 K 100 𝑖 0 𝐿 226.2 MATLABCODE FOR PV ARRAY T=28+273;
Tr1=40; % Reference temperature in degree Fahrenheit Tr=((Tr1-32)* (5/3))+273; % Reference temperature in kelvin S=[100 80 60 40 20]; % Solar radiation in mW/sq.cm
%S=70;
ki=0.00023; % in A/K
Iscr=3.75; % SC Current at ref. temp. in A Irr=0.000021; % in A k=1.38065*10^(-23); % Boltzmann constant q=1.6022*10^(-19); % charge of an electron A=2.15; Eg(1)=1.166; alpha=0.473; beta=636;
Eg=Eg(1)-(alpha*T*T)/(T+beta)*q; % band gap energy of semiconductor used cell in joules Np=4; Ns=60; V0=[0:1:300]; c={'blue','red','yellow','green','black'}; fori=1:5 Iph=(Iscr+ki*(T-Tr))*((S(i))/100); 23
Irs=Irr*((T/Tr)^3)*exp(q*Eg/(k*A)*((1/Tr)-(1/T))); I0=Np*Iph-Np*Irs*(exp(q/(k*T*A)*V0./Ns)-1); P0 = V0.*I0; figure(1) plot(V0,I0,c{i}); hleg = legend('100 w/m^2','80 W/m^2','60 W/m^2','40 W/m^2','20 W/m^2'); axis([0 50 0 20]); xlabel('Voltage in volt'); ylabel('Current in amp'); hold on; figure(2) plot(V0,P0,c{i}); hleg = legend('100 w/m^2','80 W/m^2','60 W/m^2','40 W/m^2','20 W/m^2'); axis([0 50 0 400]); xlabel('Voltage in volt'); ylabel('Power in watt'); hold on; figure(3) plot(I0,P0,c{i}); hleg = legend('100 w/m^2','80 W/m^2','60 W/m^2','40 W/m^2','20 W/m^2'); axis([0 20 0 400]); 24
6.2.1 RESULTS
OUTPUT CHARACTERISTICS
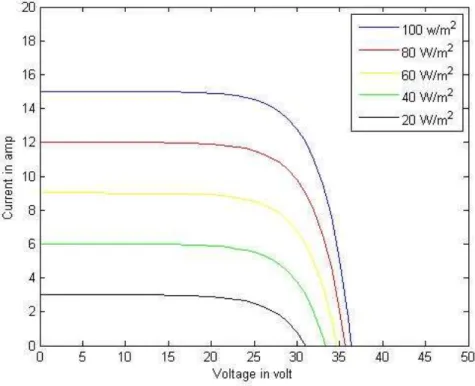
Figure.6.1I-V characteristic of a solar array for a fixed temperature but varying irradiance
Figure 6.2 P-V characteristic of a solar array for a fixed temperature but varying irradiance 25
Figure 6.3 P-I characteristic of a solar array for a fixed temperature but varying irradiance
From the I-V, we observe that the short circuit current increases with increase in irradiance at a fixed temperature. Moreover, from the I-V and P-V curves at a fixed irradiance, it is observed that the open circuit voltage decreases with increase in temperature.The characteristic I-V curve tells that there are two regions in the curve: one is the current source region and another is the voltage source region. In the voltage source region (in the right side of the curve), the internal impedance is low and in the current source region (in the left side of the curve),the impedance is high. An important part is played by irradiance temperature for predicting I-V characteristics and for designing PV system effects of both factors have to be considered. Whereas the irradiance affects the output, temperature mainly affects the terminal voltage.
6.3 SLIDING MODE CONTROL SYSTEM SIMULATION AND RESULTS
Fig.6.4 PV array simulation system with sliding mode control
Fig.6.5 duty cycle and switching action of converter 27 0.3465 0.347 0.3475 0.348 0.3485 Time (s) 3.755 3.76 3.765 -1*Vload
Fig 6.6 the system output power procedure curve
A numerical simulation was created to verify the performance of the proposed SMC-based MPPT. The simulation is based on the equations governing the electrical dynamics of the buck converter given in equations (6.6) - (6.8) The parameters used in the simulation environment are summarized in Table above shown. The results of the simulation are summarized in Figures 6.4-6.6. Figure 6.6 shows the PV array voltage response of the closed loop system . The results in Figure 6.6 show that (t) quickly converges to the MPOP in the presence of the sudden temperature fluctuations. 28 0 0.2 0.4 0.6 0.8 1 Time (s) 0 -1 1 2 3 4 5 Iload*-1*Vload
C
HAPTER
-
7:
CONCLUSIONThe open circuit P-V, P-I, I-V curves we obtained from the simulation of the PV array designed in MATLAB environment explains in detail its dependence on the irradiation levels and temperatures. The entire energy conversion system has been designed in MATLB-SIMULINK environment. The various values of the voltage and current obtained have been plotted in the open circuit I-V curves of the PV array at insolation levels of 100 mW/m2 and 80 mW/m2. Then the sliding-mode observer for the estimation of solar array current in the PV system has been proposed. The sliding-mode observer is constructed from the state equation of the system, and the convergence of the error system is proved using equivalent control concept. A switched system model was introduced to design maximum peak power tracking controller for PV cells
based on the sliding mode control approach, where
is used as the sliding function. The
speed of the MPPT can be increased with the U increasing, but the PV output Power and terminal voltage fluctuates heavily. It is robust to operation conditions and PV cell parameter changes. A rigorous Lyapunov-based analysis is provided to prove asymptotic tracking of a time-varying MPOP, and numerical simulation results are provided to demonstrate the performance of the proposed MPPT.
REFERENCES
[1] I.H Atlas, A.M Sharaf, "A photovoltaic Array Simulation Model for Matlab-Simulink GUI Environment”, Proce. of IEEE International Conference on Clean Electrical Power, ICCEP 2007, Capri, Italy
[2] Jesus Leyva-Ramos, Member, IEEE, and Jorge Alberto Morales-Saldana," A design criteria for the current gain in Current Programmed Regulators", IEEE Transactions on industrial electronics, Vol. 45, No. 4, August 1998.
[3] K.H. Hussein, I. Muta, T. Hoshino, M. Osakada, "Maximum photovoltaic power tracking: an algorithm for rapidly changing atmospheric conditions", IEE Proc.-Gener. Trans. Distrib., Vol. 142,No. 1, January 1995.
[4] Yang Zhixun “DC/DC Converter Sliding Mode Control” Electro technology Journal No-2,JANUARY 2000,PP13-15
[5] Yeong-Chau Kuo, et al. "Novel Maximum-Power-Point-Tracking Controller for
Photovoltaic Energy Conversion System." IEEE TRANSACTIONS ON INDUSTRlAL ELECTRONICS, VOL. 48, NO. 3, JUNE 2001. PP.594-601
[6] W. Xiao, W. G. Dunford, and A. Capel, “A novel modeling method for photovoltaic cells”, in Proc. IEEE 35th Annu. Power Electron. Spec. Conf. (PESC), 2004, vol. 3, pp. 1950–1956.
[7] Hu Yaoming. "Nonlinear Control Systems Theory and Application." National Defence Industry Press. Peking, January 2002.
[8] Hidehiko Sugimoto, et al., "A new scheme far maximum photovoltaic power tracking control." Proceedings of Power Conversion Conference, V01.2, pp.69 1-696, Nagaaka, 1997.
[9] Lin Shan etc. "Tracking and Contml of Maximum Power Point or Photovoltaic system." New Energy Source. 1999, Vo1.21 No.2 P2.5-21.
[10]IEEE Standard Definitions of Terms for Solar Cells, 1969
[11] http://en.wikipedia.org/wiki/Photovoltaic_system
[12] http://en.wikipedia.org/wiki/Solar_panel
[13] http://www.blueplanet-energy.com/images/solar/PV-cell-module-array.gif/
[14] OlivaMah NSPRI, "Fundamentals of Photovoltaic Materials", National Solar power institute, Inc. 12/21/98
[15] Muhammad H. Rashid, “Power Electronics Circuits, Devices and Applications”, Third Edition
[16] Nielsen, R. 2005, 'Solar Radiation', http://home.iprimus.com.au/nielsens/
.
![Figure 3.2 Photovoltaic system [13]](https://thumb-us.123doks.com/thumbv2/123dok_us/1440591.2692928/15.918.228.683.184.926/figure-photovoltaic-system.webp)