Assessing the Level of Traffic Congestion at major intersections in
Addis Ababa
(A case for East-West corridor: Lem-Hotel & Urael Junction)
By
ANDUALEM DEYU
A Project Paper Submitted in Partial Fulfillment of the Requirements for the Degree of
Masters in Road and Transport Engineering (MEng)
Assessing the Level of Traffic Congestion at major intersections in
Addis Ababa
(A case for East-West corridor: Lem-Hotel & Urael Junction)
By
ANDUALEM DEYU
Advisor:
DR. MELAKU SISAY
A Project Paper Submitted in Partial Fulfillment of the Requirements for the
D
egree
of
Masters in Road and Transport Engineering (MEng)
i
DEPARTMENT OF CIVIL AND ENVIRONMENTAL
MASTER’S PROJECT PAPER
ASSESSING THE LEVEL OF TRAFFIC CONGESTION AT
MAJOR INTERSECTIONS IN ADDIS ABABA
(A CASE FOR LEM-HOTEL AND URAEL INTERSECTIONS)
By
ANDUALEM DEYU
Board Examiners
Dr. Melaku Sisay
______________
__________________
Advisor
Signature
Date
Dr Avinash M. Potdar
______________
__________________
Examiner
Signature
Date
___________________
______________
__________________
PG program coordinator
Signature
Date
ii
ACKNOWLEDGMENT
I would like to express my deep gratitude to Dr. Melaku Sisay, the advisor of my project, for all his advice and patience on difficult times. Special thanks for Addis Ababa City Road Authority traffic safety department, Urban Development and also Yeka and Kirkos Sub-City traffic police department.
iii
ABSTRACT
Traffic Congestion is an ever growing chronic problem in the transportation system soon after the invention and mass production of automobiles. All major cities both in developed and developing countries are facing the problem due to increasing travel demand which follow economic and population growth. Traffic congestion directly affects commuters with and increased travel time excessive delay in queue, increased fuel cost, delay for important appointment on job, loss in productive hours; and it indirectly affects the living standard and the environment as well.
It’s known that Addis Ababa City Roads Authority Department of Traffic Safety is researching different sites in Addis Ababa to implement solutions at congested intersections. From these Jakros, Emperial and Cadisco Roundabouts are the few ones that are changed to signalized intersections. In addition, road rehabilitation techniques such as upgrading lane width, proper exit lane widening, Curve Stone & Walkways improvement, median correction, additional guiding signs, asphalt coating on damage carriageways, drainage corrections and speed brakes are some of the mitigation methods. In this project, two intersections that have high traffic demand are selected for traffic congestion assessment and mitigation methods. Namely the Lem-hotel intersection with four legs, three lanes each, that have high observed traffic delay and always manually controlled by at least two traffic polices. The 2nd one is the Urael Roundabout with four legs. It has an under pass that accommodates the AALRT & two vehicle lanes on the E-W corridor.
For each intersection various data and inputs such as recorded traffic volume, vehicle type and number, travel demand growth, geometric measurements of the sites are conducted. Then the data are simulated on standard PTV Vistro software to assess & quantify their LOS, congestion capacity, travel time, speed and rate based on high way capacity manual standards.
The assessment for Lem-hotel intersection shows a LOS of F. The travel speed observed at this intersection shows 5 km/hr at its peak time. Especially the E-W legs have consistent traffic demand throughout the day while the N-S legs get their peak traffic at the morning and evenings. The proposed solution for the above junction would be signalizing the intersection different scenarios along with other correlated mitigation methods. For Urael roundabout, the peak traffic which is at the evening & at the morning time has a LOS C and at lunchtime it improves to B which is taken as fairly good comparing to other intersections. The geometric feature & the underpass that accommodates a direct route from the E-W have a huge contribution for the fair flow. In addition to this, solutions that can progress the traffic flow at the roundabout further are recommended
iv
TABLE OF CONTENTS
ACKNOWLEDGEMENT ... i
ABSTRACT ... iii
LIST OF TABLES ... vi
LIST OF FIGURES ... vii
LIST OF ACRONYMS ... viii
1. INTRODUCTION ...1 1.1. Background of study ... 1 1.2. Problem statement ... 2 1.3. Objective Of Study ... 2 1.3.1. General Objective... 2 1.3.2. Specific Objectives ... 3
1.3.3. Significance of the study... 3
1.3.4. Scope of the study... 4
2. LITERATURE REVIEW... 5
2.1. Defining traffic congestion ... 6
2.2. Causes of traffic congestion... 8
2.3. Quantification of congestion... 9
2.4. Components of congestion ... 10
2.5. Congestion indicators... 11
2.5.1. Level of service (LOS) as congestion indicator... 11
2.6. Performance measures using travel time ... 13
2.7. Traffic congestion and accident... 15
2.8. Cost of traffic congestion ... 15
3. METHODOLOGY... 17
3.1. Project approach... 17
3.2. Data collection techniques and equipments ... 19
3.2.1. Video with manual transcription ... 19
3.2.2. Manual traffic volume and vehicle occupancy count... 20
3.3. Description of study area... 20
3.3.1. Population dynamics ... 22
v
3.4.1. Travel time data ... 24
3.4.1.1. Data reduction and quality control ... 25
3.4.2. Traffic volume and vehicle occupancy data... 25
3.4.2.1. Traffic volume data... 25
3.4.2.2. Vehicle occupancy data ... 26
3.4.2.3. Questionnaires ... 27
4. RESULT... 28
4.1. Software Introduction ………... 28
4.2. Congestion analysis... 28
4.2.1. Travel time ... 29
4.2.2. Average speed and travel rate ... 30
4.3. Intersections level of service (LOS) analysis ... 32
4.4. The software analysis result of the best scenario... 35
4.4.1. For Lemhotel Intersection... 35
4.4.2. For Urael Roundabout... 39
5. DISCUSSION...43
5.1. Traffic volume/flow trend at mid block and congestion ... 43
5.1.1. Directional flow at urael roundabout ... 43
5.1.2. Directional flow at Lem-hotel intersection ... 44
6. CONCLUSION ... 45
REFERENCES ... 47
APPENDIXES... 48
vi
Table 1: Major causes of traffic congestion ... 8
Table 2: Typical Highway Level of Service (LOS) rating (Source: HCM 2000) ... 11
Table 3: Typical Intersection Level of Service (LOS) rating (source: HCM 2000) ... 12
Table 4: Summary of Congestion measures (Source: (Tim Lomax, Shawn Turner, and Gordon Shunk, 1997) ... 14
Table 5: Major Intersections along East-West corridor ... 22
Table 6: major parameters that affect on the future traffic congestion... 24
Table 7: shows the raw data format of traffic count of sholla intersection... 25
Table 8: shows the raw data format of traffic count of Urael Roundabout... 26
Table 9: Passenger Car Equivalent factors (source: HCM 2000) ... 26
Table 10: Input geometric and traffic demand data ... 32
Table 11: summery of output for level of service analysis for intersections ... 33
Table 12: input data for the three scenarios of sholla intersection... 33
Table 13: Result of PTV Vistro software analysis for sholla intersection scenario 3 ... 35
Table 14: input data for the scenario of Urael roundabout... 38
Table 15: Result of PTV Vistro software analysis for Urael roundabout... 40
Table 16: PTV VISTRO sholla intersection traffic analysis result of 1st scenario... 48
vii
Figure 1: East-West Corridor of Addis Ababa City... 4
Figure 2: Conceptual frame work of Congestion Cause & Impact... 7
Figure 3: Components of Congestion (adapted from Jenks et.al 2008)... 10
Figure 4: Framework for project approach... 18
Figure 5: General description of Lem-hotel Intersection... 20
Figure 6: General description of Urael Roundabout... 21
Figure 7: Population of Addis Ababa in millions... 23
Figure 8: Real GDP Growth of Ethiopia... 23
Figure 9: Average Travel Time for Legs at Lem-hotel Intersection... 29
Figure 10: Average Travel Time for Urael Roundabout... 30
Figure 11: Average Travel Speed of Lem-hotel .Intersection... 30
Figure 12: Average Travel Speed of Urael Roundabout... 31
Figure 13: site view of lem-hotel intersection with its lane arrangement... 34
Figure 14: site view of Urael roundabout with its lane arrangement... 39
Figure15: Wehalemat leg- Public transport stops from the roundabout... 42
Figure16: Sholla Leg – Vehicles Parking on the Pass way Lanes... 45
viii AACRA Addis Ababa City Roads Authority FDRE Federal Democratic Republic of Ethiopia GDP Growth Domestic Product
HCM Highway Capacity Manual HDR Human Development Reports IMF International Monetary Fund
NCHRP National Corporative Highway Research Program
PTV Planung Transport Verkehr (German Logistics Software Company) RTA Ethiopian Road Transport Authority
Project Paper Page 1
1.
Introduction
1.1
Background of Study
As history of many cities shows, socio economic growth usually accompanied with and increasing demand for mobility and transportation. Through the whole world, countries and cities obligated to spend considerable portion of their GDP on transportation sector. In Ethiopia, different reports estimates the transportation expenditure to be about 10% of the country’s GDP; however, the actual cost incurred due to traffic congestion is not yet known.
Addis Ababa, which is the capital city of Ethiopia and the seat for many international organizations with more than 100 embassies, has now become one of the fastest growing relatively modern cities in the sub Saharan Africa. Following the current economic development in the country, Addis Ababa has become the economic hub of the nation due its geographical as well as political significance.
Accordingly many financial and commercial institutions and about 85% of the manufacturing Industries of the country are located inside and at the periphery of Addis Ababa. Such rapid socio-economic development in the city creates a huge demand for transportation and the passenger-Km travel is increasing. Accordingly, evidences show that the associated transportation problems in the city; namely, traffic congestion and traffic accident rate are becoming worse and worse.
The problem of traffic congestion in Addis Ababa has emerged and intensified within a short period of time despite efforts of the city administration in expanding the city’s road network. Therefore, proper quantification and measuring the extent or level of congestion is an important step for understanding the performance of the existing road network and for evaluation of proposed congestion mitigation measures.
Hence, this project will focus on this information gap and will asses and quantify the level of the traffic congestion on the selected study corridor of Addis Ababa based on travel time delay approach; and it will assess the effect of traffic congestion on the traffic accident situation of the city.
Project Paper Page 2
1.2
Problem Statement
In Addis Ababa, despite the intensive road network expansion and the limited number of vehicle ownership compared to the other sub Saharan countries, traffic congestion has now become the major threat in the cities economic growth by restraining the commuters’ mobility especially at peak hours. In addition to waiting time for the limited public transportation, both vehicle owners and public transport users are forced to delay within the congested traffic lane. Hence, late arrival to work places and appointments for social or business activities have become common. Therefore, quantitative studies and projects based on the engineering parameters of traffic congestion should be conducted to answer at least the following problems. These include:
The main causes and contributing factors for the traffic congestion in Addis Ababa. Parts of the road network that are more prone to traffic congestion in related to the studied
intersections.
The level of the traffic congestion quantitatively in terms of explanatory parameters showing its intensity, extent, duration and reliability.
the effect of traffic congestion on the traffic accident in the city
If mitigation techniques are to be applied which sections of the road network or intersection should be prioritized.
Accordingly this project will try to observe some of the problems by assessing and quantifying the traffic congestion along the highly congested East-West corridor of Addis Ababa (Lem-hotel intersection and the Urael roundabout sections). Thus efficient remedies will be taken if major threats are recognized to improve the traffic flow and network.
1.3.
Objectives of the Study
1.3.1
General Objective
The objective of this study was to try to answer the basic problems raised and give a solution by quanti fyin g the traffic congestion of Addis Ababa by taking a portion of the city. For instance, the travel time delay a traveler will spend at peak period, the total person-hours or vehicle hours delayed and wasted, the cost of fuel wasted due to congestion and the total cost of the congestion is incurred at Lem hotel and Urael junctions etc. are yet not known. Thus, this study will help decision makers to make an informed decision and initiate further researches.
Project Paper Page 3
1.3.2.
Specific Objectives
The specific objectives were to:
Measure the performance of Lem-hotel and Urael intersections during the time period of a day using travel time approach.
Determine the level of congestion intensity extent and reliability at these intersections.
Compare and prioritize road sections and intersections based on their traffic congestion level to identify where the traffic congestion is worse.
1.3.3.
Significance of the Study
Developing countries like Ethiopia are undergoingintensive road network expansion to alleviate traffic congestion which is now becoming a major threat for the economic growth. Thus considering the major hazardous places (routs) to quantify and assess the level and the effect of the traffic congestion on the road user and on the economy can be cost-effective way to improve the observed problems.
When assessments are done on a specific route, organizations such as Addis Ababa City Roads Authority, Urban Transport policy makers and the operators in the city can identify:
The congested traffic lane
the level of service of a given route
the travel time delay from origin to destination the major factors that contributed the congestion traffic accident in the city
cost of transport congestion
the performance of the intersections
So that they can easily implement the engineering remedy, prioritize the route that needs immediate solution, implement an advanced traffic management system compare intersections or routes and also provide information on the choice of road network at different peak hours.
Project Paper Page 4
1.3.4.
Scope of the study
As the topic of congestion assessment touches lots of areas and wide, it is necessary to define the scope of the study so that the untreated topics could be left for other investigation. Accordingly, the scope of this study was limited to the east –west corridor. From the above mentioned corridor, for the sake of this project two junctions are selected namely “Lem-Hotel” & “Urael” Junction. Other road sections and intersections were not included in this study. Furthermore, the analysis was segment study rather than area wide or regional study. Hence, it focused mainly on the road segments at the entry of selected intersections and the relative effect of consecutive intersection was not discussed.
Since the main objective of the study is assessing and quantifying the congestion level, the congestion management procedures and measures were not discussed as it is a wide and need its own investigation.
Figure 1: East-West Corridor of Addis Ababa City
Project Paper Page 5
2.
LITERATURE REVIEW
Many researchers and professionals in the field of transportation agree that road traffic congestion is an ever growing problem and global phenomenon of major cities throughout the world. Further to this Lomax (1997) showed that traffic congestion is expanding toward the suburbs as commercial activities are being pulled out of the central business districts (Lomax, Turner, and Shunk, 1997; Maitra, P.K.Sikdar, and S.L.Dhingra, 1999). In fact, it is almost certain that traffic congestion will also get worse during at least the coming decades mainly due to the increasing population number and the growing economy of nations. Traffic congestion is a negative output of a transportation system which has many detrimental effects on the performance of the road network, the traffic flow, the society, the national economy and the environment. Maitra (1999) summarizes some of the negative effects of traffic congestion as; considerable loss of travel time, higher fuel consumption, more vehicle emission and associated environmental and health impact, increased accident risk, stress and frustration on commuters and greater transportation cost.
Since it is a day to day occurrence to almost all road users, the concept of congestion as a serious problem of traffic flow is well known to the public or road users. However, many documents showed that there was no considerable effort to conceptually investigate congestion before 1990’s
(W.D.Cottrell, 2001; Lomax, Turner, and Shunk, 1997). According to Cottrell (2001), the 1991 Intermodal Surface Transportation Efficiency Act and the subsequent Transportation Equity Acts mark a significant start for researches and investigations on congestion as part of Congestion Management System (CMS) in United States of America. Since then different research efforts to develop methods and parameters for measuring traffic congestion have been proposed by different researchers and manuals.
Further to the above; many more researches have been conducted by different researchers and professionals to develop measuring parameters and models (Maitra, P.K.Sikdar, & S.L.Dhingra, 1999; Lomax, Turner, and Shunk, 1997; W.D.Cottrell, 2001). However, many scholars agree that unlike the other traffic flow characteristics, still there is no consistent definition and a single performance measure for traffic congestion (B.Medley and J.Demetsky, 2003). So far, different congestion measures and models have been proposed and used to determine the extent, severity and duration of congestion and also transport professional are still developing different models for congestion prediction and simulation (Moran and Koutsopoulos, 2010).
Project Paper Page 6 Proper quantification and measuring the extent or level of congestion is an important step for understanding the performance of the existing road network and for evaluation of proposed congestion mitigation measures. The congestion measures are needed to analyzing and prioritizing system improvement options, to provide quantitative information for policy makers and the public, to determine how much delay and queue size formed, which area or region is more congested (Lomax, Turner, and Shunk, 1997).
2.1
Defining Traffic Congestion
As a general term, congestion is a phenomenon that occurs almost in all walks of life which demand competition for certain service or supply. For instance, at banking desk, fuel stations, theater gates, e.t.c.
Similarly, the Hand Book of Transportation explain road traffic congestion as a phenomenon resulted when vehicles compete or demand for the available road space and the demand reaches or exceeds the capacity. Many scholars agreed that, despite the fact that engineers and other transport professionals had studied traffic congestion for long time, there is no still consensus even within academia on the single and precise definition of traffic congestion (T.Thianniwet and S.Phosaard, 2009).
There are many definitions given for traffic congestion based on different parameters. If we summarize them they all lie in at least one of the following definition. These are:
Traffic Congestion is travel time or delay in excess of that normally incurred under light or free flow travel condition.
Traffic Congestion is a situation where the traffic demand for the road space exceeds the capacity.
Traffic Congestion is an excess of vehicle on the portion of the road way at a particular time resulting in slower speed from normal or free flow speed and mostly characterized by stop or stop-go traffic.
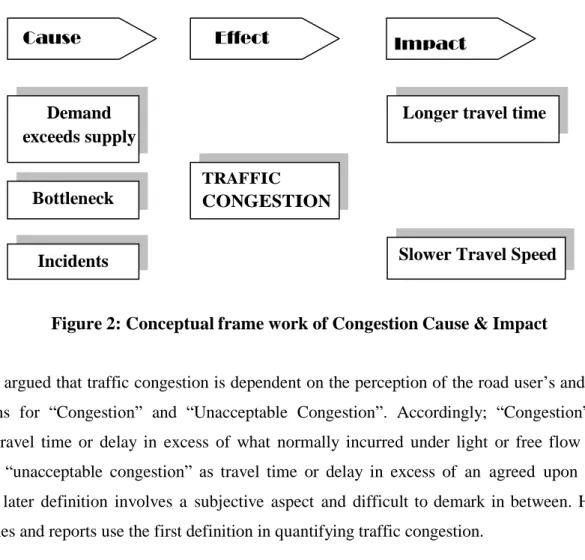
As it can be seen from the above definitions and the diagram below, definitions of traffic congestion generally fall in to two major categories. These are definitions which base on the cause and which base on the impact of traffic congestion. However, in order to quantify or measure traffic congestions definitions which are based on the impacts are more appropriate due to the fact that the impact of traffic congestion can be felt by many road users and easy to understand.
Project Paper Page 7
Cause Effect Impact
Figure 2: Conceptual frame work of Congestion Cause & Impact
Lomax (1997) argued that traffic congestion is dependent on the perception of the road user’s and gives two definitions for “Congestion” and “Unacceptable Congestion”. Accordingly; “Congestion” was defined as a travel time or delay in excess of what normally incurred under light or free flow travel condition and “unacceptable congestion” as travel time or delay in excess of an agreed upon norm. However, the later definition involves a subjective aspect and difficult to demark in between. Hence, many researches and reports use the first definition in quantifying traffic congestion.
In traffic engineering, flow is an important parameter that shows the state of the traffic movement. In terms of traffic flow, congestion is usually considered as the state where the speed-flow graph is reverted or sloped positive. Hence, congestion can be defined as a state in the traffic flow pattern which represents the condition at which demand exceeds capacity or the speed is below acceptable value (Yu, Liu, Shi, and Song, 2010).
Depending on its occurrence congestion can be classified as recurring and non-recurring congestion. Recurring congestion includes congestion due to bottlenecks, traffic signal, and persistent higher demand etc and they are predictable. Whereas, non-recurring congestion includes those congestions caused by accidents and unprecedented events. (Skabardonis, P.Varaiva, and F Petty, 2003).
Demand exceeds supply Bottleneck Incidents TRAFFIC CONGESTION
Longer travel time
Project Paper Page 8
2.2
Causes of Traffic Congestion
Different researches and reports identified many interrelated factors that cause traffic congestion in developed and developing countries where the road network and road users behavior are different. For instance, the research by Aworemi, et.al;( 2009) identified the major traffic congestion causes in United states of America. Accordingly, the results showed that in the United States of America the cause and their percentage share are; bottleneck (40%), traffic incidents
(25%), work zone (10%), bad weather (15%), poor signal timing (5%) and special events
contribute 5% of the traffic congestion.
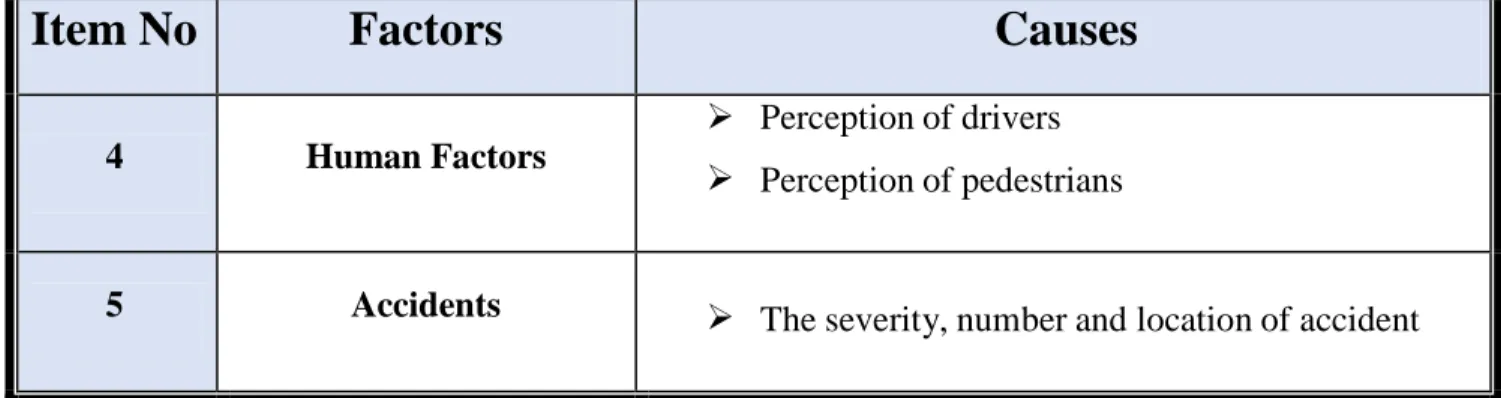
Adedimila (Aworemi, et.al: 2009) classifies the major causes of traffic congestion in to five and the summary of his discussion is shown in the Table 1 below.
Item No
Factors
Causes
1 Social And Economic Factors
Rising population number together with the rural- urban migration
Unplanned land use which result unidirectional traffic flow especially at pick hours
Increased car ownership in line with the improved living standard
2 Road Factors
Smaller number of lane & Narrow road with
Lack of side walk which result occupation of traffic lanes by pedestrians
Lack of parking which reduce the capacity of a lane because its being used as parking
Uncontrolled traffic Intersections
3 Vehicle Factors
Size of vehicle
Project Paper Page 9
Item No
Factors
Causes
4 Human Factors
Perception of drivers
Perception of pedestrians
5 Accidents The severity, number and location of accident
Table 1: Major causes of Traffic Congestion
2.3
Quantification of Congestion
According to Cottrell (Empirical Freeway Queuing Duration Model Journal of Transportation Engineering 2001) and other studies, during the early 1990’s the ever growing traffic congestion became the concern of transport agencies of major metropolitans. Then different legislations and acts were drawn in the United States of America which demands transport agencies to establish Congestion Management Systems (CMSs).
The survey made by Lomax (NCHRP Report 398 " Quantifying Congestion “ 1997) investigate the
existing practice of different agencies for measuring traffic congestion showed that there were a range of empirical measures being used by different agencies and out of these about 90% used the Level of Service (LOS) as congestion measure as defined in Highway Capacity Manual (HCM). However, the same research assesses the suggestion of agencies to on the most appropriate measure for congestion. Accordingly, Travel delay and Travel time/ speed were frequently proposed as the best congestion measure (Lomax, Turner, and Shunk, 1997).
The Highway Capacity Manual 2000 defines six states of traffic flow or operations with clear boundaries of traffic flow parameters. The six states of traffic flow are named with the English alphabet from A to F where A represents a free flow condition while F represents a blocked or a stop and go traffic flow. However, the HCM do not specify a boundary as to which LOS is considered as congested state. Hence, different agencies define their own boundary for congestion and the survey result showed that LOS C, D, E and the worse were used by agencies. Furthermore, as the HCM uses the volume to capacity ratio or saturation index (v/c) as a base for LOS criteria, some agencies were using the v/c ration for measuring congestion and the values ranging from 0.8-1.25 were used as a boundary for defining congested state (Lomax, Turner, and Shunk, 1997;Schrank, Lomax, and Turner, 2010).
Project Paper Page 10 However, all the above congestion approaches both LOS and v/c ratio cannot be a comprehensive measure for congestion due to the fact that congestion is a multidimensional phenomenon. Meyer (1994) indicates that there is no consistent congestion measure used by transport engineers and planners to monitor system congestion. Meyer also states “A good set of congestion measures has the potential to improve not only the quality and consistency of public transportation policy but also pubic understanding of the congestion phenomenon, leading to political support for policy improvements and more rational behavior by individual travelers”.
Accordingly, most literatures agree that travel time approach for quantifying congestion gives a better opportunity for public and policy makers to understand the level of congestion.
2.4
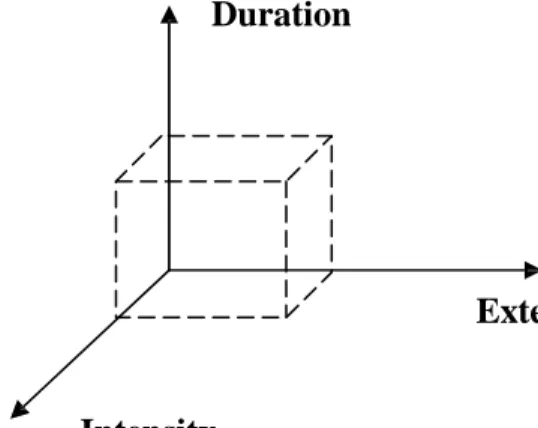
Components of CongestionAll researches done so far agreed that in order to fully express traffic congestion, it is necessary to understand its four components or dimensions; namely, duration, extent, intensity and reliability (Jenks et.al., NCHRP Report 618: Cost Effective Performance Measures for Travel Time Delay, Variation and Reliablity.2008). Duration express the amount of time that the congestion affects the transportation system or lasts with daily recurrences possible. Extent concerns with the number of persons or vehicles affected by travel delay. Intensity describes how much the congestion is severe and affects the travel and Reliability/Variation describes the changes in the above three other parameters and their predictability. The four dimensions are very important and can help to define the magnitude of congestion.
Duration
Extent
Intensity
Project Paper Page 11
2.5
Congestion Indicators
As congestion is a relative measure unlike the other traffic flow parameters and it is defined on the road user’s feedback on how the transports system is operation at a given period of time; it is essential to define or have indicators of the presence of congestion in the system. According to
Cottrell ((Empirical Freeway Queuing Duration Model Journal of Transportation Engineering 2001)) many other researchers LOS is the best empirical indicator of congestion in transport system. Moreover, according to Lomax ( NCHRP Report 398 " Quantifying Congestion “ 1997) the road user’s perception as a measure for “acceptable” or “Unacceptable” congestion can be taken as an indicator or a demarcation for classifying a road section or an intersection as Congested or not.
2.5.1.
Level of Service (LOS) as Congestion Indicator
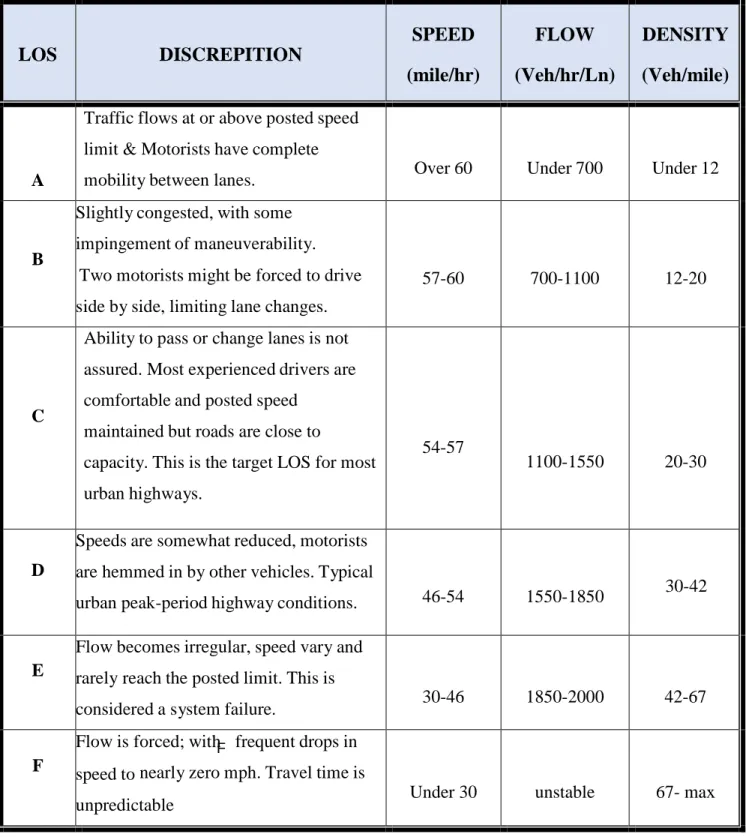
The objective of High way Capacity Manual (HCM) is to provide a consistent system and techniques for the evaluation of the quality of service on highways and street facilities. The HCM does not set policies regarding a desirable or appropriate quality of service for various facilities, systems, regions, or circumstances. Its objectives include providing a logical set of methods for assessing transportation facilities, assuring that practitioners have access to the latest research results, and presenting sample problems. HCM presents LOS as an easy-to-understand methodology of analysis and performance measure for single homogenous road segments. LOS is featured for describing conditions in road links and there is no direct methodology for aggregation. LOS has been criticized by analysts and experts in the area, but it is still in use for the easy-to-communicate properties.
Level Of Service
(LOS)
Delay At Signalized
Intersection
Delay At Un-Signalized
Intersection
A ≤ 10 sec ≤ 10 sec B 10-20 sec 10-15 sec C 20-35 sec 15-25 sec D 35-55 sec 25-35 sec E 55-80 sec 35-50 sec F ≥80 sec ≥50 secProject Paper Page 12 F
LOS
DISCREPITION
SPEED
(mile/hr)
FLOW
(Veh/hr/Ln)
DENSITY
(Veh/mile)
ATraffic flows at or above posted speed limit & Motorists have complete
mobility between lanes. Over 60 Under 700 Under 12
B
Slightly congested, with some impingement of maneuverability. Two motorists might be forced to drive side by side, limiting lane changes.
57-60 700-1100 12-20
C
Ability to pass or change lanes is not assured. Most experienced drivers are comfortable and posted speed
maintained but roads are close to
capacity. This is the target LOS for most urban highways.
54-57
1100-1550 20-30
D
Speeds are somewhat reduced, motorists are hemmed in by other vehicles. Typical
urban peak-period highway conditions. 46-54 1550-1850
30-42
E
Flow becomes irregular, speed vary and rarely reach the posted limit. This is
considered a system failure. 30-46 1850-2000 42-67
F
Flow is forced; with frequent drops in speed to nearly zero mph. Travel time is
unpredictable Under 30 unstable 67- max
Project Paper Page 13 As it is stated earlier, HCM doesn’t specify the boundary LOS for congestion state but clearly states that the LOS F is defined as the worst state of flow and represents congested flow. Though there are some reports using other level of service (D and E) as congested flow, LOS F is generally accepted as a state of traffic flow and hence LOS is the most appropriate congestion indicator. The LOS criteria on the HCM are given in the form of min speed, flow or density for road way sections and as a max delay in sec for signalized and un-signalized intersection.
2.6
Performance measures using Travel Time
Each of the dimensions of traffic congestion stated before can be measured with different operational characteristics (speed, delay, travel time, density e.t.c) or volume characteristics (operating traffic volume, volume to capacity ratio, traffic volume per lane, e.t.c). Many literatures including the
NCHRP report 398 “Quantifying Congestion” provide different measures for congestions based on travel time approach. Most of the measures explain only one or two of the dimension of congestion and hence it is necessary to use more than one congestion measure to explain the level of congestion at a road section. Accordingly, there are quite a number of congestion measures suggested in different literatures for each congestion dimension. The following congestion measures are taken & summarized mainly from Quantifying Congestion by Lomax (1997) and Jenks et. Al, NCHRP Report 618: Cost Effective Performance Measures for Travel Time Delay, Variation and Reliability. (2008) .
Further to the following listed congestion measures in Table 4, new parameters in the form of indexes have been emerging (Anjaneyulu and B.N.Nagaraj, Modeling Congestion on Urban Roads Using Speed Profile Data.2009; Maitra, P.K.Sikdar, and S.L.Dhingra, Modeling Congestion on Urban Roads and Assessing Level of Service. Journal of Transportation Engineering 1999). These indexes give a better understanding of the severity of the congestion in terms of its spread over time and space.
Project Paper Page 14 Table 4: Summary of Congestion measures (Source: (Tim Lomax, Shawn Turner, and Gordon Shunk, 1997)
Project Paper Page 15
2.7
Traffic Congestion and Accident
There are only limited projects and researches available on the relationship between traffic accident and congestion as it relates to the performance of the transportation system. Some practical evidence is mixed on the degree to which congestion reduces the number of traffic accident on a congested road segment. In some cases, traffic accident shows a reduction in less congested road section. The study concludes that shifting vehicle travel from congested to less congested condition tends to reduce traffic accident but increases the accident severity. Other researches agreed that traffic congestion causes traffic accident and hence the cost of congestion should include the cost of accident risks.
The traffic accident rate in Ethiopia is reported to be one of the highest accident rates in the world. Though, the vehicle ownership in the country is the lowest among the sub-Saharan countries, the traffic accident is found to be the highest. According to the Ethiopian Road Transport Authority statistics about 1,800 people died, 7000 people injured and over 400 Million Birr was lost only in the year 2003 (RTA web site acceced on 1/9/2003).
Birhanu (Effect of Road & Traffic Factors on Road safety in Ethiopia.2000) in his PhD dissertation disclosed that out of the total traffic accident in Ethiopia, 21 % of the fatalities, 42% of injury accidents and 65% of the total accidents occurred in Addis Ababa. Moreover, he related the traffic volume as a parameter in the traffic accident model and concluded that as the travel volume increase the headway between vehicles decrease and minor nose-tail collision rate increases. Even though there are many research have been conducted on the traffic accident & safety issues in Ethiopia, there was no any research so far studied on the relations between the traffic accident and the traffic congestion in the context of Ethiopia or Addis Ababa.
2.8
Cost of Traffic Congestion
Many transport engineers and economists have been interested in costing traffic congestion for long period and different studies have been done to estimate the cost of traffic congestion. As all planning and congestion mitigation measures decisions require a quantified cost benefit analysis, costing traffic congestion is a critical task in traffic congestion management process.
Traffic congestion costs nations for their transportation activities, negatively impact their national economy, impair the quality of life by costing traveler’s time and money, degrading the environment and causing accident.
Project Paper Page 16 According to HDR (Cost of Road Congestion in the Great Toronto & Hamilton areas: Impact and Cost Benefit Analysis of Metro link draft regional Transportation Plan: 2008) report the principal economic and social costs of traffic congestion are:
The costs of reduced economic output and accompanying job losses The costs of travel delay or lost time
Vehicle operating costs (fuel, ideal time)
Environmental costs and higher frequency of accident risks
Estimating the social and environmental cost is much difficult and different from area to area; but, some literatures try to estimate person hourly cost as a function of considering all trips to work place.
Project Paper Page 17
3.
METHODOLOGY
The methodology employed for this project work was the critical aspect for ensuring the proper result which aligns with the objective or the research question rose. Hence this part of the project discusses the methodology.
3.1.
Project Approach
The project approach involves both quantitative and qualitative approaches. Quantitative Data and analysis were used to determine the level of service of intersections and to measure the congestion levels quantitatively. Observation, direct field measurements and secondary data were the main sources of quantitative data. Furthermore, Qualitative Data from questionnaire were also used to determine whether the congestion in the study areas (Lem Hotel Intersection and Urael Roundabout) considerable or not and to assess other related parameters.
Observations, collecting relevant data and subsequent analysis of the data help to generate inductive conclusions on the level of congestion at the observed or considered Intersection and roundabout. This two study areas connect the highly populated residential ends and passes through the central business district of the city.
As it shown in Figure: 4 below, in order to assess whether the intersections or the roundabout are congested or not; a key question “Does traffic congestion exists at this location?” was raised and answered first using congestion indicator parameters. The congestion indicator parameters used were Level of Service (LOS) and road users’ perception. The LOS criterion was according to HCM-2000 and determined using the widely used PTV Vistro software and the road users’ perception was collected using questionnaire.
Then, the level of the congestion was done using travel time approach. In doing so, the performance measure parameters were used to measure the intensity, extent and duration of the congestion. As travel time approach is easy to understand and interpret by every people and it is easy to convert to other index parameters, the performance measurement parameters were based on travel time approach.
Project Paper Page 18 Figure 4: Framework for project approach
INTENSITY
Define Study Corridors
Sampling Intersection &
Roundabout
Is The Traffic Congestion Considerable?
YES NO
SEGMENT1
DURATION EXTENT RELIABILITY
Comparison b/n intersection & roundabout SEGMENT2 Indicators LOS Commuter Perception
Project Paper Page 19
3.2.
Data Collection Techniques and Equipments
Different types of data were collected for the purpose of this project mainly through primary sources and some data were acquired through secondary sources. For the primary data collection internationally reputable and recommended techniques of traffic data collection were used. The primary traffic flow and travel time data collection technique used were
1. Video recording with manual transcription 2. Manual traffic volume count
In addition, to the above traffic flow and travel time data collection techniques other field measurements were done to gather data on the geometrical features of intersection for capacity analysis. These include, number of lanes, lane width, configurations of lanes, grade, width of median, movement policy e.tc. These measures were done for the intersections whose level of service is going to be determined.
The other kind of primary data collection technique used was questionnaire. A structured questioner was developed to gather additional information on the perception of road users’ about the Addis Ababa city traffic congestion. The questioners were distributed randomly for road users (taxi drivers, private car owners, public transport users).
3.2.1.
Video with Manual Transcription
Video recording and manual transcription or tracing were used to collect travel time data. This method of travel data collection relies on video cameras to collect or capture the traffic flow in the field and human personnel to transcribe or trace vehicles into a database at the office after the actual time of data collection. According to travel time collection handbook; though it is costly, Video capturing techniques is preferred over the manual collection (pen and paper method) because:
it provides a permanent, easily-review record and show the traffic conditions at any time; it permits the reading of required parameters in a controlled environment in which plate
characters can be closely examined;
it provides additional information about traffic flow characteristics such as traffic volume and vehicle headway; and
It can provide a time stamp for accurate determination of arrival times. have better accuracy than manual methods; and
Project Paper Page 20 3.2.2.
Manual Traffic Volume and Vehicle Occupancy Count
Manual traffic counts were conducted at to determine the directional traffic volume and flow at every 15 min. furthermore, vehicle occupancy study were conducted using manual count method at intersection. Therefore, from this data collection the following quantitative data were generated. These include,
Directional Traffic Volume/flow per 15 min of interval Vehicle composition
In addition to the primary data acquired in the above methods, some secondary data; mainly on Traffic accident, vehicle population, population and economic growth parameters were taken from other literatures and reports. The sources of these secondary data are properly acknowledged at their respective locations.
3.3.
Description of Study Area
The study area selected is Addis Ababa city which is the capital city of Ethiopia. For this particular project, only the east west corridor (“Lem-Hotel” & “Urael” Junction) will be considered.
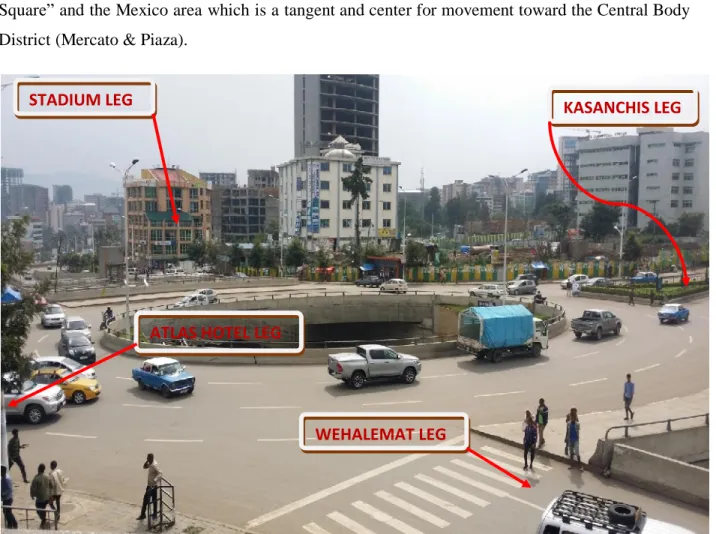
Figure 5: General description of Lem-hotel Intersection 24 ROAD LEG LEG MEGENAGNA LEG LEG SHOLLA LEG LEG KASANCHIS LEG LEG
Project Paper Page 21 The east –west corridor of Addis Ababa is defined to start its eastern end from the intersection with the ring road at Megenagna and its west end at the Torhailoch intersection with the ring road. This corridor stretches for 9km and encompasses the Haile G/silase street- Jemo Keniyata street- Ras Mekonen Street- Chad-streets. This corridor passes through the city’s core area of “Meskel Square” and the Mexico area which is a tangent and center for movement toward the Central Body District (Mercato & Piaza).
Figure 6: General description of Urael Roundabout
The East-West corridor also links the two highly populated residential areas at the west (Ayer Tena) and at the east (Ayat & CMC). Due to the above facts this route is found to be the highly trafficked and congested route during peak hour.
STADIUM LEG KASANCHIS LEG
ATLAS HOTEL LEG
Project Paper Page 22
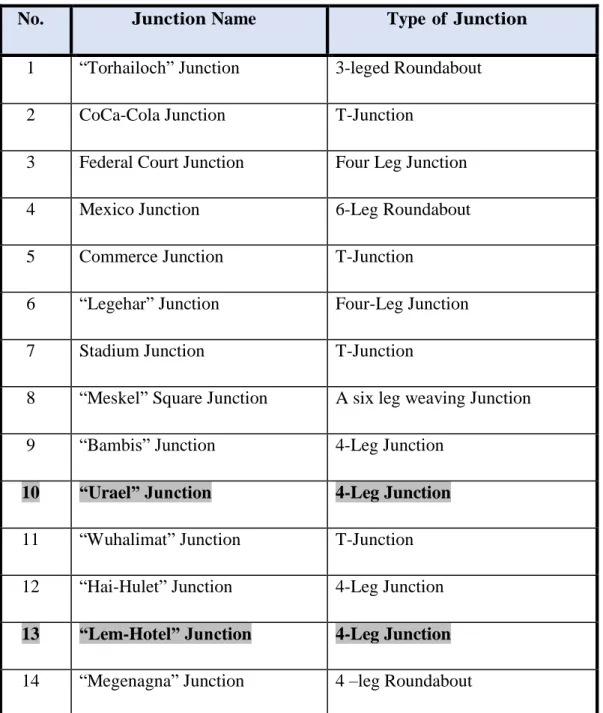
No. Junction Name Type of Junction
1 “Torhailoch” Junction 3-leged Roundabout
2 CoCa-Cola Junction T-Junction
3 Federal Court Junction Four Leg Junction
4 Mexico Junction 6-Leg Roundabout
5 Commerce Junction T-Junction
6 “Legehar” Junction Four-Leg Junction
7 Stadium Junction T-Junction
8 “Meskel” Square Junction A six leg weaving Junction
9 “Bambis” Junction 4-Leg Junction
10 “Urael” Junction 4-Leg Junction
11 “Wuhalimat” Junction T-Junction 12 “Hai-Hulet” Junction 4-Leg Junction 13 “Lem-Hotel” Junction 4-Leg Junction 14 “Megenagna” Junction 4 –leg Roundabout
Table 5: Major Intersections along East-West corridor
3.3.1.
Population Dynamics
According to the FDRE Census result 2007and Urban Transport Studies and previous census report the population of Addis Ababa is increasing at an alarming rate. The annual growth rate for 2007 was 2.1% and according to estimates the population number will be about 5 Million by 2020. Migration from rural area contributes more than half the population growth rate.
Project Paper Page 23 Figure 7: Population of Addis Ababa in millions (Source: FDRE Census result 2007and Urban Transport Studies 2005)
3.3.2.
Economic Activity
According to the International Monetary Fund (IMF)-World Economic outlook report, the real GDP growth of the country is summarized in Figure 8 below.
As most of the economic activities in the country centers the capital city Addis Ababa, such economic growth of the country obviously reflected in the cities economic activities. Therefore, we can conclude that the economic activity in Addis Ababa is increasing with equal or higher rate than the national economic growth rate.
Figure 8: Real GDP Growth of Ethiopia (source: Global Finance Magazine web site accessed on 28/8/2012
Project Paper Page 24 The parameters which affect traffic congestion level discussed above are summarized in the following Table from (source: Urban Transport study 2005)
Parameter
Trend
Population Increase by average annual rate of 2.1%
GDP Average yearly GDP of 8.5%
Vehicle Number Increase 5% yearly
Travel Demand Will increase by 106% in 2020
Table 6: Major parameters that affect on the future traffic congestion
Remark: This data is for general information based on previous available record, may not be applicable for the current parameters.
3.4.
Data Collection
To attain the objectives, different types of quantitative and Qualitative data namely; traffic flow or volume data, vehicle occupancy data, travel time data and travel accident data and road users’ congestion perception data and causes of traffic congestion were required. Despite the challenges, an attempt was made to collect the data using the techniques stated in the methodology and described below at each section. This section of the study discusses how data was sampled, collected and extracted from the data source.
3.4.1.
Travel Time Data
Travel time data was the most important data for the congestion analysis. In order to collect the travel time data, the procedures described on (Travel Time Data Collection Handbook Office Of Highway Information Management Shawan M. Turner, William L. Eisele, Robert J Benz 1998) were followed. Accordingly, video with manual transcription was taken and data collected using this technique. This method was chosen because;
The video data provides a permanent, easy -review record of traffic condition. Helps to capture as much as data required or helps to capture large sample size data.
Project Paper Page 25
3.4.1.1.
Data Reduction and Quality Control
According to the sample size determined above, travel times were determined for each segment within 15 min interval and recorded in an Excel database. However, the data were bulk and it is necessary to reduce and produce manageable travel time data. The travel time data collection handbook recommends the reduction in two ways:
1. Reduce the number of data records by eliminating invalid data; or 2. Producing a summary data and statistics at different aggregation levels
Accordingly, the data were averaged or mean value was take for the 15 min interval data and central tendency statistical tests were done using the standard deviation and coefficient of variance. In reducing the data outlier values were eliminated. The raw data for the travel time of each section is summarized in tabular form.
3.4.2.
Traffic Volume and Vehicle Occupancy Data
3.4.2.1. Traffic Volume DataTraffic volume and vehicle occupancy data are very important to determine and understand the flow pattern in the facility, to determine the peak flow rates and peak periods, to assess the relationship between traffic volume and congestion. Furthermore, it is extremely required to analyze the level of service of a facility and quantify the congestion intensity.
Project Paper Page 26 Table 8: Shows the raw data format of traffic count of Urael Roundabout
The vehicle volume count should be converted to passenger’s equivalent unit to conduct congestion analysis. Therefore, following the Passenger Equivalent factors were used to convert the traffic volume count in to PCU.
Table 9: Passenger Car Equivalent factors (source: HCM 2000)
3.4.2.2.
Vehicle Occupancy Data
Vehicle occupancy; which is the number of peoples per vehicles, is an extremely important parameter in traffic engineering and transportation planning. Usually it is used to convert person trip to vehicle trip in the four step travel demand forecasting process and to determine parking space requirement for public facility and spaces. However, its use is becoming increasingly important in the congestion management process to compute person-delay; person-mile e.t.c. Hence, vehicle occupancy is very important parameter for calculating congestion intensity parameters.
Project Paper Page 27 The raw vehicle occupancy data for this study was obtained from Addis Ababa City Transport Authority and it was processed to be used in the congestion analysis. The raw data gave the occupancy for each vehicle type over the period of the study. However, as a single average value is needed for the analysis, the weighted average vehicle occupancy is calculated as per the following equation
Weighted Average Vehicle Occupancy: AVOw =
Where: AVOw = Weighted Average Vehicle occupancy
Vi,t = Traffic volume of ith vehicle category at time interval t
VOi,t = the Vehicle occupancy of the ith Vehicle category at time interval t
3.4.2.3.
Questionnaires Response
A small structured questioner was prepared in order to gather additional information for the congestion analysis. As congestion is a function of people’s perception toward their time and their trip purpose, it was necessary to gather information and data on how the road users in Addis Ababa perceive the current traffic congestion and know how much delay is acceptable for them.
According to the definition by (Lomax, Turner, and Shunk, 1997; Maitra, P.K.Sikdar, and S.L.Dhingra, 1999) congestion is a travel delay in excess of the acceptable travel time. Hence, according to this definition the road user’s element should be included to define the demarcation between congested and uncongested. Hence, the structured questioner was distributed randomly for road users (Taxi drivers, passengers and Traffic police,) on the two study area corridors.
The questioners were distributed through interview-questioner the respondent while filling the questioner) and distributing for respondent.
Project Paper Page 28
4.
RESULT
4.1.
Software Introduction
PTV Vistro is a complete traffic analysis solution giving you all the tools necessary to complete traffic engineering and transportation planning studies and evaluations. With such software’s, we can evaluate development impacts, optimize and re-time traffic signals, evaluate intersection levels of service, and generate report-ready tables. This makes it a useful tool for many different types of traffic and transportation studies, saving time through its all-encompassing functionality.
Specific tasks that you can complete using Vistro include:
Calculate Intersection Level of Service for signals, two-way stops, all-way stops, and roundabouts using industry standard methodologies, including HCM 6th Edition, HCM 2010, HCM 2000 methods.
Optimize Signal Timing for individual intersections, routes, and within user-defined timing parameters
Evaluate the impacts of New Developments using the integrated Trip Generation, Trip Distribution, and Trip Assignment functionality to efficiently track trips through your network and analyze the impacts of the additional traffic
Test Mitigation Options for failing intersections and compare the various options to each other and the base network
Manage Multiple Scenarios in One Location to maximize the efficiency of completing multiple time periods, horizon years, and alternatives
Visualize Results on your network or as graphical output for various volume levels, volume balancing results, LOS, and optimization.
Evaluate Need for a New Traffic Signal through the built-in MUTCD Signal Warrants Analysis.
4.2.
Congestion Analysis
The travel time, traffic volume and vehicle occupancy data were used to analyze the congestion along the study corridor. The congestion analysis was based on the travel time approach and hence the following congestion measures were analyzed. These are; Average travel speed, travel rate, delay rate.
Project Paper Page 29 Accordingly, the analysis result of each parameter is shown in the subsequent sections.
For Lem-hotel Intersection
For Sholla road, signalized intersection is the better traffic congestion mitigation method considering the architectural and site structure. For example as a current potential mitigation road rehabilitation including upgrading carriageway and walkway is out of option considering the newly constructed buildings on all four corridors adjacent to the intersection. Currently the intersection is un-signalized with high traffic congestion level. By using signals the congestion level or the level of service of the intersection and adjacent road segment can be improved from E to C. this foretold result can be more elaborated as following.
4.2.1.
Travel Time and Travel Rate
The Figure, below shows the average travel time at 30-min interval for the segment/leg selected. According to the result, the morning and evening peak periods recorded the higher travel time and the lowest travel time recorded during the mid day or lunch time. However, travel time recorded of Siginal and sholla leg shows that the travel time during the evening peak period is higher than the morning peak period travel time.
Lem-hotel intersection adjacent leg
Figure 9: Average Travel Time (Sec) for Legs at Lem-hotel Intersection (100 m length) Urael roundabout adjacent leg
At the Urael roundabout, although the peak flow periods are not as radical as the previous one still at the morning and at evening time the flow seems to take a relatively higher delay. Especially at the legs of Atlas
0 10 20 30 40 50 60 70 80
MICHAEL SHOLA LEG 24 LEG
SIGINAL LEG MEGENAGNA LEG
Project Paper Page 30 hotel and Kasanchis the delays are higher than the Wehalemat and Stadium legs. This is because the two legs have an underpass. Thus most of the vehicles are diverted to the bypass route.
Figure 10: Average Travel Time (Sec) for Urael Roundabout (100 m length)
4.2.2.
Average Speed
The average speed calculation at the congested road sections considered in this study is shown in Figure. On Lem-hotel intersection the speed of the traffic flow is between 5km/hr – 15km/hr. though the speed seems to take its peak period at the morning and evening time, there is no radical inclination throughout the day. This shows that the traffic flow at this intersection almost reached its maximum capacity level.
Figure 11: Average Travel Speed of Lem-hotel Intersection (Km/Hr)
0 5 10 15 20 25 30 35 40 45 50
ATLAS HOTEL LEG KASANCHIS LEG STADIUM LEG WEHALEMAT LEG 0 5 10 15 20 25
MICHAEL SHOLA LEG 24 LEG
SIGINAL LEG MEGENAGNA LEG
Project Paper Page 31 The travel rate which is the inverse of travel speed and the very important parameter in congestion analysis is calculated and shown below in
Figure 12: Average Travel Speed of Urael Roundabout (Km/Hr)
The result shows for Urael roundabout during the morning period travel speeds at the sections are with an average speed of 20 Km/hr. However, during mid day the travel speed increased to the maximum value which is the highest travel speed. Then at the afternoon from 11:00 – 12:00 where many people get off from school and work the travel speed becomes between 10km/hr - 20km/hr that shows more congestion time.
4.3.
Intersections Level of Service Analysis
According to the methodology described above, first, it is necessary to justify that the intersections and the road sections to be analyzed are in congested state based on accepted standards and norms. Accordingly, in order to check whether the intersections are congested or not, analysis was made using PTV Vistro program. In order to analyze the LOS using the program, installation was made with the options right-hand driving rule and HCM 2010 metric version which represent the driving rule of Ethiopia. The HCM 2010 metric version was chosen because it is widely accepted Highway capacity manual throughout the world with only minor modifications and calibration. As only the level of service (LOS) will be determined for an indicative result leaving the other out puts of the program, calibration was not taken as an issue for the purpose. 0 5 10 15 20 25 30 35 40 KASANCHIS LEG ATLAS HOTEL LEG STADIUM LEG WEHALEMAT LEG
Project Paper Page 32 Due to the availability of traffic flow data the level of service (LOS) was made on the two intersections specifically where travel time data was collected.
In order to conduct the analysis the geometric and directional hourly traffic volume data were prepared as an input for the program as summarized below in the Table. However, recommended and default values were take for other input data; for growth factor, diverted traffic volume instance critical gap.
Remark: This volume is total of both light and heavy vehicles, but for the program the actual separate values were used for light and heavy vehicles.
N
o. Intersection Approach Leg
Numb Of Entry Lanes Numb Of Exit Lanes Lane Width (M) Media n Width (M) Total Traffic Volume (Veh/Hr) LT TH RT 1 Lem-hotel Intersection Michael Shola 3 3 3.3 0.4 68 412 144 Megenagna 3 3 3.3 0.4 132 552 248 24 Approach 3 3 3.3 0.4 584 468 152 Siginal 3 3 3.3 0.4 200 364 280 2 Urael Roundabout Stadium 2 2 3.6 30 270 132 330 Wehalemat 2 2 3.6 30 120 216 270 Atlas Hotel 4 4 3.6 1.5 180 474 456 Kasanchis 4 4 3.6 1.5 354 618 126
Table 10: Input geometric and traffic demand data
During the analysis period all the intersections were considered as un-signalized - Give-way intersection type. Accordingly the analysis run and the results of the analysis are summarized below.
Project Paper Page 33 no Intersection Approach Leg
Degree of Saturation (V/C) LOS Remark V C V/C 1 Lem-hotel Intersection Michael Shola 624 764 0.82 C Megenagna 932 915 1.02 C 24 Approach 1204 1661 0.73 C Siginal 844 959 0.88 C 2 Urael Roundabout Meskel 732 856 0.85 C Wehalemat 606 946 0.64 C Atlas Hotel 1110 1536 0.72 C Kasanchis 1098 1818 0.6 B
Table 11: Summery of output for level of service analysis for intersections For Lem-Hotel Intersection
The above discussed details are used as an input in the PTV Vistro software with different scenarios to analyze the best traffic mitigation methods. The scenarios are discussed below shortly.
Scenario
Lane
Configuration
Cycle
Length
Control Group
Priority Scheme
L TH R N S E W
1st`
80 Split split split min min maj maj
2nd
120 protected overlap permissive maj maj min min
3rd
80 protected overlap permissive min min maj maj
Project Paper Page 34
4.4.
The Software Analysis Result of the Best Scenario
4.4.1.
For Lem-Hotel Intersection
The analysis result of all the three scenarios attached at the end of this paper. The third result is displayed below for discussion
Project Paper Page 35
Project Paper Page 38
4.4.2.
For Urael Roundabout
These lane configurations are used for to analyze the traffic flow and level of service of urael roundabout.
kasanchis Atlas hotel Wehalemat Meskel adebabay
Lane configuration
Project Paper Page 39 Figure 14: Site view of Urael roundabout with its lane arrangement
Project Paper Page 40
Project Paper Page 42
5.
DISCUSSION
5.1.
Traffic volume/flow trend at intersection midblock and congestion
5.1.1.
Directional Flow at Urael Roundabout
The directional traffic flow analysis for the four midblock of URAEL ROUNDABOUT shows some interesting trends. The two mid-block approaches (100m from the roundabout) which are the Kasanchis Approach and the Atlas Hotel Approach have their peak traffic flow trend which is on the afternoon from 9.00 – 11:00 local time.
However, for the other two mid block approaches (100m from the roundabout) Meskel Adebabay Approach and the Megenagna Approach Midblock the directional traffic flow or volume shows nearly constant traffic volume flow throughout the day but have a slight peak time at morning 2:30 – 4:30 and from 11:00 – 1:00 which is a different trend from the other two mid-blocks. The main reason for the congested flow at these two approaches is the train station crossing. Simple as it seems, these crossing which are prepared for commuters to access the train extremely retards the traffic flow of the vehicular road. Vehicles around these crossings are forced to stop three (3) times on average within a single minute which slows down the flow activity.