econstor
www.econstor.eu
Der Open-Access-Publikationsserver der ZBW – Leibniz-Informationszentrum Wirtschaft The Open Access Publication Server of the ZBW – Leibniz Information Centre for Economics
Nutzungsbedingungen:
Die ZBW räumt Ihnen als Nutzerin/Nutzer das unentgeltliche, räumlich unbeschränkte und zeitlich auf die Dauer des Schutzrechts beschränkte einfache Recht ein, das ausgewählte Werk im Rahmen der unter
→ http://www.econstor.eu/dspace/Nutzungsbedingungen nachzulesenden vollständigen Nutzungsbedingungen zu vervielfältigen, mit denen die Nutzerin/der Nutzer sich durch die erste Nutzung einverstanden erklärt.
Terms of use:
The ZBW grants you, the user, the non-exclusive right to use the selected work free of charge, territorially unrestricted and within the time limit of the term of the property rights according to the terms specified at
→ http://www.econstor.eu/dspace/Nutzungsbedingungen By the first use of the selected work the user agrees and declares to comply with these terms of use.
zbw
Leibniz-Informationszentrum Wirtschaft Leibniz Information Centre for EconomicsStreitberger, Werner; Eymann, Torsten; Zini, Floriano; Schnizler, Björn; Vo, Hong Tuan Kiet
Working Paper
Simulator Development - Annual Report
Year 3
Bayreuth reports on information systems management, No. 26
Provided in cooperation with:
Universität Bayreuth
Suggested citation: Streitberger, Werner; Eymann, Torsten; Zini, Floriano; Schnizler, Björn; Vo, Hong Tuan Kiet (2007) : Simulator Development - Annual Report Year 3, Bayreuth reports on information systems management, No. 26, urn:nbn:de:bvb:703-opus-3709 , http:// hdl.handle.net/10419/52628
Bayreuther Arbeitspapiere zur Wirtschaftsinformatik
Information Systems Management
Bayreuth Reports on Information Systems Management
2007
Werner Streitberger, Torsten Eymann (University of Bayreuth), Floriano Zini (IRST - Fondazione Bruno Kessler, Trento), Björn Schnizler, Hong Tuan Kiet Vo (University of Karlsruhe)
Simulator Development - Annual Report Year 3
Die Arbeitspapiere des Lehrstuhls für Wirtschaftsinformatik dienen der Darstellung vorläufiger Ergebnisse, die i. d. R. noch für spätere Veröffentlichungen überarbeitet werden. Die Autoren sind deshalb für kritische Hinweise dankbar.
The Bayreuth Reports on Information Systems Management comprise preliminary results which will usually be revised for subsequent publications. Critical comments would be appreciated by the authors.
Alle Rechte vorbehalten. Insbesondere die der Übersetzung, des Nachdruckes, des Vortrags, der Entnahme von Abbildungen und Tabellen – auch bei nur auszugsweiser Verwertung.
All rights reserved. No part of this report may be reproduced by any means, or translated.
Authors: Information Systems and Management Working Paper Series
Edited by:
Prof. Dr. Torsten Eymann
Managing Assistant and Contact:
Raimund Matros Universität Bayreuth
Lehrstuhl für Wirtschaftsinformatik (BWL VII) Prof. Dr. Torsten Eymann
Universitätsstrasse 30 95447 Bayreuth Germany
Email: [email protected] ISSN
Werner Streitberger, Torsten Eymann (University of Bayreuth), Floriano Zini (IRST - Fondazione Bruno Kessler, Trento), Björn Schnizler, Hong Tuan Kiet Vo (University of Karlsruhe)
D2.3
Annual Report of WP2
Contractual Date of Delivery to the CEC:31.08.2007
Actual Date of Delivery to the CEC:24.09.2007
Author(s):Werner Streitberger (Universit¨at Bayreuth), Torsten Eymann (Universit¨at Bayreuth), Floriano Zini (IRST - Fondazione Bruno Kessler, Trento), Bj¨orn Schnizler (Universit¨at
Karlsruhe), Hong Tuan Kiet Vo (Universit¨at Karlsruhe)
Workpackage:WP2-Simulation
Est. person months:16
Security:public
Nature:final
Version:1.0
Total number of pages:49
Abstract:
This document describes the activities performed inWP2 - Simulationin the third and final year of the CATNETS project. In particular, it focuses on WP2’s main task namely,Simulation of application layer networks and refinement.
Keywords (optional):
CATNETS Consortium
This document is part of a research project partially funded by the IST Programme of the Commission of the Eu-ropean Communities as project number IST-FP6-003769. The partners in this project are: LS Wirtschaftsinformatik (BWL VII) / University of Bayreuth (coordinator, Germany), Arquitectura de Computadors / Universitat Politecnica de Catalunya (Spain), Information Management and Systems / University of Karlsruhe (TH) (Germany), Dipartimento di Economia / Universit`a delle Marche Ancona (Italy), School of Computer Science and the Welsh eScience Centre / University of Cardiff (United Kingdom), Automated Reasoning Systems Division / IRST - Fondazione Bruno Kessler Trento (Italy) / University of Mannheim (Germany).
University of Bayreuth
LS Wirtschaftsinformatik (BWL VII) 95440 Bayreuth
Germany
Tel: +49 921 55-2807, Fax: +49 921 55-2816 Contactperson: Torsten Eymann
E-mail: [email protected]
Universitat Politecnica de Catalunya
Arquitectura de Computadors Jordi Girona, 1-3
08034 Barcelona Spain
Tel: +34 93 4016882, Fax: +34 93 4017055 Contactperson: Felix Freitag
E-mail: [email protected]
University of Karlsruhe
Institute for Information Management and Systems Englerstr. 14
76131 Karlsruhe Germany
Tel: +49 721 608 8370, Fax: +49 721 608 8399 Contactperson: Daniel Veit
E-mail: [email protected]
Universit`a delle Marche Ancona
Dipartimento di Economia Piazzale Martelli 8 60121 Ancona Italy
Tel: 39-071- 220.7088 , Fax: +39-071- 220.7102 Contactperson: Mauro Gallegati
E-mail: [email protected]
University of Cardiff
School of Computer Science and the Welsh eScience Centre University of Caradiff, Wales
Cardiff CF24 3AA, UK United Kingdom
Tel: +44 (0)2920 875542, Fax: +44 (0)2920 874598 Contactperson: Omer F. Rana
E-mail: [email protected]
IRST - Fondazione Bruno Kessler Trento
Via Sommarive, 18 38100 Povo - Trento Italy
Tel: +39 0461 314 314, Fax: +39 0461 302 040 Contactperson: Floriano Zini
E-mail: [email protected]
University of Mannheim
Chair of E-Business and E-Government L 9, 1-2
68131 Mannheim Germany
Tel: +49 621 / 181-3321, Fax: +49 621 / 181-3310 E-mail: [email protected]
Version Date Author Changes 0.1 20.05.07 Werner Streitberger Draft structure
0.2 03.07.07 Floriano Zini Written introduction and added draft material to other sections
0.3 04.07.07 Floriano Zini Completed sections on automated scenario generator and infrastructure
0.4 10.07.07 Floriano Zini Added draft material to section on user guide 0.4.1 12.07.07 Floriano Zini Minor refinements
0.5 31.07.07 Bjoern Schnizler, Werner Streitberger
Description of the parameters for the auctioneers and the catallactic market
0.5.1 31.07.07 Floriano Zini Re-alignment with version 0.4.1 0.6 08.08.07 Floriano Zini Updated user guide.
0.7 30.08.07 Werner Streitberger Flooding performance added. 0.8 06.09.07 Werner Streitberger Chapter 4 added.
Contents
1 Introduction 3
2 Simulator refinement 6
2.1 Automated scenario generator . . . 6
2.1.1 Extensions . . . 6
2.1.2 How to generate a scenario . . . 10
2.2 Infrastructure . . . 10
2.2.1 Message delivery failure . . . 10
2.2.2 Link-load-dependent message latency . . . 11
2.2.3 Event-driven time model . . . 11
2.3 Centralised market . . . 12
2.4 Catallactic market . . . 13
2.4.1 Configuration of the Catallactic market . . . 13
2.4.2 Market Property Generator . . . 16
2.4.3 Service and Resource Discovery . . . 18
2.4.4 Configuration of the catallactic strategy and learning algorithm . . 21
2.4.5 Simplified Catallactic strategy . . . 23
2.5 Metrics . . . 23
3 Guide to conducting simulations 34 3.1 Installation and Running . . . 34
3.1.1 Software Dependencies . . . 34
3.1.2 CATNETS manual scenario generator . . . 35
3.1.3 CATNETS automated scenario generator . . . 35
3.1.4 CATNETS simulator . . . 36
3.2 CATNETS simulator parameter file . . . 37
3.2.1 General Parameters . . . 37
3.2.2 Central Market Parameters . . . 38
3.2.3 Market Parameters . . . 40
3.2.4 Negotiation Parameters . . . 41
3.2.5 Other parameters . . . 42
3.3 Simulation output . . . 42
4 Conclusions 43
4.1 Achieved results . . . 43 4.2 Current Limitations . . . 44 4.3 Future Extensions . . . 45
Chapter 1
Introduction
The objective ofWP2 - Simulationof the CATNETS project was to identify the required features of the CATNETS simulator, to develop it, and to incorporate the centralised and catallactic service/resource market specifications fromWP1: Theoretical and Computa-tional Basis. The simulator is to be used for controlled executions of Application Layer Network (ALN) scenarios. Results of executions are the basis of performance evaluation and comparison of the catallactic and centralised allocation mechanisms performed by WP4 - Evaluation.
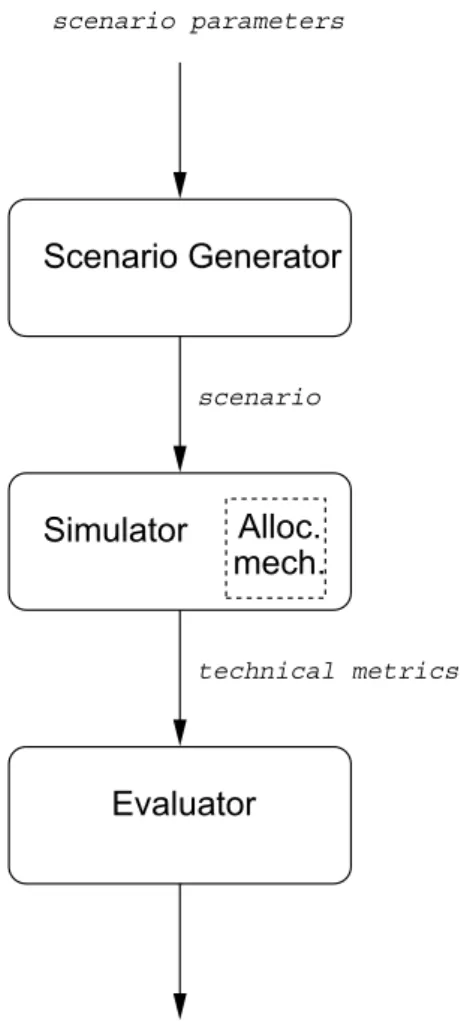
The simulator is a component of the high level workflow depicted in Figure 1.1, which measures technical and economic metrics which the evaluation component uses for com-putation of several indicators. The components acting in the workflow are:
Scenario Generator. This component takes a set of scenario parameters as an input and produces a scenario to be simulated as an output.
Simulator. It takes a scenario as an input and executes it by using a service and resource allocation approach. The output of a simulation is a set of technical and economic metrics as described in Deliverable D4.1 [WP405].
Evaluator. This component takes a set of technical and economic metrics as input and, as described in Deliverable D4.1 [WP405], calculates an economical performance indicator for the allocation mechanism under observation.
The description of the components above is mainly given in Deliverables D2.2 [WP206] and D4.2 [WP406] produced in project year 2. This deliverable focuses on the activities performed by WP2 in the third and final year of CATNETS.
According to the work plan of the project, in year 3 WP2 was supposed to work on task Simulation of Application Layer Networks and refinement. In this document, the focus is on refinement i.e. on describing how the CATNETS simulator has been improved after the last review meeting. Detailed account on performed extensive ALN simulations
Scenario Generator Evaluator Simulator technical metrics scenario scenario parameters
ecanomical performance indicator
Alloc. mech.
Figure 1.1: Architecture for evaluation system.
and simulations of prototype-like scenarios is given in Deliverable D4.3 [WP405], which includes a comprehensive report of experiments conducted to evaluate the catallactic and centralised allocation mechanisms.
Some directions for simulator refinement were identified and listed in Deliverable D2.2 [WP206]. Others derived from reviewers’ comments and suggestions included in the CATNETS Review ReportNo 2. In summary, in project year 3 WP2 worked on the following refinement tasks.
Automated scenario generator. This tool was needed to produce large-scale scenarios to be simulated. Its implementation started in project year two and was concluded, as planned, atT0+28.
Message delivery failure. The simulator was extended by adding the possibility of mod-eling message delivery failure so that experiments could cover also more realistic scenarios were communication between ALN sites is error-prone. This task was
CHAPTER 1. INTRODUCTION 5
completed byT0+28.
Link-load-dependent message latency. Variable message latency depending on band-width currently available between ALN sites was taken into consideration. A mech-anism implementing this feature, already embedded in the base simulator Optor-Sim, was analysed, adapted and included in the CATNETS simulator. This task was completed, as planned, byT0+30.
Event-driven time model. The base simulatorOptorSimoffered two time models, one time-based and one event-driven. In the last year of the project, the event-driven time model was adopted and embedded into the CATNETS simulator. This task ended atT0+32.
Refinement of centralised mechanism. Some modifications to the implementation were done in order to increase the service/resource allocation rate when the cen-tralised allocation mechanism is adopted. This task was completed byT0+28.
Refinement of catallactic mechanism. This tasks involved some bug fixing and the im-plementation of resource co-allocation. It has been completed byT0+32.
Full implementation of metrics. At the end of project year 2, the CATNETS simulator implemented the recording of a subset of the technical metrics defined by WP4 in Deliverable D4.1 [WP405]. The implementation of the metrics framework was completed atT0+31.
The issues listed above are described in Chapter 2. In particular, Section 2.1 describes the automated scenario generator while Section 2.2 presents the enhancements to the simula-tor’s messaging system and time model. Sections 2.3 and 2.4 show the implementation refinements of the centralised and catallactic markets. Finally, Section 2.5 gives an ac-count on the full implementation of technical metrics and their semantics.
In the rest of the document, Chapter 3 is a user guide which explains how to conduct simulations and Chapter 4 summarizes the achieved results and gives directions about how the CATNETS simulator can be further extended.
Simulator refinement
2.1
Automated scenario generator
The CATNETS automated scenario generator is a tool used for the generation of scenar-ios to be given as an input to the CATNETS simulator. In Deliverable D2.2 [WP206] the requirement for this tool were identified. In this section, the focus lies on its implementa-tion.
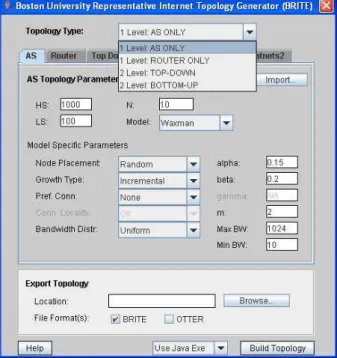
The automated generator is based on BRITE [MLMB01b] a topology generation framework which is able to generate synthetic topologies that accurately reflect many as-pects of the actual Internet topology. BRITE supports multiple generation models includ-ing models for flat AS, flat Router and hierarchical topologies. Models can be enhanced by assigning links with attributes such as bandwidth and delay.
Figure 2.1 shows how to choose the topology model in BRITE. For details about how to use BRITE the reader is referred to the BRITE user manual [MLMB01a]. BRITE was extended in order to obtain an automated scenario generator which is able to generate scenarios compliant to the ALN model presented in Deliverable D2.2 [WP206].
2.1.1
Extensions
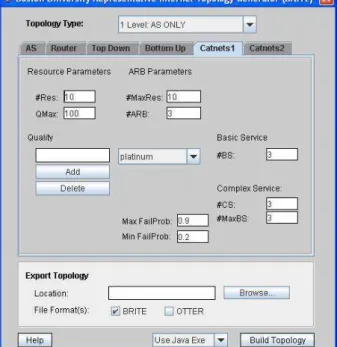
Two tabs have been added to the GUI of BRITE. They are called Catnets1 and
Catnets2and are shown in Figure 2.2 and Figure 2.3, respectively.
Catnets1 - Tab
TabCatnets1enables the configuration of complex service types, basic service types, and resource types, which equal the products available in the application layer network. The following parameters are included in the tab:
CHAPTER 2. SIMULATOR REFINEMENT 7
Figure 2.1: BRITE topology selection.
Resource parameters. The user can define #Res, the number of resource types avail-able in the scenario, and Qmax, the maximum quantity for each resource type.
#Resresources will be created, each of which having a quantity defined by a ran-dom integer in the range[1, Qmax].
ARB parameters. The user can define#M axRes, the maximum number of resources per Available Resource Bundle, and#ARB, the number of ARBs. #ARBARBs will be created, each of which including a number of resources defined by a random integer in the range[1,#M axRes].
Quality. The user can add and delete values for the quality of basic services.
Basic Service. The user can define#BS, the number of basic service types.
Complex Service. The user can define #CS, the number of complex services, and
#M axBS, the maximun number of Basic services per CS. #CS complex ser-vices will be randomly created, each of which including at most #M axBS basic services.
Failure probability. The user can define a range for the site failure probability. Every site will fail with a probability in the range[M inF ailP rop, M axF ailP rop).
Figure 2.2: Automated scenario generator: Catnets1parameter tab.
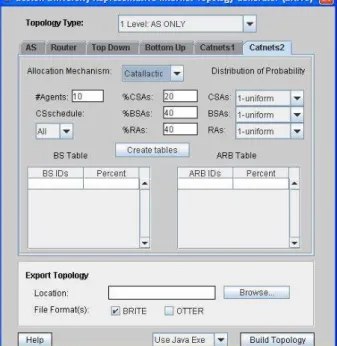
Catnets2 - Tab
This tab allows the configuration of the complex service, basic service and resource in-stances. Distributions are available which assign the instances to network nodes. The following parameters can be defined:
Allocation mechanism. The user can set the allocation mechanisms,catallacticor cen-tralised, for which the scenario is being created.
CS schedule. The user can decide if all the Complex Service Agents can run all complex services or if CSAs can run only a subset which is randomly chosen.
Agents definition and distribution. The user can define #Agents, which is the total number of agents to be placed in the ALN, the percentages of complex service agents (%CSAs), basic service agents (%BSAs) and resource agents (%RAs) and the distributions of probability used for the placement of agents in the ALN. The following distributions are available:
Uniform. The site for the agent is chosen using uniform probability distribution.
Links (dir). The site for the agent is chosen with probability proportional to the number of site links (the more the site is connected, the greater the probability it host agents).
CHAPTER 2. SIMULATOR REFINEMENT 9
Figure 2.3: Automated scenario generator: Catnets2parameter tab.
Links (inv). The site for the agent is chosen with probability inverse proportional to the number of site links. The more the site is connected, the smaller is the probability to host agents.
Dist (dir). The site for the agent is chosen with probability proportional to the dis-tance between the site and a pivot site (the more the disdis-tance, the greater the probability).
Dist (inv). The site for the agent is chosen with probability inverse proportional to the distance between the site and a pivot site (the less the distance, the greater the probability).
Percentage of BSAs providing a specific types of basic service. The user can decide the percentage of agents providing a specific type of basic service. By clicking on the Create Tables button, the predefined percentages are shown and the user can modify them.
Percentage of RAs providing a specific available resource bundles. The user can de-cide the percentage of agents providing a specific ARB. By clicking on theCreate Tables button, the predefined percentages are shown and the user can modify them.
2.1.2
How to generate a scenario
Once all the parameters have been set, a folder has to be selected for the output files. A click on the buttonBuild Topologygenerates the scenario.
Four input files for the CATNETS simulator are created:
• topology.conf: specifies the ALN topology;
• cs.conf: specifies the complex services;
• bs.conf: specifies the basic services;
• arb.conf: specifies the available resource bundles; Two additional files are created:
• <filename>.brite: specifies the topology in BRITE format;
• <filename>.odf(optional): specifies the the topology in OTTER format (see
http://www.caida.org/tools/visualization/otter/). <filename>can be specified by the user.
2.2
Infrastructure
2.2.1
Message delivery failure
The communication system of the CATNETS simulator, developed in project year 2, fea-tures both point-to-point and broadcast/multicast communication. These communication paradigms are used to implement the negotiation protocols adopted in the centralised and catallactic markets. In real networks, the delivery of point-to-point or brodcast/multicast message can fail, the possibility of simulating failure of ALN links has been added to the CATNETS simulator in project year 3.
Given the base simulator OptorSim, the failure probability was associated to ALN sites instead of links because of easier implementation:
1. Every ALN site has a given failure probability fp. This is a static parameter spec-ified in the configuration file topology.conf. The failure probability can be specified using either the manual or automated scenario generators.
CHAPTER 2. SIMULATOR REFINEMENT 11
2. The site failure probabilityfpis used by P2P mediators located in every site1:
when-ever a P2P mediator is requested to delivery a message, the message is forwarded to the recipient(s) with a probabilityp= 1−fp.
If the failed message is a point-to-point message, a single agent will not receive it. In other words the link between one sender and one receiver agent is not working. If the message is a multicast/broadcast message, the P2P will not propagate it to neighbour sites and multiple agents will not receive it. In this case, the site failure probability can be interpreted as the failure of all site’s out-links.
This implementation of message delivery failure permits the simulation of a wide range of real situations, including the real world characteristic that failure of broad-cast/multicast delivery has certainly a greater overall impact on the course of simulation than point-to-point delivery failure.
2.2.2
Link-load-dependent message latency
The CATNETS simulator has been refined by adding the possibility of simulating deliv-ery of messages dependent on the current network traffic (i.e. how much bandwidth is consumed by the messages currently being delivered) along the path between sender and receiver.
The message transfer implementation provided by OptorSim was adapted. Every mes-sage transfer between sites is handled by an instance of the classMessageTransfer. This class takes care of message transfers over the simulated ALN. It notifies other
MessageTransfer instances that it is starting (and therefore changing the network situation) and waits until the transfer is complete. If the waiting is interrupted by another
MessageTransferstart, the time left to transfer the message is recalculated based on the new network load. The MessageTransfer instance which started before waits again until the transfer is complete. When the transfer has finished, it notifies all the other currently runningMessageTransferinstances.
2.2.3
Event-driven time model
The base simulator OptorSim includes two time models to be used for simulation, one time-based and one event-driven time model. Simulation runs with both time models de-livering the same end results. In project year 3, the event-driven time model was adopted for the CATNETS simulation scenario.
In the time-based model, the simulation proceeds in real time. The simulation time equals the wall clock time to complete a simulation run by simulating all complex service
1P2P Mediators deal with management of all messages: when a message has to be sent by an agent
requests.
In the event-driven model, the simulation time is advanced to the point when the next thread should be activated. The use of the event-driven model speeds up the running of the simulation considerably, whereas the time-based model may be desirable for demon-stration or debugging purposes.
The event-driven time model is implemented by using a thread called
TimeAdvancerwhich controls the advance of time. The thread runs as a lowest prior-ity thread which only starts working in general when all other threads are sleeping. When it runs, it continually checks to see if all other threads are sleeping. If there are all threads sleeping, it finds out the thread which should be activated again. It advances time to this point and wakes up the thread.
2.3
Centralised market
In the second project year, we conceptualized a model for generating values for the bids in the central case [WP106]. The purpose of the model was to determinewhatandwhenan agent bids in the auctioneer cases. Whatdenotes the valuation and the reservation prices of agents, i.e. the maximal price which an agent is willing to pay for a service (resp. the minimum price an agent has for selling a service). Whendenotes the timing of bids, i.e. which event induces an agent to bid for a service. Both cases are different in the central and decentral scenario. As such, it was important to find concepts that are applicable for both scenarios and, thus, make the results comparable. As a result, a rather complex model was developed with the aim of imitating the co-evolutionary learning algorithms [WP106], which is used in the catallactic allocation approach.
Preliminary simulation runs evinced that the model was too complex to analyze and to identify specific effects of the implemented auction mechanisms. This originates in the fact that too many parameters of the model influenced the overall outcome. As a consequence, the reasons for particular outcomes cannot be easily identified.
In order to observe and identify specific effects of the auction mechanisms, a simpler bidding model was developed in the third project year. Valuation and reservation prices of agents are drawn from a normal distribution where mean and standard deviation can be set by means of a configuration file. As the simulation scenarios show, the simpler model allows a more profound analysis of the metrics to be observed.
Both models can be selected by means of a configuration file (see Section 3.2.2 for details).
CHAPTER 2. SIMULATOR REFINEMENT 13
2.4
Catallactic market
The components of the Catallactic strategy, presented in Deliverable D1.1 and formalized in Deliverable D2.1, were optimized during the simulation of several test scenarios in project year 3. A configuration file was introduced for defining the traded products on the Catallactic market, which enables the configuration of the catallactic market properties (see subsection 2.4.1). Besides the configuration of the Catallactic market properties, all parameters of the Catallactic strategy could be configured with configuration files, too. Subsection 2.4.2 presents a visual tool for generating the market properties which eases the creation of the market product configuration file. Improvements to the strategy are presented in the following subsections. In subsection 2.4.3, a performance analysis of the flooding algorithm is introduced. Several simulation runs evidenced that the performance of the discovery algorithm has large impact on the allocation performance in the Catal-lactic allocation approach. The performance analysis gives advice how to set the number of hops for the flooding algorithm.
A simplified Catallactic strategy implementation is presented in subsection 2.4.5. In-stead of using a iterative bargaining with several negotiation rounds, this strategy uses only one negotiation round for reaching an agreement. This helps to reduce the messag-ing complexity of the Catallactic iterative bargainmessag-ing implementation.
2.4.1
Configuration of the Catallactic market
The configuration of the Catallactic market includes the initialisation of the traded prod-ucts, its price ranges and several constraints of the Catallactic market. These constraints improve the performance of the Catallactic strategy in the examined scenarios. A detailed description of the Catallactic market configuration contains the following properties:
• Service market products: Each basic service type (BSi), which is traded on the service market, has to be configured for the Catallactic strategy. The complex service agent as a buyer and the basic service agent as a seller of the service can be configured with its initial trading price range setting a minimum and a maximum price (minPrice and maxPrice). The hard lower and upper limits are additional constraints preventing usuary bids. A seller will never sell his basic service below the given lower limit whereas a buyer will never submit a bid higher than his budget (hard upper limit). All basic services instances of the same type use the same hard lower and upper limits. The next configuration parameter assigns resource bundles to the given basic service type. This allows a basic service agent to choose between different resource bundles and buy them on the resource market. The order of the resource bundles is important, a bundle at first place has higher preference than a bundle at second place. If there is a list resource bundles, the co-allocation switch of the simulator has to be turned on. This allows the basic service agent to buy from more than one resource provider. The basic service agent tries to fulfill his
resource demand with the resource bundle specified at the first place before he selects a resource bundle of the second specified type (resource.itemids).
< BSi > .seller.minP rice=< double > < BSi > .seller.maxP rice=< double > < BSi > .buyer.minP rice=< double > < BSi > .buyer.maxP rice=< double > < BSi > .hard.lower.limit=< double > < BSi > .hard.upper.limit=< double >
< BSi > .resource.itemids=< RB1 > ... < RBn>
An example configuration is presented below. Both the complex service agents and the basic service agents start with the same initial price range. The budget of the complex service is 50, the minimum costs for the basic service (bs1) is 20. This lower bound can be seen as the production costs for a basic service provider. Both, the seller and buyer start with the same price range between 25 and 40. The specified basic type is only allowed to buy resources of productr1.
bs1.seller.minPrice = 25 bs1.seller.maxPrice = 40 bs1.buyer.minPrice = 25 bs1.buyer.maxPrice = 40 bs1.hard.lower.limit = 20 bs1.hard.upper.limit = 50 bs1.resource.itemids = r1
• Resource market products: The reason for specifying resource market products is the general demand of resources in the basic service configuration. The strategy works on product level. This means the catallactic reasoner estimates his price for a given set of traded products. For a resource bundle of the basic service config-uration, either each single resource is traded and its prices are summed up or a predefined set of resource bundles can be traded on the resource market. The Catal-lactic mechanism chooses the second option which allows a more flexible way to trade products on the resource market. We assume, there are base resources on the market. Each resource provider defines his individual set of resource bundles and price ranges and shares the intended meaning with the basic service. In the service market configuration, the basic service consumer defines which of these resource bundles can be bought to fulfill his resource demand on the resource market. A resource provider defines its resource product out of a set of basic resources and chooses an arbitrary name for the resource bundle. The resource bundle determines the base units of each resource. A resource consumer requests a multiple of these
CHAPTER 2. SIMULATOR REFINEMENT 15
resource bundle base units. Like in the service market configuration, the same ini-tial resource market price s has to be configured along with the iniini-tial minimum and maximum prices for buyers and seller, which trade this product and hard upper and lower limit prices. The lower limit price is the minimum price a resource provider is willing to sell this product and the hard upper limit price is the budget of the re-source consumer. Finally, each rere-source provider reads the list of possible rere-source products (arb.itemids) and decides according to his available resource items, if he is able to provide this resource product.
< resource product id > .resourceids=< resource1 > ... < resourcen > < resource product id > .baseunit. < resource1 >=< int >
...
< resource product id > .baseunit. < resourcen >=< int > < resource product id > .seller.minP rice=< double > < resource product id > .seller.maxP rice=< double > < resource product id > .buyer.minP rice=< double > < resource product id > .buyer.maxP rice=< double > < resource product id > .hard.lower.limit=< double > < resource product id > .hard.upper.limit =< double >
arb.itemids =< resourceproductid1 > ... < resourceproductidn>
An example of one resource product is shown below. The resource bundle consists of three base resources. Multiples of 1 ram unit, 2 cpu units and 1 storage unit are tradeable. Both, resource buyer and resource seller start with the same initial price range. The budget of the buyer is set to 50 and the seller’s minimum price is 20. There is only one product tradeable on the resource market. The resource providers check, if they are able to provide resource bundler1.
r1.resourceids = ram cpu storage r1.baseunit.ram = 1 r1.baseunit.cpu = 2 r1.baseunit.storage = 1 r1.seller.minPrice = 25 r1.seller.maxPrice = 40 r1.buyer.minPrice = 25 r1.buyer.maxPrice = 40 r1.hard.lower.limit = 20 r1.hard.upper.limit = 50 arb.itemids = r1
2.4.2
Market Property Generator
A visual tool, the market property generator (MPG), was developed to help creating this property file for the catallactic market configuration. The market property generator reads the arb.conf and bs.conf files which are created by the manual or automated scenario generator. These files are expected to be in the root directory of the market property generator.
The process of generating the market property file is divided into two steps which are illustrated by two screens respectively. Within step one, tradable products on the resource market are specified. In a second step, pricing limits are set for each basic service type and a resource product is assigned to each basic service type. An outline is given for both steps, which are illustrated by an example in the following.
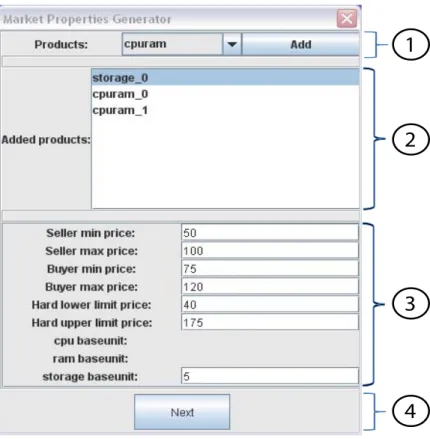
Specification of Products
Starting the MPG will result in the screen depicted in Figure 2.4. This screen is divided into four different regions. Within region 1 all possible product types are shown in a drop down box. By selecting one of these types the user is enabled to instantiate a product type by pressing theaddbutton on the right. Every instantiated product will appear in region 2. Instances of the same type are distinguishable by means of a number behind the identifier. Marking a single instance of a product type in region 2 makes it possible to customize it within region 3. Here, all product specific options are addressable. After customizing the products listed in region 2 thenextbutton in section four hast to be pressed.
Figure 2.4 shows a snapshot of MPG which uses the example data provided below. Two different product types are instantiated,storage(one instance) andcpuram (two in-stances). The screen shot shows the available option for productstorage 0.
#
# Available resource bundles #
arb cpu 30
arb ram 40 storage 80
#
# Basic services #
bs1 bs1 silver storage 10 bs2 bs2 silver cpu 20 ram 88 bs3 bs3 silver cpu 22 ram 22
CHAPTER 2. SIMULATOR REFINEMENT 17
1
2
3
4
Products and basic services
The second screen of MPG is depicted in Figure 2.5 which is divided into two regions. In region 1, every basic service type is enumerated with its specific options. Each of those options has to be changed by the user. The final option is presented in a drop down box. This box assigns a resource product to each particular type of basic service. If the box is empty, no resource product has been defined previously. Pressing thepreviousbutton allows the user to proceed on screen one. The generate button produces the catallactic market properties file.
Figure 2.5 shows the configuration for the example data set. In that specific case, there are two different products which could servebs2needs. The user needs to choose which one he wants to assign to his basic service type.
1
2
Figure 2.5: Screen two of MPG.
2.4.3
Service and Resource Discovery
Large-scale Grids will borrow some of the characteristics of today’s P2P systems in re-source participation: unreliable rere-sources and intermittent participation will constitute a significant share. This environment is likely to scale to thousands of resources shared by thousands of participants; no central, global authority will have the means and the
in-CHAPTER 2. SIMULATOR REFINEMENT 19
centive to administrate such a large collection of distributed resources. The nodes offer resource bundles as a service or application services (basic services and complex ser-vices) that other nodes (serser-vices) want to use. An issue central to such Grids is how to locate a service in the distributed system that provides it. There are various approaches to service discovery. In CATNETS, we consider a decentralized discovery mechanism based on flooding. With flooding a node that wants a particular resource or service con-tacts all neighbours in the system, which in turn contact their own neighbors until a node that provides the requested service is reached. Flooding enables resource discovery with-out directories or knowledge abwith-out the specific topology of the system, thus, offering an attractive mechanism for resource discovery in dynamically evolving systems.
In abstract terms, we assume a distributed system with N nodes where each node provides a number of resources or services. There are R different types of resources, which use the configuration explained in the previous section. Each node knows about d other nodes called neighbours. The system is modelled as directed graph G(V, E) where each node of the graph corresponds to a node of the distributed system and there is an edge from A to each node A’s neighbours. Because each edge in G may not correspond to a physical link, graph G is called the overlay network. There is no knowledge about the size of the network.
We assume an overlay network where each node has d neighbors and maintains no cache about former searches. When a node A needs a particular type of resource or ser-vice x, it always floods the network with its call-for-proposal messages. Node A sends a message querying all or a subset of its neighbors, which in turn propagate the message to their neighbors, and so on. To avoid overwhelming the network with search requests, search is limited to a maximum number of steps t (similar to the Time To Live (TTL) pa-rameter in many network protocols). In particular, the search message contains a counter field initialized to t. Any intermediate node that receives the message first decrements the counter by one. If the counter value is not 0, the node proceeds as normal; otherwise the node does not contact its neighbours. A node sends only a positive response to the inquiring node if x is found and has enough free capacity.
When the search ends, the inquiring node A will either have the contact information for resource x or nothing if all resources are used or currently down due to a failure. In the latter case, node A assumes that a node offering the resource cannot be found.
The implemented search strategy is pure flooding. With pure flooding, a node A that searches for a resource x checks its local resource and contacts all its neighbours. In turn, A’s neighbours check their local resources and propagate the search message to all their neighbours. The procedure ends when either the resource is found or a maximum of t steps is reached. The scheme, in essence, broadcasts the inquiring message.
In the CATNETS simulator, the number of hops is controlled by two parameters be-cause of different broadcast messages:
mes-sage broadcast the demand to available seller within the given hop limit. An An-nounce message informs all agents about the results of the discovery phase. The behaviour is the following: A Call-For-Proposal message receiver blocks its basic service instance or resource bundle until an announce message is received. If the number of hops is high, the requestor of e.g. a basic service gets a higher number of basic services for selection, but blocks these basic service for any other requests un-til the announce message is received. This blocking policy leads to a low allocation rate of the system for a high number of hops defined in the hop count parameter and produces a high number of messages which have to be sent over the P2P network. Addressing both problems, the number of hops should be kept fairly low to 2 or 3 hops for a network with a high density of available services or resources. If there is a low density of available services, this number should be increased. To overcome the problems of the implemented blocking policy, the discovery time of a requestor (the time to receive an answer for a call-for-proposal message) is randomized. This gives the seller agents the opportunity to respond to other call-for-proposals, when-ever they receive a reject with an announce message for the current selection. If the requestor would like to execute a long running service, there is the possibility to specify a counter of how many discovery time periods a requestor should wait receiving an answer for his call-for-proposal message. Of course, this increases the overhead time until the service execution can start.
In the example implementation below, a requestor decides to wait 10 times a ran-domized discovery timeout until he gives up his search for a basic service instance or a resource bundle.
Random rand = new Random();
_time.gtSleep((int)(_params.getDiscoveryTimeout())+ Math.round((int)(_params.getDiscoveryTimeout()) *rand.nextDouble())); while (_proposals.isEmpty()&&discoveryCounter<10) { _time.gtSleep((int)(_params.getDiscoveryTimeout())+ Math.round((int)(_params.getDiscoveryTimeout()) *rand.nextDouble())); discoveryCounter++; }
• Learning message hop count: This hop counter controls the speed of spreading plumages to other agents of the same role. The number of hops should also kept low because of the increasing number of messages which are needed to flood the network with new plumage information.
CHAPTER 2. SIMULATOR REFINEMENT 21
2.4.4
Configuration of the catallactic strategy and learning
algo-rithm
In year 3 of the project the parameters of the catallactic strategy and the learning algorithm were externalized to ease the configuration for simulation runs. Two configuration files were introduced:
• strategy.conf: This file contains a the configuration of the catallactic strategy. The dealRange property defines which policy to use for adapting the deal range after a negotiation. The valuefixedleads to not changing the deal range after a negotiation. The price ranges of the market configuration stay the same in every negotiation during the simulation run. Thestaticpolicy adapts the price range according to the priceNext parameter of the genotype. The length of the deal range stays the same as defined in the market configuration. Thefixedandstaticpolicies don’t take into account the market price estimation for changing their deal range. This feature is provided by thedynamicpolicy. This policy uses the estimated market price of the agent to create the new deal range. The estimated market price is median of the deal range, its lower and upper bounds are computed using thepriceNextparameter. Finally theringSizeparameter specifies how many prices of successful negotiations an agent should store before he forgets these achievements. Low values lead to high jumps of the markets prices whereas high values lead to very slow adaption to new market prices.
# This file configures the catallactic strategy
# modify deal range
# values: fixed, static, dynamic dealRange = dynamic
# ring size ringSize = 40
• learning.conf: This file initializes the genotype of the strategy and sets param-eters of the co-evolutionary learning algorithm. The maturityThreshold and the courterThreshold properties control the sending and receiving of plumages. In the example setting below, an agent waits 5 successful negotiations until he broadcasts his plumage, whereas he would wait for 20 incoming plumages until he selects one for crossover. The crossoverProbability defines the probability for a gene to be selected for crossover. The CATNETS strategy has 5 genes: acquisitiveness, sat-isfaction, priceStep, priceNext and weightMemory. If the crossover parameter is set to 0.20, one gene is chosen on average for crossover in every selection round. A mutation step follows the crossover and is performed after every successful ne-gotiation. The property mutationProbability defines the probability for a gene to
be mutated. The ringSize parameters stores the agreement prices of an agent in an ring array which is used for market price computation. There are two policies implemented concerning how to select a genotype for crossover. The first policy se-lects one plumage which is better than my own current plumage whereas the second policy selects the best received plumage for crossover. The property crossOverSe-lectionModelsets this selection policy. In CATNETS, all genes are float genes with values between/]0,1/[. To prevent the genes to reach 0 or 1, there is the possibility to set the maximum value the genes are allowed to reach with the properties min andmax. An important value is the size of the mutation step. This size is set by the gaussWidthparameter. A random value is drawn from a gaussian distribution with the given width and added to the selected gene. In the example, the gaussWidth parameter is set to 0.01. This results in small changes of the genotypes. The last section of the configuration file controls the initialisation of the genotype. There is the possibility to start the simulation environment with a randomized genotype or a fixed genotype for all agents. For a detailed explanation of the genotype, we refer to Deliverable D2.2. # setup learning # send plumages maturityThreshold = 5 # receive plumages courterThreshold = 20 # crossover probability crossoverProbability = 0.20 # mutation probability mutationProbability = 0.70 # ring size ringSize = 100 # crossOverSelectionModel
# (0) select plumages which are better than my plumage # (1) select best received plumage
crossOverSelectionModel = 0
# init float gene gaussWidth = 0.01 min = 0.001
CHAPTER 2. SIMULATOR REFINEMENT 23
# setup genotype
# randomize genotype # values: yes/no
genotype.randomize = no
# if randomize == no, use this genotype genotype.acquisitiveness = 0.05
genotype.satisfaction = 0.99 genotype.priceStep = 0.5 genotype.priceNext = 0.05 genotype.weightMemory = 0.9
2.4.5
Simplified Catallactic strategy
The catallactic strategy uses bilateral bargaining, which comes along with a high number of messages to be transferred between the trading partners. To reduce this number of mes-sages, a simplified version of the Catallactic strategy was implemented. This simplified strategy uses the same discovery mechanism. The ranking of received proposals is done according to its price. Instead of starting a bilateral bargaining with the cheapest proposal, the simplified strategy accepts the proposal, if this proposal is lower than his budget. The following learning step remains the same.
2.5
Metrics
This section presents the final set of metrics implemented in the simulation environment. The metrics are measured during simulation runs and stored in several text files. Analysis scripts use these text files and compute the metrics pyramid. In detail, the files are:
• Filename: accepts.txt
Description: This file records the successfully ended negotiations (accept) for one simulation run. Each accept equals one entry in the accepts file.
Sample entries:
3725 CSA5@Site20 BSA0@Site24 accepts Negotiation0 seller 6534 CSA0@Site3 BSA0@Site5 accepts Negotiation2 buyer
Column description: time stamp in milliseconds (long), ID of the agent (String), ID of the agent (String), name of metric (String), negotiation id (String), role (String, buyer or seller which made the acceptance decision)
• Filename: basic service allocation time.txt
Description: This file lists the start and end events of basic service allocations. Both events are recorded by a complex service agent. A complex service agent measures the start event, when he issues a new basic service request. When a complex service agent receives an end of negotiation signal, he adds the end event to the basic service allocation time file. Using these start and end events, the basic service allocation time is computed as the different between the start and end event time.
Sample entries:
3000 CSA5@Site20 basic_service_allocation_time start Negotiation0
3740 CSA5@Site20 basic_service_allocation_time end Negotiation0 success
Column description: time stamp in milliseconds (long), ID of the agent (String), name of the metric (String), value (start or end entry), Negotiation ID (String), result of the negotiation (failure or success, only written for ”end” entries)
• Filename: basic service provisioning time.txt
Description: Time needed for basic service provisioning (This includes execution time and successful and failed negotiations)
Sample entry:
1178575207841 CSA6@Site9 basic_service_provisioning_time 3146 success
Column description: time stamp, name of the agent, name of the metric, time needed for allocation, failure/success
• Filename: BS R Mapping.txt
Description: Mapping of service market negotiation to resource market negotiations Sample entry:
1178575203777 BSA1@Site9 BS_R_Mapping Negotiation0 Negotiation1
Column description: time stamp, name of the agent, name of the metric, negotiation id of the service market negotiation, list of negotiation ids of the related resource negotiations
• Filename: catallactic initial price range.txt Description: Initial price range of agent Sample entry:
CHAPTER 2. SIMULATOR REFINEMENT 25 1178575383665 CSA0@Site0Buyer catallactic_initial_price_range bs1 104.41305177623482 134.41305177623482 1178575383685 CSA19@Site25Buyer catallactic_initial_price_range bs1 93.78254079037917 123.78254079037917 1178575383755 RA0@Site0Seller catallactic_initial_price_range r1 112.4561961146844 142.45619611468442
Column description: time stamp, name of the agent and role (Buyer and seller), name of the metric, type of the requested service, initial lower limit, initial upper limit
Note: Only used in the catallactic approach
• Filename: catallactic strategy BSA buyer.txt, catallactic strategy BSA seller.txt, catallactic strategy CSA.txt, catallactic strategy RA.txt
Description: Genotype, prices and internal status values of the strategy Sample en-try: 1178575229131 CSA9@Site12 catallactic_strategy_CSA Negotiation59 0.10000000149011612 0.6000000238418579 0.30000001192092896 0.9990000128746033 0.5 0.0 0 bs1 101.09558068467088 111.14513166071382 96.14513166071382 126.14513166071382
Column description: time stamp, name of the agent, name of the metric, negotia-tion id, acquisitiveness, price step, price next, satisfacnegotia-tion, weight memory, average profit, learning generation, product id, price, estimated market price, lower limit, upper limit
Note: Only used in the catallactic approach
• Filename: cfps.txt
Description: Number of received call-for-proposal messages for each seller agent. Sample entry:
1178575208583 RA0@Site15 Seller cfps 5123
Column description: time stamp, name of the agent, role, name of the metric, num-ber of call-for-proposal messages received
Note: Only used in the catallactic approach
• Filename: cfps sent.txt
Description: Sent call-for-proposal messages, one entry for each call-for-proposal message sent
1178488801492 CSA15@Site20 cfps_sent Negotiation0 1
Column description: time stamp, name of the agent, name of the metric, name of the negotiation id, number (not used)
Note: Only used in the catallactic approach
• Filename: complex service allocation rate.txt
Description: Allocation rate for each complex service Sample entry:
1178498801492 CSA1@Site1 complex_service_agent_allocation_rate 0.10183299389002037
Column description: time stamp, name of the complex service, name of the metric, allocation rate
• Filename: complex service provisioning time.txt
Description: Sum of basic service provisioning times; This includes successful and failed allocations.
Sample entry:
1178488805241 CSA10@Site13 complex_service_provisioning_time 2749 failure
Column description: time stamp, name of the agent, name of the metric, complex service provisioning time, failure/success
• Filename: CS BS Mapping.txt
Description: Mapping of complex service request to basic service negotiation id Sample entry:
1178488803204 CSA10@Site13 CS_BS_Mapping cs1_2 Negotiation1
Column description: time stamp, name of the agent, name, name of the metric, id of the request, related basic service negotiation id
Note: The current central implementation does not support this metric
• Filename: csa demand distribution.txt
Description: The distribution of the complex service demand Sample entry:
1178488801492 CSA15@Site20 csa_demand_distribution cs1 cs1_1 1178488802492 CSA10@Site13 csa_demand_distribution cs1 cs1_2
CHAPTER 2. SIMULATOR REFINEMENT 27
Column description: time stamp, name of the agent, name of the metric, type of the requested complex service, id of the complex service request
• Filename: distance.txt
Description: The distance between the seller and buyer Sample entry:
1178488803219 CSA10@Site13 BSA0@Site23 distance 2 Negotiation1
Column description: time stamp, name of the buyer agent, name of the seller agent, name of the metric, distance, negotiation id
• Filename: latency.txt
Description: Latency between two negotiation partners Sample entry:
1178488804211 CSA14@Site17 BSA0@Site28 latency 31 Negotiation3
Column description: time stamp, name of the buyer agent, name of the seller agent, metric name, latency, negotiation id
• Filename: market price resource central.txt
Description: Market prices for resources on the resource market Sample entry:
1178748042878 RMAA0@CentralAuctioneerSite
market_price_resource_central r1 7.692018032073975
Column description: time stamp, site, name of the metric, resource type, price Note: Only used in the central case
• Filename: market price service central.txt
Description: Market prices for services on the service market Sample entry:
1178748022048 SMAA0@CentralAuctioneerSite
market_price_service_central bs1 4.70427463424487
Column description: time stamp, site, name of the metric, service type, price Note: Only used in the central case
• Filename: negotiation messages.txt
Description: Negotiation messages sent for an accept or reject Sample entry:
1178488802297 BSA0@Site9 negotiation_messages service reject Negotiation0 15
1178488803219 BSA0@Site23 negotiation_messages service accept Negotiation1 5
Column description: time stamp, name of the agent which write the metric, name of metric, market, result of negotiation, negotiation id, number of messages
Note: Only used in the catallactic approach
• Filename: rejects.txt
Description: List of rejects and the role which rejected Sample entry:
1178488802297 CSA15@Site20 BSA0@Site9 rejects Negotiation0 buyer
Column description: time stamp, name of the buyer agent, name of the seller agent, name of the metric, negotiation id, role which rejected
Note: Only used in the catallactic approach
• Filename: resource allocation time.txt
Description: The resource provisioning time (includes the execution time) Sample entry:
1178488803219 BSA0@Site23 resource_allocation_time start Negotiation0
1178488804195 BSA0@Site23 resource_allocation_time end Negotiation0 success
Column description: time stamp, name of the writing agent, name of the metric, event type (start or end), negotiation id, result of the negotiation (only written for ”‘end”’ events)
• Filename: resource buyer bid central.txt
Description: Bid of a basic service agent on the resource market Sample entry:
36533 Site14 BSA0@Site3 resource_buyer_bid_central 13.169972617048721 r1
Column description: time stamp, receiver site (auctioneer), bidding agent, name of the metric, valuation (highest price to pay), resource id
CHAPTER 2. SIMULATOR REFINEMENT 29
• Filename: resource seller bid central.txt
Description: Bid of a resource service agent on the resource market Sample entry:
11126 Site14 RA0@Site15 resource_seller_bid_central 3.0790178353823725 r1
Column description: time stamp, receiver site (auctioneer), bidding agent, name of the metric, reservation price (minimum price to trade), resource id
Note: Only used in the central case
• Filename: resource usage.txt
Description: The resource usage, one line per ”‘start”’ and ”‘end”’ event. Sample entry:
1178488804294 RA0@Site28 resource_usage start Negotiation2 {r1=1}
1178488805282 RA0@Site28 resource_usage end Negotiation2 {r1=1}
Column description: time stamp, name of the writing agent, name of the metric, event type (start or end), negotiation id, the resource bundle which was used
• Filename: service buyer bid central.txt
Description: Bid of a complex service agent on the service market Sample entry:
17615 Site14 CSA7@Site23 service_buyer_bid_central 8.995795995659913 bs1
Column description: time stamp, receiver site (auctioneer), bidding agent, name of the metric, valuation (highest price to pay), service id
Note: Only used in the central case
• Filename: service seller bid central.txt
Description: Bid of a basic service agent on the service market Sample entry:
11136 Site14 BSA0@Site29 service_seller_bid_central 14.11408399533697 bs1
Column description: time stamp, receiver site (auctioneer), bidding agent, name of the metric, reservation price (minimum price to trade), service id Note: Only used in the central case
• Filename: service usage.txt
Description: The service usage, one line for each ”‘start”’ and ”‘end”’ event Sample entry:
1178488804195 CSA10@Site13 BSA0@Site23 service_usage start Negotiation1 1
1178488805256 CSA10@Site13 BSA0@Site23 service_usage end Negotiation1
Column description: time stamp, name of the buyer, name of the seller, name of the metric, event type (Start or end), negotiation id, an integer value (deprecated)
• Filename: simulation time.txt
Description: The time needed for simulation Sample entry:
0 NoSite simulation_time start 0
10003325 NoSite simulation_time end 10003325
Column description: time, site, name of metric, event type, start/end time
• Filename: successful CS request.txt
Description: Successful complex service requests, one line for each complex ser-vice
Sample entry:
1178498801492 CSA4@Site7 successful_CS_requests 2 1178498801492 CSA0@Site0 successful_CS_requests 21
Column description: time stamp, name of the writing agent, name of the metric, successful cs requests
• Filename: total cs requests.txt
Description: Total complex service requests received by each complex service, one line for each cs
Sample entry:
1178498801492 CSA4@Site7 total_CS_requests 465 1178498801492 CSA0@Site0 total_CS_requests 507
Column description: time stamp, name of the writing agent, name of the metric, number of cs requests
• Filename: trade resource central.txt
Description: Maps basic service agents and resource service agents that trade Sample entry:
CHAPTER 2. SIMULATOR REFINEMENT 31
1179784806500 Negotiation29 trade_resource_central Negotiation0
Column description: time stamp, negotiation Id buyer (basic service), name of the metric, negotiation Id seller (resource service)
• Filename: trade service central.txt
Description: Maps complex service agents and basic service agents that trade Sample entry:
1179784817625 Negotiation81 trade_service_central Negotiation88
Column description: time stamp, negotiation Id buyer (complex service), name of the metric, negotiation Id seller (basic service),
• Filename: util satisfaction buyer resource central.txt
Description: Utility metric of a basic service on the resource market Sample entry: 20983 Negotiation80 BSA0@Site9 util_satisfaction_buyer_resource_central 0 remove 21053 Negotiation108 BSA1@Site3 util_satisfaction_buyer_resource_central 0.9222974262273637 success
Column description: time stamp, negotiation Id, name of the writing agent, name of the metric, satisfaction value, remove/success (remove if the order was withdrawn due to a time out, success otherwise)
Note: Only used in the central case
• Filename: util satisfaction buyer service central.txt
Description: Utility metric of a complex service on the service market Sample entry: 23747 Negotiation117 CSA5@Site20 util_satisfaction_buyer_service_central 0.8951489201843724 success 26071 Negotiation109 CSA8@Site24 util_satisfaction_buyer_service_central 0 remove
Column description: time stamp, negotiation Id, name of the writing agent, name of the metric, satisfaction value, remove/success (remove if the order was withdrawn due to a time out, success otherwise)
• Filename: util satisfaction resource buyer decentral.txt Description: Resource buyer’s utility
Sample entry: 1178488804195 BSA0@Site23 util_satisfaction_resource_buyer_decentral Negotiation1 0.21748918596452227 1178488805317 BSA0@Site28 util_satisfaction_resource_buyer_decentral Negotiation3 0.0013210052001667583
Column description: time stamp, name of the writing agent, name of the metric, negotiation id, utility
Note: Only used in the catallactic approach
• Filename: util satisfaction resource seller decentral.txt Description: Resource seller’s utility
Sample entry: 1178488808659 RA0@Site28 util_satisfaction_resource_seller_decentral Negotiation9 0.10714285524219869 1178488810254 RA0@Site11 util_satisfaction_resource_seller_decentral Negotiation11 0.0795453827887711
Column description: time stamp, name of the writing agent, name of the metric, negotiation id, utility Note: Only used in the catallactic approach
• Filename: util satisfaction seller resource central.txt
Description: Utility metric of a resource service on the resource market Sample entry: 20983 Negotiation85 RA0@Site3 util_satisfaction_seller_resource_central 0 remove 21053 Negotiation112 RA0@Site3 util_satisfaction_seller_resource_central 0.08424893267942524 success
Column description: time stamp, negotiation Id, name of the writing agent, name of the metric, satisfaction value, remove—success (remove if the order was withdrawn due to a time out, success otherwise)
CHAPTER 2. SIMULATOR REFINEMENT 33
• Filename: util satisfaction seller service central.txt
Description: Utility metric of a basic service on the resource market Sample entry: 26071 Negotiation111 BSA0@Site3 util_satisfaction_seller_service_central 0 remove 26842 Negotiation135 CSA1@Site8 util_satisfaction_seller_service_central 0.8700211740132909 success
Column description: time stamp, negotiation Id, name of the writing agent, name of the metric, satisfaction value, remove—success (remove if the order was withdrawn due to a time out, success otherwise)
Note: Only used in the central case
• Filename: util satisfaction service buyer decentral.txt Description: Service buyer’s utility
Sample entry: 1178488804234 CSA14@Site17 util_satisfaction_service_buyer_decentral Negotiation3 0.19718347083943188 1178488807691 CSA6@Site9 util_satisfaction_service_buyer_decentral Negotiation7 0.07608043102226603
Column description: time stamp, name of the writing agent, name of the metric, negotiation id, utility
Note: Only used in the catallactic approach
• Filename: util satisfaction service seller decentral.txt Description: Service seller’s utility
Sample entry: 1178488803219 BSA0@Site23 util_satisfaction_service_seller_decentral Negotiation1 0.0 1178488804211 BSA0@Site28 util_satisfaction_service_seller_decentral Negotiation3 0.1668412999533775
Column description: time stamp, name of the writing agent, name of the metric, negotiation id, utility
Guide to conducting simulations
This chapter describes first how to install and run the CATNETS scenario generators and simulator and then how to set the various parameters of the simulation.
3.1
Installation and Running
These instructions describe how to install and run CATNETS scenario generators and the CATNETS simulator. Three ZIP files of the needed packages can be downloaded from the CATNETS web site:
http://www.catnets.org/download/
The first ZIP file, called catnets-manual-scenario-generator.zip
includes the source code, the the generated class files, and the javadoc doc-umentation of the manual scenario generator. The second ZIP file, called
catnets-automated-scenario-generator.zipincludes the source code, the generated class files, and thejavadocdocumentation of the automated scenario genera-tor. The third ZIP file, calledcatnets-simulator.zipincludes the source code, the generated class files, thejavadocdocumentation and usage examples of the simulator.
3.1.1
Software Dependencies
• Java(TM) 2 Platform Standard Edition Development Kit 5.0 or greater
• Ant: Version 1.6.5 or greater (to re-build the code after any changes or to run func-tional tests)
CHAPTER 3. GUIDE TO CONDUCTING SIMULATIONS 35
3.1.2
CATNETS manual scenario generator
Installing
1. Start by unpacking the code from the ZIP file by using an archiving package such as WinZip(do not open the file directly from the browser but save it to disk first and then open it).
2. Go down into thecatnets-manual-scenario-generatordirectory.
catnets-manual-scenario-generatoris now ready to run!
Running
• The main executable is called catnets-msg.batand can be found in the main
catnets-manual-scenario-generatordirectory.
• When runningcatnets-msgthe user must have write permission to the current directory socatnets-msgcan write output files.
• catnets-msgis run from the command line and takes zero arguments
Usage:
$ catnets-msg.bat$
• The usage of the manual scenario generator is explained in D2.1 [WP206], Section 3.
3.1.3
CATNETS automated scenario generator
Installing
1. Start by unpacking the code from the ZIP file by using an archiving package such as WinZip(do not open the file directly from the browser but save it to disk first and then open it).
2. Go down into thecatnets-automated-scenario-generatordirectory.
Running
• The main executable is called catnets-asg.batand can be found in the main
catnets-manual-scenario-generatordirectory.
• When runningcatnets-asgthe user must have write permission to the current directory socatnets-asgcan write output files.
• catnets-asgis run from the command line and takes zero arguments
Usage:
$ catnets-msg.bat$
• The usage of the automated scenario generator is explained in Section 2.1.
3.1.4
CATNETS simulator
Installing
1. Start by unpacking the code from the ZIP file by using an archiving package such as WinZip(do not open the file directly from the browser but save it to disk first and then open it).
2. Go down into thecatnets-simdirectory.
catnets-simis now ready to run!
Running
• The main executable is called catnets-sim.batand can be found in the main
catnets-simulatordirectory.
• When runningcatnets-simthe user must have write permission to the current directory socatnets-simcan write output files.
• catnets-sim is run from the command line and takes either zero or one arguments. The optional argument is the parameters file (explained in the next section), and if no file is specified the default parameters file located at
examples/parameters catnets.confis used.
Usage:
CHAPTER 3. GUIDE TO CONDUCTING SIMULATIONS 37
3.2
CATNETS simulator parameter file
The parameter file for the CATNETS simulator had already been partially described in Deliverable D2.2 [WP206]. For the sake of clarity, the full description of the parameter file is given here again.
The simulation parameters are set manually by the user in a parameters file. The default parameters file is examples/parameters catnets.conf. Following is an explanation of each parameter.
3.2.1
General Parameters
aln.topology.file - The configuration file to describe the ALN topology.
aln.bs.file - The configuration file to describe the basic services.
aln.arb.file - The configuration file to describe the available resource bundles.
cs.configuration.file - The configuration file to describe the complex services.
number.complexservices - The number of CSs submitted during the simulation run.
users - Determines the pattern in which ALN users submit CSs to the Complex Service Dispatcher. Options:
1. Simple: submit CSs at regular intervals until all CSs have been submitted. The interval is set by thecs.delayparameter (below).
2. Random: submit CSs at intervals which are uniformly random between zero and twice thecs.delay.
policy - Determines the scheduling policy of the Complex Service Dispatcher. Options: 1. Random:CSs are scheduled randomly to any CSA that will run the CS. 2. Queue Length:schedules to the CSA with the shortest queue of waiting CSs.
If two CSAs have the same shortest queue length one of them is chosen at random.
cs.delay - The basic time interval (in milliseconds) between CSs being submitted to the ALN by the Users during simulation. The actual submission interval depends on the type of user chosen (see above).
access.pattern.generator - Determines the order in which BSs are accessed within a CS. Options:
1. SequentialAccessGenerator: CSs are accessed in the order stated in the CS configuration file.