A Growth Framework for SMME Action
Michael David van der Merwe
Dissertation presented for the degree of Doctor of Philosophy in Industrial Engineering at the Faculty of Engineering at Stellenbosch University
The financial assistance of the National Research Foundation (NRF) towards this research is hereby acknowledged. Opinions expressed and conclusions arrived at, are those of the author and are not
necessarily to be attributed to the NRF
Supervisor: Prof Sara S Grobbelaar
Co-Supervisors: Prof Cornelius SL Schutte, Mr Konrad H von Leipzig
ii
DECLARATION
By submitting this dissertation electronically, I declare that the entirety of the work contained therein is my own, original work, that I am the sole author thereof (save to the extent explicitly otherwise stated), that reproduction and publication thereof by Stellenbosch University will not infringe any third party rights and that I have not previously in its entirety or in part submitted it for obtaining any qualification.
Date: December 2017
Copyright © 2017 Stellenbosch University All rights reserved
iii
ABSTRACT
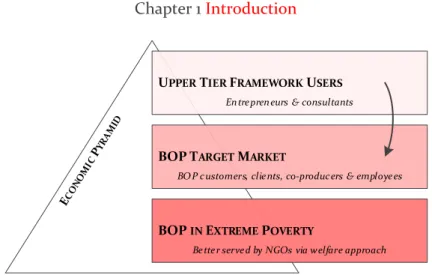
A key challenge faced by South African enterprises operating in the market made up of the poorest socio-economic segment, namely the Base of the Pyramid (BOP), pertains to the difficulty of achieving sustained profitable growth whilst simultaneously promoting sustainable poverty alleviation. This study focuses on how growth promoting factors might be incorporated into a cohesive framework to provide consultants, enterprise owners, and academics alike with a means by which to guide Small, Medium and Micro-sized Enterprises (SMMEs) operating in the BOP towards attaining higher, lasting growth and socio-economic development. Existing enterprise growth models and frameworks have been found wanting in terms of their ability to cater for the unique approach necessary for navigating through the adverse and atypical conditions prevalent at the BOP.
Grounded on an empirically backed literature base arrived at via a systematic literature review, an expansive list of antecedents to enterprise growth, i.e. growth factors, was developed. These factors, when addressed appropriately, have previously been shown to improve enterprise growth. This study therefore addressed the development of a framework to aid enterprises in simultaneously promoting for-profit growth and maximising sustainable impact in the BOP.
The systematic literature review revealed 25 growth factors, of which five were within this study’s scope in that they are business strategy related and within direct control of the enterprise. The five growth factors are: business modelling for detailed planning; following a suitable and detailed business strategy for long-term growth; utilising innovation to consistently create value and respond rapidly to market changes; implementing good marketing practices to ensure maximum value delivery to customers, and; forming strategic alliances to bolster core competencies, leverage resources, and scale operations. Furthermore, pursuing sustainable development was determined as crucial to ensuring both lasting profitability and social impact is realised.
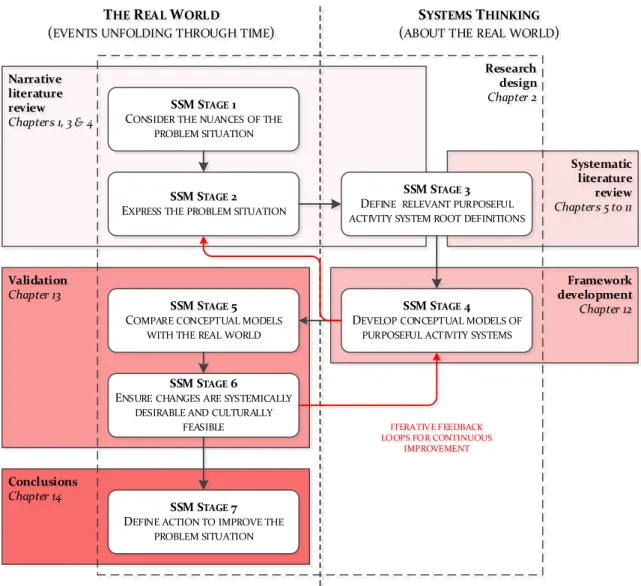
Guided by the tenets of Soft Systems Methodology (SSM), the framework was iteratively developed by synthesising the BOP requirements with conventional growth factor processes, verifying the preliminary framework, and incorporating validation findings in its final design. Framework validation entailed four mechanisms, namely conducting: a retrospective case study to determine credibility and confirmability; expert screening interviews to ensure it is efficable, efficient, effective, and ethical; a survey of 57 for-profit South African enterprises to empirically establish need, reliability, relevance, and usefulness, and; expert focus interviews to maximise usability by identifying key stakeholder requirements within the framework. All routes validated the framework for use as a consultative tool in guiding SMME owners towards improved growth at the BOP.
iv
The unique contribution is embodied in: the framework’s novelty, combining multiple fields of knowledge pertaining to success at the BOP and in traditional markets into a cohesive whole for the first time; the confirmed practical significance of the framework requirements in that it provides users with an empirically vetted procedure for increasing growth potential as evidenced by the survey data, and; the optimised usability due to the visually clear framework, the easy to use evaluation scorecard, and incorporation of key focus areas for dealing with key stakeholders.
v
UITTREKSEL
'n Sleuteluitdaging vir Suid-Afrikaanse ondernemings wat opereer in die armste sosio-ekonomiese segment, naamliks die Basis van die Piramide (BOP), is die uitdaging om volgehoue winsgewende groei te handhaaf en terselfdetyd volhoubare verligting tot armoede te bevorder. Hierdie studie fokus op hoe groeibevorderende faktore in 'n samehangende raamwerk geïnkorporeer kan word om konsultante, ondernemings-eienaars en akademici te voorsien van 'n metode om klein, medium en mikro-grootte ondernemings (KMMO's) in die BOP te bestuur vir volgehoue winsgewende groei en sosio-ekonomiese ontwikkeling. Bestaande groeimodelle en -raamwerke vir ondernemings skiet tekort in terme van die unieke benadering wat nodig is om te navigeer deur die uitdagende en atipiese toestande wat in die BOP voorkom.
Deur gebruik te maak van ‘n sistematiese literatuuroorsig, is 'n empiries-ondersteunde literatuurbasis geskep waarvandaan daar 'n uitgebreide lys van voorlopers tot ondernemingsgroei oftewel groeifaktore ontwikkel is. Hierdie faktore het voorheen getoon dat indien dit korrek oorweeg word, dit groei van die onderneming mag verbeter. Hierdie studie het dus die ontwikkeling van 'n raamwerk aangespreek om ondernemings te help om gelyktydig groei vir wins te bevorder en volhoubare impak in die BOP te maksimeer.
Die sistematiese literatuuroorsig het 25 groeifaktore geidentifiseer, waarvan vyf binne die omvang van die studie geval het, aangesien hulle besigheidstrategie verwant is en direk binne die beheer van ondernemings is. Die vyf groeifaktore is: besigheidsmodellering vir gedetailleerde beplanning; 'n geskikte en gedetailleerde besigheidstrategie vir langtermyngroei; gebruik van innovasie om konsekwent waarde te skep en vinnig te reageer op markveranderinge; die implementering van goeie bemarkingspraktyke om maksimum waarde-aflewering aan kliënte te verseker; en; vorming van strategiese alliansies om kernvaardighede te versterk, hulpbronne te hefboom, en bedrywighede op te skaal. Voorts is volhoubare ontwikkeling nagestreef as noodsaaklik om winsgewendheid te handhaaf en sosiale impak te realiseer.
Die raamwerk is iteratief ontwikkel deur van die beginsels van Sagte Stelselmetodologie (SSM) toe te pas, en die BOP vereistes te sintetiseer met konvensionele groeifaktor prosesse. Die voorlopige raamwerk is verifieer en verifikasiebevindings in die finale ontwerp ingesluit. Die raamwerk se validasie het uit vier meganismes bestaan, naamlik die uitvoer van 'n terugwerkende gevallestudie om geloofwaardigheid en bevestigbaarheid te bepaal; onderhoude met deskundiges om te verseker dat die raamwerk doeltreffend, effektief en eties is; 'n meningsopname van 57 Suid-Afrikaanse ondernemings om empiries behoefte, betroubaarheid, relevansie en bruikbaarheid te vestig, en; laastens kundige fokusonderhoude om bruikbaarheid te optimeer deur sleutelbelanghebbendes se vereistes binne die
vi
raamwerk te identifiseer. Al 4 meganismes valideer die raamwerk vir gebruik as 'n konsultasiemiddel om KMMO-eienaars te lei tot beter groei in die BOP.
Die unieke bydraes is gevestig in: die raamwerk se nuutheid, die kombinasie, vir die eerste keer in 'n samehangende geheel, van verskeie kennisvelde met betrekking tot sukses by die BOP en in konvensionele markte; die bevestigde praktiese betekenis van die raamwerkvereistes, omdat dit gebruikers 'n empiries vasgestelde prosedure bied (soos vasgestel deur die opname) om groei potensiaal te verhoog, en; laastens, die optimale bruikbaarheid as gevolg van die visueel bruikbare raamwerk, die maklik om te gebruik evalueringskaart, en die inlywing van sleutelfokusareas vir die hantering van sleutelbelanghebbendes.
vii
ACKNOWLEDGEMENTS
“Not to us, Lord, not to us but to your name be the glory, because of your love and faithfulness.”
Psalm 115 v 1 NIV
I would like to extend my sincerest gratitude to the following people for their time, effort, and relentless support which not only made this study possible and meaningful, but also enjoyable:
• Prof SS Grobbelaar, I cannot even begin to describe the value of your input in only a paragraph. The speed of your valuable responses, the level of detail and thoroughness with which you attend to every students’ needs and my own, the hours and hours of useful and motivating discussions, and your unswerving kindness and professionalism have made these last two years enjoyable and immensely productive. Thank you for always going the extra mile for me • Prof CSL Schutte, it is said that a true leader is one that knows the way, goes the way, and
shows the way. When I have been tempted to settle for less or give up altogether, your exemplary way of effectively juggling the difficulties of life whilst living it fully has motivated me to press on until the end. Thank you for leading by example, for imparting on me an unyielding yet optimistic drive for perfection to bring out my best
• Mr KH von Leipzig, without your keen practical knowledge and captivating way of guiding foolhardy students like myself through their muddled thought processes and thus translating vision into reality, this study would never have been initiated or come to much effect. Thank you for the precious gift of your time, always maintaining your open-door policy and being there for me through the highs and lows of the last four years, it means so much to me
• Prof E Lutters, our series of in-depth discussions tore apart the misconceptions and weaknesses of my study, but you also provided the glue and instructions for putting it back together so that it ended up being significantly more valuable than before. Thank you for your critical eye and valuable, holistic guidance
• Ingé, if it weren’t for you, the beautiful, smiling girl from industrial engineering, I would have had no hidden agendas that would have given me reason to continue with postgraduate studies in the first place. With time, I have come to appreciate their value, but you still remain the most precious person in my life, and getting to know you has helped me learn so much more than any degree ever could. Thank you for four years of being my best friend
• Mom, Dad, Karen, Sarah, Emily, and Sam, your love in all its various forms has come to mean so much more to me. From midnight video calls while I’m burning the midnight oil as I did so often and good morning messages to motivate me to get into gear, to the endless supply of cookies sent from home, you made it all possible, for which I am eternally grateful
viii
CONTENTS
DECLARATION ... II ABSTRACT ... III UITTREKSEL ... V ACKNOWLEDGEMENTS... VII LIST OF TABLES ... XXII LIST OF FIGURES ... XXV LIST OF ACRONYMS AND ABBREVIATIONS ...XXIXINTRODUCTION ... 1
Introduction ...2
Research opportunity ...2
Historical backdrop ... 3
Development of the BOP approach ... 3
Poverty ... 8
Poverty alleviation ... 10
SMMEs ... 12
Enterprise growth ... 16
Arriving at a working definition of social enterprises ... 20
Research gap ... 22
Concise problem statement and formulation of aim ... 23
Problem statement ...23
Aim ...23
Demarcating the field ... 24
Main research question ... 24
Research sub-questions ... 24
Research scope and nature ... 25
Chapter outline ... 28
Conclusion ... 30
ix
Introduction ... 34
Research methodology ... 34
Stages 1 and 2 – Expression ... 36
Stage 3 – Root definitions of relevant systems ... 36
Stage 4 – Making and testing conceptual models...37
Stages 5 and 6 – Validating the conceptual models ...37
Stage 7 – Defining action to improve ...37
Measures of performance ... 38 Reconciliation of SSM concepts ... 38 Ethical implications...39 Research method ...39 Research design ... 39 Methods of analysis ... 40 Conclusion ... 41
BASE OF THE PYRAMID MARKET ... 43
Introduction ... 44
BOP definition ... 44
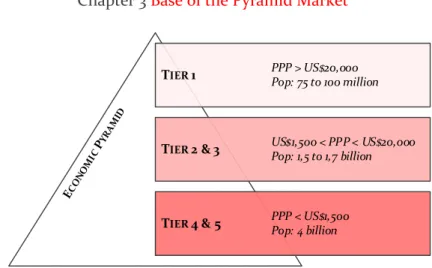
The South African BOP ...45
Economic pyramid breakdown ... 45
Market segmentation ... 46
Determinants of poverty ... 49
International best practices ... 56
Consumption at the BOP ... 56
Expenditure in South African BOP households ... 57
Cash flow in the BOP ... 57
Revenues, costs, and scale in urban and rural BOP markets ... 58
Critical dimensions of the BOP ... 60
Impediments to enterprise action at the BOP ... 61
Economic impediments ... 62
x
Political impediments ... 63
Governance impediments ... 63
Cultural impediments ... 63
Conclusion ... 64
SMALL, MEDIUM AND MICRO-SIZED ENTERPRISES AND SOCIAL ENTREPRENEURSHIP ... 66
Introduction ... 67
The SMME sector ... 67
SMME formal definition ... 69
Suitability of SMMEs for poverty alleviation ... 70
Pervasiveness ... 71
Job creation capacity ... 71
Contribution to economic development ... 72
Economic flexibility ... 72
Resilience ...73
Skill development ...73
Socio-economic transformation capacity ...73
The importance of entrepreneurship ... 73
The different forms of SMMEs ... 74
Entrepreneurship defined ... 75
The role of social entrepreneurship... 76
Social entrepreneurship defined ... 76
Social versus commercial entrepreneurs ... 77
Boundaries of social entrepreneurship ... 79
For-profit versus not-for-profit ... 80
Root definition of the SMME ... 81
Conclusion ... 82
ENTERPRISE GROWTH ... 85
Introduction ... 86
xi
High growth enterprises introduced ... 87
Measuring high growth ... 87
Toward the factors affecting high growth ... 88
Method of determining high growth factors ... 89
Systematically compile a comprehensive literature base ... 90
Rank importance of literary works ... 91
Extract key factors from highest ranked literary works ... 93
Organise key factors into logical groupings ... 94
Factors promoting high growth ... 95
Founder attributes ... 95
Enterprise attributes ... 103
Business practice factors ... 117
Human resource factors ... 128
Key considerations for a BOP context ... 131
Filtering factors by scope ... 131
Hierarchical grouping of and rationale for BOP considerations ... 134
The importance of sustainable development at the BOP ... 139
Conclusion ... 140
BUSINESS MODELLING ... 142
Introduction ... 143
Importance of business models ... 143
The functions of a business model ... 143
The goal of a business model ... 144
Business model definition ... 144
Osterwalder’s business model ontology ... 146
The business model canvas ... 147
Customer segments ... 148
Value propositions ... 149
Channels ... 150
xii Revenue streams ... 151 Key resources ... 152 Key activities ... 153 Key partnerships ... 154 Cost structure ... 155
Critique of the business model canvas ... 156
The BOP business model canvas ... 156
Customer segments ... 157 Value propositions ... 157 Channels ... 158 Customer relationships ... 160 Revenue streams ... 161 Key resources ... 161 Key activities ... 162 Key partnerships ... 162 Cost structure ... 166 Sustainability ... 167
Root definition of the business model ... 167
Conclusion ... 169
SUSTAINABLE DEVELOPMENT ... 170
Introduction ... 171
Sustainable development ... 171
The social pillar ... 173
The environmental pillar ... 175
The economic pillar ... 178
Root definition of sustainable development ... 179
Conclusion ... 180
BUSINESS STRATEGY ... 181
Introduction ... 182
xiii
Blue Ocean Strategy definition ... 184
Value innovation relationship ... 185
The strategy canvas ... 185
The four actions framework ... 188
The six principles of blue ocean strategy ... 190
Principle 1 – Reconstruct market boundaries ... 190
Principle 2 – Focus on the big picture, not the numbers ... 193
Principle 3 – Reach beyond existing demand ... 194
Principle 4 – Get the strategic sequence right ... 196
Principle 5 – Overcome key organisational hurdles ... 204
Principle 6 – Build execution into strategy ... 205
Root definition of business strategy ... 208
Conclusion ... 209
INNOVATION ... 210
Introduction ... 211
The importance of innovation ... 211
SMMEs as vehicles for innovation ... 213
Types of innovative enterprises ... 214
Towards a definition of innovation ... 216
Types of innovation ... 217
The 4Ps of innovation space ... 217
Managerial lenses for looking at innovation ... 218
The innovation process ... 225
The innovation search space ... 226
Sources of innovation ... 226
Exploration versus exploitation ... 228
Search tools and mechanisms ... 229
The search space ... 230
Innovation strategies suitable for the BOP ... 231
xiv Value innovation ... 234 Disruptive innovation ... 235 Bottom-up innovation ... 237 Open innovation ... 239 Reverse innovation... 242 Inclusive innovation ... 244 BOP innovation ... 246
A summary of innovation strategies at the BOP... 248
Arriving at the innovative enterprise ... 249
Components of the innovative organisation ... 249
Practical resource management tips for innovation managers ... 250
Innovations promoting diffusion and adoption ... 251
Root definition of innovation ... 253
Conclusion ... 255
MARKETING ... 256
Introduction ... 257
Marketing defined ... 257
The marketing environment ... 258
A holistic view of marketing (social marketing) ... 258
The importance of marketing ... 260
Building customer value, satisfaction, and loyalty ... 261
Needs versus wants ... 262
Maslow’s hierarchy of needs ... 263
Market targeting ... 264
Effective segmentation criteria ... 264
Market segmentation (evaluating and selecting) ... 265
BOP market segments ... 267
Branding ... 270
Marketing channels ... 271
xv
Structured exchange ... 273
Networked exchange ... 274
Pure exchange ... 274
Centralised exchange ... 274
The BOP marketing mix strategy ... 275
The 4Ps framework ...275
The 4As framework ... 278
Root definition of marketing ... 282
Conclusion ... 283
STRATEGIC ALLIANCES ... 284
Introduction ... 285
Strategic alliances background ... 285
Strategic alliance definition ... 286
Mergers, acquisitions, and alliances as forms of governance ... 287
State of the field ... 289
Alliance rationale ... 290
Process views of strategic alliances ... 291
Alliances as a journey as opposed to a destination ... 296
Decision to form an alliance ... 297
Partner assessment and selection ... 298
Ensuring strategic fit ... 299
Institutional impact on partnerships ... 302
Types of partnerships and structural preferences ... 304
Alliance design via contracts and negotiation ... 317
Alliance management ... 321
Developing networks ... 322
Cultural constructs and tensions... 324
Managing communication ... 333
Relational dynamics ... 336
xvi
Resource management ... 347
Alliance performance ... 352
Managing risk and opportunistic behaviour ... 355
Other concerns ... 365
Alliance termination and exit strategy ... 366
Root definition of strategic alliances ... 368
Conclusion ... 369
CONCEPTUAL FRAMEWORK DEVELOPMENT ... 371
Introduction ... 372
Defining concept and conceptual framework ... 373
Concept definition ... 373
Conceptual framework definition ... 373
Conceptual framework features ... 374
Framework versus model ... 375
Methods of building a conceptual framework ... 376
Conceptual framework analysis technique ... 376
The data of conceptual framework analysis ... 377
The process of conceptual framework analysis ... 377
The procedure of conceptual framework analysis ... 377
Combining SSM and the framework analysis procedure ... 379
Developing the framework ... 379
Design method for building purposeful activity systems ... 380
Conceptual models of purposeful activity systems ... 381
The high growth promoting framework for BOP targeting SMMEs ... 390
The high growth promoting BOP portfolio evaluation technique ... 392
Reconciling the framework with the evaluation technique ... 395
Framework requirements verification ... 396
Internal evaluation of the framework ... 396
Conclusion ... 397
xvii
Introduction ... 400
Various routes to validation ... 400
Retrospective case study ...403
Case study approach ... 403
Case study suitability criterion ... 404
The Jaipur Rugs case study... 404
Potential for future study ... 423
Case study conclusions ... 424
Screening interviews ... 424
The process for validation via screening interviews ... 424
Areas of expertise ... 425
Validation questions ... 426
Measures of performance ... 427
Screening interview expert feedback summary ... 427
Survey analysis...430
Constructing and conducting an effective survey ... 431
Data analysis ...433
Potential for future study ... 449
Survey conclusions ... 449
Focus interviews ... 449
The process for validation via focus interviews ... 450
Focus interview expert feedback summary ... 450
Concurrent proof of validity ... 451
Conclusion ... 451
CONCLUSIONS AND RECOMMENDATIONS ... 453
Introduction ... 454
Framework usefulness for various user archetypes ... 454
Final definition of action to improve the problem situation... 458
Potential for future research ... 460
xviii
Answering the research questions ... 462
Conclusion ...463
REFERENCES ... 465
APPENDICES ... 561
Appendix A Inflation-adjusted poverty lines ... 562
Appendix B Poverty alleviation role players ... 563
B.1 Government ... 563
B.2 Enterprise ... 564
Appendix C Government initiatives ... 568
C.1 Small Enterprise Development Agency (SEDA) ... 568
C.2 Small Enterprise Finance Agency (SEFA) ... 568
C.3 National Youth Development Agency (NYDA) ... 569
C.4 Technology Innovation Agency (TIA) ... 569
C.5 National Empowerment Fund (NEF) ... 570
C.6 Sector Education and Training Authority (SETA) ... 570
C.7 Public awareness ... 571
Appendix D Engineering systems approach ... 572
Appendix E Market segments and poverty alleviation ... 573
E.1 Living Standards Measurement for groups 6 to 10 ... 573
E.2 International best practices summary ... 574
Appendix F The entrepreneurial climate in South Africa ... 580
Appendix G Requirements, verification, and stakeholders ... 584
G.1 Preliminary requirements, verification, and stakeholders ... 585
G.2 Business model requirements, verification, and stakeholders ... 590
G.3 Sustainable development requirements, verification, and stakeholders ... 597
G.4 Business strategy requirements, verification, and stakeholders ... 599
G.5 Innovation requirements, verification, and stakeholders ... 603
G.6 Marketing requirements, verification, and stakeholders ... 612
G.7 Strategic alliance requirements, verification, and stakeholders ... 616
xix
Appendix I Literary sources ... 633
I.1 Titles, references, and ID numbers of literary sources (IWs and KIWs) ... 633
I.2 Literary source citation and linkage data ... 636
I.3 Factors addressed in each literary source ... 639
I.4 Supporting works (SWs) and factors addressed ... 642
Appendix J Modification factors for the Matthew Effect... 644
Appendix K Details related to BOS ... 645
K.1 The four ordered steps of visualising strategy elaboration ... 645
K.2 Key organisational hurdles elaboration ... 647
Appendix L Theoretical views of strategic alliances ... 651
L.1 Market power theory ... 651
L.2 Transaction costs view ... 652
L.3 Resource based view ... 653
L.4 Agency theory ... 655
L.5 Game theory ... 656
L.6 Real options theory ... 657
L.7 Resource dependence theory ... 657
L.8 Relational contract theory... 658
L.9 Organisational learning theory... 659
L.10 Social network theory ... 660
L.11 Knowledge based view ... 660
L.12 Skills based view ... 661
L.13 Dynamic capabilities view ... 661
L.14 Institutional theory ... 662
L.15 Social exchange theory ... 662
Appendix M Strategic alliance rationale ... 664
Appendix N Supply chain network relationship types and strategies ... 666
N.1 Supply chain network characteristics ... 666
N.2 Focal organisation dominance ... 667
N.3 Upstream network dominance ... 668
xx
N.5 Downstream network dominance ... 671
Appendix O Second-order alliance risks and their management ... 673
O.1 Second-order risks ... 673
O.2 Second-order risk management controls ... 674
Appendix P Questions pertaining to the high growth portfolio evaluation technique ... 676
P.1 Contextual evaluation technique questions ... 676
P.2 Business model evaluation technique questions ... 683
P.3 Sustainable development evaluation technique questions ... 690
P.4 Business strategy evaluation technique questions ... 692
P.5 Innovation evaluation technique questions ... 697
P.6 Marketing evaluation technique questions ... 708
P.7 Strategic alliance evaluation technique questions ... 713
Appendix Q Semi-structured interviews ... 730
Q.1 Document for preliminary interviews... 730
Q.2 Summary feedback of focus interviews ... 750
Appendix R Survey of best practices in South African social enterprises ... 756
R.1 Email content ... 756
R.2 Survey content ...757
Appendix S Chapter summaries ... 768
S.1 Chapter 1 – Introduction ... 768
S.2 Chapter 2 – Research design ... 768
S.3 Chapter 3 – Base of the Pyramid market ... 769
S.4 Chapter 4 – SMMEs and social entrepreneurship ... 769
S.5 Chapter 5 – Enterprise growth ... 771
S.6 Chapter 6 – Business modelling ... 772
S.7 Chapter 7 – Sustainable development ... 773
S.8 Chapter 8 – Business Strategy ... 773
S.9 Chapter 9 – Innovation ...775
S.10 Chapter 10 – Marketing ... 777
S.11 Chapter 11 – Strategic alliances ... 779
xxi
xxii
LIST OF TABLES
Table 1-1 BOP literature progression ...7 Table 1-2 Gini coefficients and the share of national consumption (Statistics S.A., 2014:13) ... 10 Table 1-3 The organisation philanthropy-commerce spectrum, based on Dees et al. (2001) ... 20 Table 1-4 Research sub-questions ... 24 Table 2-1 SSM concept elucidation ... 38 Table 3-1 LSM group 1 to 4 characteristics (SAARF, 2014:1) ... 47 Table 4-1 The stages of economic development (Porter, 2015) ... 68 Table 4-2 SMME size class breakdown (Republic of South Africa, 1996:15) ... 69 Table 4-3 Root definition components of the SMME ... 82 Table 5-1 Search phrase components ... 90 Table 5-2 Influential Work rank determining point breakdown ... 92 Table 5-3 Example of the systematic literature review evaluation process ...93 Table 5-4 Strategy and environmental moderator relationships (Zahra & Bogner, 2000:136) ... 110 Table 5-5 Growth path categories and strategy portfolios (Mishina et al., 2002) ... 119 Table 5-6 Behaviour versus outcome control (Oliver & Anderson, 1995) ... 130 Table 5-7 Human resource strategy growth promoting factors outside the study’s scope ... 132 Table 5-8 Business strategy growth promoting factors mostly within the study’s scope ... 133 Table 6-1 Definition of Osterwalder's business model ontology elements ... 146 Table 6-2 Next generation BOP strategy (Simanis & Hart, 2008; BoP Global Network, 2012) ... 163 Table 6-3 The three main phases of the partnering process ... 165 Table 6-4 Root definition components of the business model ... 168 Table 7-1 Root definition components of sustainable development ... 179 Table 8-1 Blue Ocean Strategy versus red ocean strategies (Blue Ocean Strategy, 2015) ... 183 Table 8-2 The six principles of BOS and the corresponding attenuated risks ... 190 Table 8-3 The four ordered steps of visualising strategy (Kim & Mauborgne, 2005:84) ... 193 Table 8-4 Root definition components of business strategy ... 208 Table 9-1 Size related pros and cons of innovative SMMEs (Tidd & Bessant, 2014:69) ... 213 Table 9-2 Innovation examples mapped onto the 4Ps model ... 218 Table 9-3 The influence of context on innovation management ... 225 Table 9-4 Sources of innovation ... 227 Table 9-5 The challenges and appropriate tools for innovation search ... 230 Table 9-6 Two strategic logics: conventional vs value innovation (Kim & Mauborgne, 1997a) ... 234 Table 9-7 Shifting strategic focus (Kim & Mauborgne, 1999) ... 235
xxiii
Table 9-8 Bottom-up versus top-down innovation (Science Progress, 2012) ... 237 Table 9-9 Innovation barriers SMEs vs large enterprises (Lee et al., 2010) ... 241 Table 9-10 Project-level and top-level actions for reverse innovation ... 243 Table 9-11 Factors commonly exhibited by innovative organisations ... 249 Table 9-12 Root definition components of innovation ... 254 Table 10-1 Six criteria for choosing brand elements (Kotler, Keller, Ancarani & Costabile, 2014) ... 271 Table 10-2 Root definition components of marketing ... 282 Table 11-1 Ownership decisions based on transaction cost based and resource based rationales ... 298 Table 11-2 Dynamic barriers to interorganisational learning (Larsson et al., 1998) ... 345 Table 11-3 Dynamic promoters of interorganisational learning (Larsson et al., 1998) ... 345 Table 11-4Root definition components of strategic alliances ... 368 Table 12-1 Reconciling SSM, chapter numbers, and the framework analysis phases ... 379 Table 12-2 Framework subsystem discussion ... 382 Table 12-3 The BOP portfolio evaluation technique scorecard ... 394 Table 13-1 Comparison of key BOP measures for India and South Africa ... 405 Table 13-2 Validation questions ... 426 Table 13-3 Results summary of screening interviews ... 427 Table 13-4 Measures of performance results ... 428 Table 13-5 Construct and sub-construct reliabilities ... 440 Table 13-6 General regression analyses ... 446 Table 13-7 Pointed regression analyses focusing on differential growth rates ... 447 Table 14-1 Research sub-questions and where to find their answers ... 462
Table C-1 Benefits of learnerships for the learner, employer, and industry ... 571 Table E-1 LSM groups 6 to 10 characteristics (SAARF, 2014:1) ... 573 Table E-2 China’s approaches to poverty alleviation ... 575 Table E-3 Uganda’s approaches to poverty alleviation ... 576 Table E-4 Vietnam’s approaches to poverty alleviation ... 578 Table F-1 Key Global Competitive Index 2014-2015 indicators (Schwab & Sala-i-Martín, 2014:341) .... 581 Table G-1 Preliminary requirements, verification, and stakeholders ... 585 Table G-2 Business model requirements, verification, and stakeholders ... 590 Table G-3 Sustainable development requirements, verification, and stakeholders ... 597 Table G-4 Business strategy requirements, verification, and stakeholders ... 599 Table G-5 Innovation requirements, verification, and stakeholders ... 603 Table G-6 Marketing requirements, verification, and stakeholders ... 612 Table G-7 Strategic alliance requirements, verification, and stakeholders ... 616
xxiv
Table H-1 Scholarly definitions of high growth ... 631 Table I-1 Titles, references, and ID numbers of literary sources (IWs and KIWs)... 633 Table I-2 Literary source citation and linkage data ... 636 Table I-3 Factors addressed in each literary source ... 639 Table I-4 Supporting works (SWs) and factors addressed ... 642 Table J-1 Modification factors for the Matthew Effect ... 644 Table N-1 Network characteristics of focal organisation dominance ... 666 Table N-2 Network characteristics of upstream network dominance ... 666 Table N-3 Network characteristics of focal organisation obedience ... 666 Table N-4 Network characteristics of downstream network dominance ... 667 Table N-5 Supply chain network strategy for focal organisation dominance ... 668 Table N-6 Supply chain network strategy for upstream network dominance ... 669 Table N-7 Supply chain network strategy for focal organisation obedience ... 670 Table N-8 Supply chain network strategy for downstream network dominance ... 671 Table P-1 Contextual evaluation technique questions ... 676 Table P-2 Business model evaluation technique questions ... 683 Table P-3 Sustainable development evaluation technique questions ... 690 Table P-4 Business strategy evaluation technique questions ... 692 Table P-5 Innovation evaluation technique questions ... 697 Table P-6 Marketing evaluation technique questions ... 708 Table P-7 Strategic alliance evaluation technique questions ... 713 Table Q-1 Recurring themes summary of the focus interviews ... 750
xxv
LIST OF FIGURES
Figure 1-1 Poverty headcounts and poverty gaps (Statistics S.A., 2014:13) ... 9 Figure 1-2 Poverty alleviation paradigms ... 11 Figure 1-3 National economic competitiveness and associated economic stage ... 15 Figure 1-4 The profit orientation spectrum, based on Alter (2007) and Volkmann et al. (2012) ... 21 Figure 1-5 Outlining the framework's intended audience... 23 Figure 2-1 The stages of SSM, adapted from Checkland and Scholes (1990:27) ... 35 Figure 2-2 Research design mapping, adapted from Mouton (2011:144) ... 40 Figure 2-3 Methods of analysis breakdown ... 41 Figure 3-1 The global economic pyramid (Hart & Prahalad, 2002) ...45 Figure 3-2 The South African economic pyramid (Eighty20, 2011) ... 46 Figure 3-3 Percentage population in LSM groups over time, adapted from Nedbank Group (2011:4) . 47 Figure 3-4 LSM population percentage breakdown (SAARF, 2014:1) ... 48 Figure 3-5 Poverty in Sub-Saharan Africa put in context (Ki-moon, 2014:10) ... 51 Figure 3-6 Estimated international BOP market by sector, adapted from Hammond et al. (2007) .... 56 Figure 3-7 South African BOP household expenditure, extracted from Statistics S.A. (2011:59) ... 57 Figure 3-8 Savings and credit from the perspective of the poor ... 58 Figure 3-9 Rural drawbacks of low price, low margin, high volume approaches (Simanis, 2012:124).. 59 Figure 4-1 SMME activity forms and propensity for attaining high growth (McIntyre, 2001:17) ... 74 Figure 4-2 The different forms of social engagement in context (Martin & Osberg, 2007:38) ... 79 Figure 5-1 Method of determining factors promoting high growth ... 89 Figure 5-2 Comparison of citation counts for Google Scholar and Web of Science ... 91 Figure 5-3 IWs ranked according to their weighted totals ... 94 Figure 5-4 Logical groupings of high growth promoting factors ... 95 Figure 5-5 Model of determinants of small enterprise growth (Davidsson, 1991:407) ... 115 Figure 5-6 Determining growth factors within the scope of the research ... 132 Figure 5-7 Key characteristic occurrence frequencies ... 134 Figure 5-8 Key factors for the BOP occurrence frequencies ... 135 Figure 6-1 Osterwalder’s business model ontology (Osterwalder, 2004) ... 147 Figure 6-2 Business model canvas components (Osterwalder & Pigneur, 2009) ... 147 Figure 6-3 Channel phases (Osterwalder & Pigneur, 2009) ... 150 Figure 6-4 Sustainable development business model canvas (Osterwalder, 2009:109) ... 157 Figure 6-5 Co-creation logic of the partnering process (Simanis & Hart, 2008) ... 165 Figure 7-1 The three pillars of sustainability ... 172
xxvi
Figure 7-2 Environmental disease burden by WHO sub region (WHO, 2011) ... 176 Figure 8-1 Blue Ocean Strategy logic versus Porter's five forces logic ... 183 Figure 8-2 The Blue Ocean strategy canvas (Kim & Mauborgne, 1997) ... 188 Figure 8-3 The four actions framework ... 189 Figure 8-4 The three tiers of noncustomers ... 195 Figure 8-5 The sequence of blue ocean strategy ... 196 Figure 8-6 The buyer utility map ... 198 Figure 8-7 The buyer experience cycle ... 198 Figure 8-8 The price corridor of the mass (Kim & Mauborgne, 2005:128) ... 201 Figure 8-9 The four organisational hurdles to strategy execution ... 204 Figure 8-10 How fair process affects people’s attitudes and behaviours ... 207 Figure 9-1 Groups of enterprises according to innovation capability (Leonard-Barton, 1998) ... 214 Figure 9-2 The 4Ps of innovation space (Tidd & Bessant, 2014:25) ... 218 Figure 9-3 Resource commitment and uncertainty in innovation (Tidd & Bessant, 2014:40) ... 219 Figure 9-4 Component versus architectural innovation, adapted from Abernathy and Utterback (1978) ... 222 Figure 9-5 The innovation life cycle (Utterback & Abernathy, 1975) ... 223 Figure 9-6 Process model of innovation ... 225 Figure 9-7 A map of innovation search space (Tidd & Bessant, 2014:286) ... 230 Figure 9-8 The Disruptive innovation model (Christensen & Raynor, 2003) ... 236 Figure 9-9 The open innovation model (Chesbrough, 2003) ... 240 Figure 10-1 Model of a simple marketing system (Kotler et al., 2014:9) ... 257 Figure 10-2 The dimensions of holistic marketing (Kotler et al., 2014:19) ... 259 Figure 10-3 Traditional versus customer-oriented organisation ... 262 Figure 10-4 Maslow’s hierarchy of needs ... 263 Figure 10-5 Possible levels of segmentation (Kotler et al., 2014:233) ... 265 Figure 10-6 The four P components of marketing mix expanded (Kotler et al., 2014:25) ... 275 Figure 11-1 The scope of strategic alliances, adapted from Kale and Singh (2009) ... 288 Figure 11-2 Life cycle models (De Rond, 2003) ... 292 Figure 11-3 Teleological approaches (De Rond, 2003) ... 293 Figure 11-4 Dialectical tensions in alliances adapted from Bouchikhi (1998) ... 295 Figure 11-5 Integration continuum of strategic alliances, adapted from Gajda (2004) ... 296 Figure 11-6 Social enterprise inter-sectoral positioning ... 305 Figure 11-7 Collaboration dimensions ... 309 Figure 11-8 The relationship types of supply chain networks adapted from Chang et al. (2012) ... 311 Figure 11-9 Exploration versus exploitation alliance types adapted from Koza and Lewin (2000) ... 313
xxvii
Figure 11-10 Structural preferences based on predominant resource types of partner organisations, adapted from Das and Teng (2000b) ... 314 Figure 11-11 Cultural and socialisation levels, adapted from Ulijn et al. (2010) and Hofstede, Neuijen, Ohayv and Sanders (1990) ... 325 Figure 11-12 Contributing relationships for organisational success ... 337 Figure 11-13 Control modes and associated risk (Das & Teng, 2001) ... 339 Figure 11-14 Interorganisational learning strategies (Larsson et al. (1998) and Thomas (1979)) ... 344 Figure 11-15 Interorganisational learning strategy dynamics ...346 Figure 11-16 A resource based step-by-step approach to strategy analysis (Grant, 1991) ...348 Figure 11-17 Typical resources sorted according to characteristic and type (Das & Teng, 2000b) ... 350 Figure 11-18 Inter-partner resource alignment typology (Das & Teng, 2000b) ... 351 Figure 11-19 Strategic alliance orientations according to primary resources and risk types (Das & Teng, 1999) ... 359 Figure 11-20 Risk reduction via trust and control (Das & Teng, 2001) ...364 Figure 12-1 Design method portrayal ...380 Figure 12-2 The business model purposeful activity system ...384 Figure 12-3 Sustainable development purposeful activity system ... 385 Figure 12-4 The business strategy purposeful activity system ... 386 Figure 12-5 The innovation purposeful activity system ... 387 Figure 12-6 The marketing purposeful activity system ...388 Figure 12-7 The strategic alliance purposeful activity system ... 389 Figure 12-8 The high growth promoting framework for BOP targeting SMMEs ... 391 Figure 12-9 The high growth promoting BOP portfolio evaluation technique illustrated ... 392 Figure 12-10 The process of the high growth promoting BOP portfolio evaluation technique ... 393 Figure 12-11 Verification step 5 illustration ... 396 Figure 13-1 Route to validation ... 402 Figure 13-2 Jaipur Rugs entities breakdown ... 408 Figure 13-3 The Jaipur Rugs supply chain ... 409 Figure 13-4 Hypothetical strategy canvas for Jaipur Rugs ... 411 Figure 13-5 Framework application for the business modelling system ... 417 Figure 13-6 Framework application for the sustainable development system ... 418 Figure 13-7 Framework application for the business strategy system ... 419 Figure 13-8 Framework application for the innovation system ... 420 Figure 13-9 Framework application for the marketing system ... 421 Figure 13-10 Framework application for the strategic alliance system ... 422 Figure 13-11 The expert interview validation process ... 424
xxviii
Figure 13-12 Frequency of interviewees’ autonomously asserted areas of expertise ... 425 Figure 13-13 The measures of performance scale ... 427 Figure 13-14 Validating the framework with the survey ... 431 Figure 13-15 Enterprise growth rate according to SIC ... 434 Figure 13-16 SMME breakdown according to permanent and temporary employee count ... 434 Figure 13-17 Social enterprise size, growth rate, age, and consecutive years of growth breakdown ... 435 Figure 13-18 BOP role according to industry ... 435 Figure 13-19 BOP role and enterprise growth rate breakdown ...436 Figure 13-20 Value proposition clarity according to growth rate ...436 Figure 13-21 Strategic stance according to growth rate ... 437 Figure 13-22 Innovation stance according to growth rate ... 437 Figure 13-23 Consecutive years of growth according to enterprise growth rate ...438 Figure 13-24 Cronbach's alpha rules of thumb ... 440 Figure 13-25 Histogram and confidence interval components ... 441 Figure 13-26 Perceived growth impact according to growth factor and growth rate ... 442 Figure 13-27 Managerial difficulty according to growth factor and growth rate... 443 Figure 13-28 Priority level in planning according to growth factor and growth rate ... 444 Figure 13-29 Manner of implementation according to growth factor and growth rate ... 444 Figure 13-30 Correlation strength according to rho value (StatsTutor, 2017) ... 445 Figure 13-31 Focus interview discussion tool ... 450 Figure 14-1 Ideal framework users according to economic tier and sector origin ... 455 Figure 14-2 Final action to improve the problem situation ... 458 Figure 14-3 Depiction of potential for future research ... 460
Figure A-1 Inflation-adjusted poverty lines (per capita per month in Rands) (Statistics S.A., 2014) .. 562 Figure D-1 Flow of real world problem solving, adapted from Kennon (2010:21) ... 572 Figure F-1 South Africa’s Global Competitiveness Index scores (Schwab & Sala-i-Martín, 2014:340) 582
xxix
LIST OF ACRONYMS AND ABBREVIATIONS
AAK ability to absorb knowledge
AEE apt entrepreneurial experience
AEO apt entrepreneurial orientation
AFC accessing financial capital
AFS apt founding strategy
AGE apt geographic expansion
AGL apt geographic location
ALQ apt leadership qualities
AMPS All Media and Products Survey
ANOVA analysis of variance
BBBEE Broad-Based Black Economic Empowerment
BOP Base of the Pyramid
BOS blue ocean strategy
BPSN broad professional and social network BRIC Brazil, Russia, India, and China
CAGR Compound Annual Growth Rate
CATWOE clients, actors, transformation, worldview, owner, environmental constraints
CMG commitment to and motivation for growth
CPI Consumer Price Index
CRM Customer Relationship Management
CSR Corporate Social Responsibility
xxx
DTI Department of Trade and Industry
DUI doing, using, and interacting
EJV equity joint venture
EOS evolving organisational structure
FIS fostering international sales
FPL food poverty line
FPO for-profit organisation
GDP Gross Domestic Product
GHC greater human capital
GLE geographic location and expansion
GMS Growth in Market Share
HAP high acquisition propensity
HMC holistic marketing capabilities
HUL Hindustan Unilever Ltd.
IAMOT International Association for Management of Technology
ICI innovation for continuous improvement
ICT Information and Communications Technology
ILCS industry life cycle stage and market environment
IMF International Monetary Fund
IP intellectual property
IPBI incorporating performance based incentives IVMC ideal vision, mission, and communication
IW influential work
xxxi
JRF Jaipur Rugs Foundation
JRI Jaipur Rugs Incorporated
KIW key influential work
LBPL lower-bound poverty line
LLLF limited liability legal form
LOE level of education
LSA leveraging strategic alliances
LSM Living Standards Measure
MDG Millennium Development Goals
MEA minority equity alliance
MNC Multinational Corporation
MNE Multinational Enterprise
NDP National Development Plan
NFPO not-for-profit organisation
NGO Non-Governmental Organisation
NPO Non-Profit Organisation
NRF National Research Foundation
PPP Purchasing Power Parity
PR public relations
PVO Private Voluntary Organisation
R&D research and development
RBV resource based view
RIE relevant industry experience
xxxii
ROI Return on Investment
RSA reduced size and age
SAARF South African Audience Research Foundation
SABF South African Breweries Foundation
SEDA Small Enterprise Development Agency
SETA Sector Education and Training Authority
SIC Standard Industrial Classification
SME small to medium-sized enterprise
SMME small, medium and micro-sized enterprise
SSM Soft Systems Methodology
STS synergistic team size
SW supporting work
TBL triple bottom line
TCV transaction costs view
TEA total early-stage entrepreneurial activity
UBPL upper-bound poverty line
UVC unique value creation for customers
4As affordability, acceptability, availability, awareness
4Ps [of innovation space] product, process, position, paradigm 4Ps [of marketing] product, place, price, promotion
INTRODUCTION
“Globally, researchers and policymakers now agree that the highest impact in terms of growth, employment creation and contribution to the economy can be obtained by actively supporting small businesses which have successfully survived their first few years of trading and are now positioned for
growth.”
National Gazelles (2015a)
Framework development Chapter 12 Conclusions Chapter 14 Validation Chapter 13 Narrative literature review Chapters 1, 3 & 4 Systematic literature review Chapters 5 to 11 THE REAL WORLD
(EVENTSUNFOLDINGTHROUGHTIME) (ABOUTSYSTEMSTHE TREALHINKINGWORLD)
SSM STAGE 2 EXPRESSTHEPROBLEMSITUATION
SSM STAGE 7 DEFINEACTIONTOIMPROVETHE
PROBLEMSITUATION SSM STAGE 5
COMPARECONCEPTUALMODELS WITHTHEREALWORLD
SSM STAGE 3
DEFINE RELEVANTPURPOSEFUL ACTIVITYSYSTEMROOTDEFINITIONS SSM STAGE 1
CONSIDERTHENUANCESOFTHE PROBLEMSITUATION
SSM STAGE 6
ENSURECHANGESARESYSTEMICALLY DESIRABLEANDCULTURALLY
FEASIBLE
Research design Chapter 2
SSM STAGE 4
DEVELOPCONCEPTUALMODELSOF PURPOSEFULACTIVITYSYSTEMS
ITERATIVE FEEDBACK LOOPS FOR CONTINUOUS
IMPROVEMENT
RELEVANT APPENDICES
2
Introduction
To begin with, it is necessary to lay the foundations of the research so as to ensure both the usefulness and adequacy of its contribution to the greater body of knowledge. This introductory chapter identifies the opportunities that exist for further research to be conducted, and also serves to uncover the opportunities for new contributions to be made. First off, the research opportunity is therefore discussed. Following this, a succinct statement of the problem and overall aim of the study is stated, combining its three foci, namely: the base of the pyramid (BOP) population; small, medium and micro-sized enterprises (SMMEs), and; enterprise growth. Hereafter, the main research questions are formulated and a description of the scope within which the study takes place is provided. A document outline is provided at the end of the chapter.
This chapter constitutes stage one (and alludes to stage two) of the Soft Systems Methodology (SSM) approach used throughout this study (Checkland & Scholes, 1990:211), as discussed in Chapter 2.2 where it is portrayed in Figure 2-1.
The objective of this chapter is to answer the following research sub-questions in order to provide a foundation for the focus of the study and the key issues addressed in the following chapters:
• What is the rationale for addressing poverty and poverty alleviation within the context of the BOP in South Africa?
· How has BOP literature progressed in recent times?
· What approaches (paradigms) exist with regards to poverty alleviation in society? • What is the motivation behind focusing on SMMEs as mechanisms for poverty alleviation?
· What is the rationale for developing a decision support framework for SMME owners operating at the BOP?
· What view of social enterprises is most suitable to the purposes of this study so as to avoid any ambiguity?
Research opportunity
This section serves as an introduction to the problematic aspect of the research topic.
Although social problems require present day answers to bring about a desirable future, one must first look to preceding events to find one’s bearings. For this, it is worthwhile briefly looking to South Africa’s historic past which undeniably established the roots of present day poverty levels.
3
H
ISTORICAL BACKDROPWith the advent of democracy in 1994, the African National Congress-led South African government was presented with the task of simultaneously rebuilding an economy stunned by sanctions and preparing a disadvantaged black majority so as to compete in a rapidly globalising world. Just as the poorly educated black population poured into the labour force, the economy was in the process of shifting towards more skills-intensive sectors. Agricultural and mining sectors which had once provided most opportunities to labourers had now given way to other sectors, such as retail and financial services (Dugger, 2010). Beyond this however, the inherited apartheid promoting system of the state was set up to provide quality services to a privileged minority and deliberately ensure the systematic underdevelopment of the majority of South Africans (Pillay, 2000).
Since then, though much has been invested in the post-apartheid education system for the next generation in an attempt to overcome South Africa’s racist legacy, the failing education system has far from achieved this goal. Roughly 24% of the population (around 2.3 million households) live on less than 20 Rands per day, whilst a further 41% of the population (around 5.4 million households) live on less than 80 Rands per day, which when combined qualify as the BOP according to Eighty20 (2011). Many people stuck in poverty struggle to find a job, in an economy where it is the scientists, engineers, accountants, and managers that are in high demand. The country’s skilled labour deficit has furthermore constrained the ability of businesses to expand, at its worst leading to xenophobic instances whereby relatively poor locals have lashed out at foreigners who are accused of stealing their jobs (SAHO, 2015). Even at a higher level, professionals from outside the country with so-called critical skills have been sought, as these professional capabilities are sorely lacking in South Africa (Republic of South Africa, 2014b).
D
EVELOPMENT OF THEBOP
APPROACHProfitable enterprise action at the BOP is not a new concept, however throughout the years since its conception the BOP approach has been improved upon by scholars and practitioners alike.
In 2002, the late Prof CK Prahalad and his co-writer Stuart Hart introduced the radical notion of ‘The Fortune at the Bottom of the Pyramid’ (Hart & Prahalad, 2002) to the business world, which aimed at attracting large corporations to the massive market in developing countries presented by the BOP. This was in opposition to the traditional aid or philanthropic view of BOP dealings at that time. The appeal factor lay in the idea that poverty might be alleviated as a by-product of profit generation. By the close of 2010 it was evident that the idea had not been met with adequate success, as there was little empirical evidence backing the feasibility of the concept, let alone proof of it being worthwhile
(Paramanand, 2015). The lexicon thereafter changed to ‘The Fortune with the Bottom of the Pyramid’ which promotes co-creation as the core tenet for success. A few years later and the concept has moved
4
yet further, beyond this mantra to what can be termed the open era of BOP thinking whereby open innovation is the focus, combining multiple sources in creating value at the BOP (Casado Cañeque & Hart, 2015).
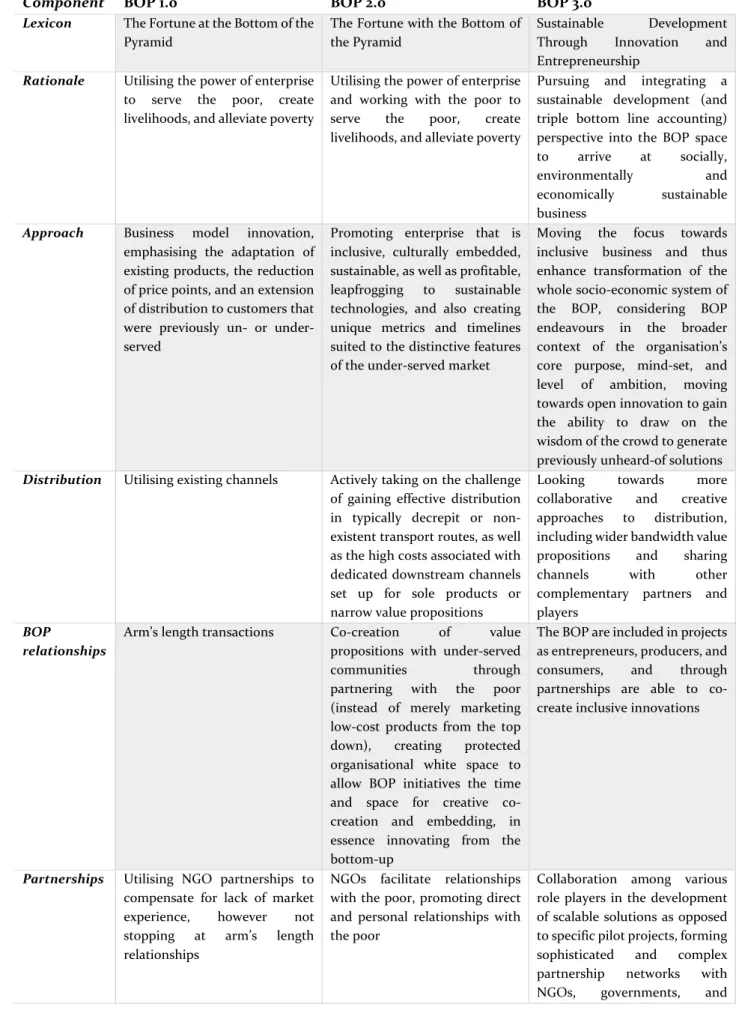
BOP literature has progressed steadily since Prahalad’s seminal work on the subject of profitable poverty alleviation (Hart & Prahalad, 2002), which has since been found wanting, as will be shown in the next few sections regarding the progression of BOP literature (Swaans, Boogaard, Bendapudi, Taye, Hendrickx & Klerkx, 2014; Leeuwis & Van den Ban, 2004; Cozzens & Sutz, 2014). Yet, the core tenet of BOP dealings remains the same, revolving around “the structures and processes required to develop and deliver innovative technologies (goods and services) for poor consumers” (Foster & Heeks, 2013a). A summary discussion of BOP 1.0, 2.0, and 3.0 follows, as the goal of this section is to further familiarise the reader with the historical progression of the BOP approach.
BOP 1.0
According to Casado Cañeque and Hart (2015), “the unfortunate truth is that most BOP ventures and corporate initiatives over the past decade have either failed outright, or achieved only modest success at great cost.” The failings of the original BOP 1.0 approach have been partially attributed to its incremental nature.
BOP 1.0 emphasises the adaptation of existing products, the reduction of price points, and an extension of distribution to customers that were previously un- or under-served (Mohr, Sengupta & Slater, 2009). Furthermore, mediating with the poor via Non-Governmental Organisation (NGO) partners was promoted as a means of compensating for lack of BOP market experience, in essence adopting an arm’s length relationship with the poor.
These efforts can basically be seen as business model innovations, which although necessary, are less than sufficient to meet the task of deriving adequate profits from the BOP market so that businesses can flourish. Hart likens the formative BOP 1.0 approach to “the proverbial ‘child with a hammer’,” to whom everything looks like a nail (Casado Cañeque & Hart, 2015). Enterprises know very well how to swing their pre-existing hammer, and for them the BOP may seem like little more than numerous albeit smaller new nails.
BOP 2.0
To make up for the failings of the initial approach, BOP 2.0 was advanced as a means of overcoming the problems of simply selling to the poor, to promote enterprise that is inclusive, culturally embedded, sustainable, as well as profitable (BoP Global Network, 2012). The secondary approach thus strongly promotes the necessity for co-creation of value propositions with under-served communities, in essence innovating from the bottom-up, leapfrogging to sustainable technologies, and also creating
5
unique metrics and timelines suited to the distinctive features of the under-served market (Arora & Romijn, 2012:485). There is a fundamental shift from finding a fortune at the BOP towards creating a fortune with the BOP, which means a change of premise from a logic of tapping into existing under-served markets to a logic of creating wholly new markets (London & Hart, 2010). The role of NGOs thus becomes one of facilitating relationships with the poor, promoting direct and personal relationships with them (Mohr, Sengupta & Slater, 2009:452).
BOP 3.0
The latest adaptation of the BOP approach is that of BOP 3.0 which has been outlined in the book entitled ‘Base of the Pyramid 3.0: Sustainable Development Through Innovation and Entrepreneurship’ by Casado Cañeque and Hart (2015).
In essence, BOP 3.0 aims to move the focus towards inclusive business and thus enhance transformation of the whole socio-economic system of the BOP (Foster & Heeks, 2015, 2014, 2013a; Heeks et al., 2014; Swaans et al., 2014). This inclusive approach will require collaboration among various role players in the development of scalable solutions as opposed to specific pilot projects which have been shown to have a generally inadequate impact on poverty reduction (Karnani, 2006). Currently, in line with the tenets of inclusive innovation (Foster & Heeks, 2014, 2013a; Swaans et al., 2014), the BOP are included in projects as entrepreneurs, producers, and consumers; and through partnerships are able to co-create inclusive innovations.
A number of themes have since emerged (BoP Global Network, 2012), each of which enhance the BOP approach, namely:
• Shifting from protected space to purpose and mind-set: although BOP 2.0 stresses the need to create protected organisational white space to allow BOP initiatives the time and space for creative co-creation and embedding, it is important to consider BOP endeavours in the broader context of the organisation’s core purpose, mind-set, and level of ambition
• Moving from co-creation to open innovation: even though BOP 2.0 established the significance of co-creating solutions from the bottom-up through partnering with the poor (instead of merely marketing low-cost products from the top down), organisations struggle to acquire the skills necessary for effective co-creation and therefore mutual value creation. Moving towards open innovation presents organisations with the ability to draw on the wisdom of the crowd, to generate previously unheard-of solutions. In addition, inclusive innovation has moved the focus from generalised economic growth to development through active inclusion of the excluded marginalised population prevalent at the BOP (Foster & Heeks,
6
2013a; Heeks et al., 2014; Swaans et al., 2014). These participatory grassroots innovations can point BOP businesses towards new opportunities (Foster & Heeks, 2015)
• Advancing from stand alone to innovation ecosystem: the importance of engagement with the communities in the BOP is clearly seen with the BOP 2.0 approach, however it still tends to view the business as a lone entity. Success or failure is argued as being driven by the organisation’s strategy, price point, business model, and/or value proposition. With BOP 3.0 it is imperative for success that the organisation is securely embedded in a larger innovation ecosystem, which should include: non-traditional demand-side innovators and informal sector workers (King, 1996; Nichter & Goldmark, 2009); lead users (O’Farrell, 2003; Cheneau-Loquay, 2010); potential technology providers; innovation intermediaries who operate between original suppliers and final consumers (Howells, 2006; Stewart & Hyysalo, 2008); innovators who help with product diffusion (Foster & Heeks, 2013a); on-the-ground partners; capacity builders; funders, and; supply chain players
• Shifting from extended distribution to innovation for the last mile: of course, as covered in the BOP 2.0 approach, the importance of taking on the challenge of gaining effective distribution in typically decrepit or non-existent transport routes must be understood, as well as dealing with the high costs associated with dedicated downstream channels set up for sole products or narrow value propositions. Beyond this, BOP 3.0 looks towards more collaborative and creative approaches to distribution, including wider bandwidth value propositions and sharing channels with other complementary partners and players
• Diversifying from only NGO engagement to cross sector partnership networks: BOP 2.0 clearly puts forward the importance of partnering with NGOs (and other key on-the-ground players) so as to bolster much needed and often lacking experience, however BOP 3.0 promotes more sophisticated and complex partnership networks, formed with NGOs, governments, and academic partners, across a broad array of sectors to bring about success
• Changing approach from poverty alleviation to sustainable development: though noble, the original drive for BOP business wherein the power of enterprise to serve the poor, create livelihoods, and alleviate poverty was and still is a strong rationale for going to the BOP. It has come to be seen however that integrating a sustainable development (and triple bottom line accounting) perspective into the BOP space may prove critical for lasting change
7
Table 1-1 BOP literature progression
Component BOP 1.0 BOP 2.0 BOP 3.0
Lexicon The Fortune at the Bottom of the Pyramid
The Fortune with the Bottom of the Pyramid
Sustainable Development Through Innovation and Entrepreneurship
Rationale Utilising the power of enterprise to serve the poor, create livelihoods, and alleviate poverty
Utilising the power of enterprise and working with the poor to serve the poor, create livelihoods, and alleviate poverty
Pursuing and integrating a sustainable development (and triple bottom line accounting) perspective into the BOP space to arrive at socially, environmentally and economically sustainable business
Approach Business model innovation, emphasising the adaptation of existing products, the reduction of price points, and an extension of distribution to customers that were previously un- or under-served
Promoting enterprise that is inclusive, culturally embedded, sustainable, as well as profitable, leapfrogging to sustainable technologies, and also creating unique metrics and timelines suited to the distinctive features of the under-served market
Moving the focus towards inclusive business and thus enhance transformation of the whole socio-economic system of the BOP, considering BOP endeavours in the broader context of the organisation’s core purpose, mind-set, and level of ambition, moving towards open innovation to gain the ability to draw on the wisdom of the crowd to generate previously unheard-of solutions
Distribution Utilising existing channels Actively taking on the challenge of gaining effective distribution in typically decrepit or non-existent transport routes, as well as the high costs associated with dedicated downstream channels set up for sole products or narrow value propositions
Looking towards more collaborative and creative approaches to distribution, including wider bandwidth value propositions and sharing channels with other complementary partners and players
BOP
relationships
Arm’s length transactions Co-creation of value propositions with under-served
communities through partnering with the poor (instead of merely marketing low-cost products from the top down), creating protected organisational white space to allow BOP initiatives the time and space for creative co-creation and embedding, in essence innovating from the bottom-up
The BOP are included in projects as entrepreneurs, producers, and consumers, and through partnerships are able to co-create inclusive innovations
Partnerships Utilising NGO partnerships to compensate for lack of market experience, however not stopping at arm’s length relationships
NGOs facilitate relationships with the poor, promoting direct and personal relationships with the poor
Collaboration among various role players in the development of scalable solutions as opposed to specific pilot projects, forming sophisticated and complex partnership networks with NGOs, governments, and
8
Component BOP 1.0 BOP 2.0 BOP 3.0
academic partners, across a broad array of sectors
Market approach
Tapping into existing markets Creating new markets, with success or failure argued as being driven by the organisation’s strategy, price point, business model, and/or value proposition
Embedding the organisation in a larger innovation ecosystem, which should include: non-traditional demand-side innovators and informal sector workers, lead users, potential
technology providers, innovation intermediaries who
operate between original suppliers and final consumers, innovators who help with product diffusion, on-the-ground partners, capacity builders, funders, and supply chain players
P
OVERTYThe aim of this section is to establish the reality of poverty in South Africa as a pressing need that is worthy of being addressed.
POVERTY DEFINED
Poverty is defined as “the state of one who lacks a usual or socially acceptable amount of money or material possessions” (Merriam-Webster, 2015). A commonly agreed upon socially acceptable amount of money is any income level above the poverty line limit, otherwise referred to as the upper boundary of the Base of the Pyramid (BOP) population (Prahalad, 2009). The BOP population is further discussed in Chapter 3 wherein it is divided into categories according to living standard.
ABSOLUTE POVERTY
Absolute poverty refers to living conditions below the minimum subsistence level. The level of poverty is generally established in comparison to socially acceptable living conditions related to the nutritional requirements, essential goods, or per capita income of the people in question.
In 2012, the use of three national poverty lines, in a cost-of-basic-needs approach, was made in South Africa to differentiate between the various degrees of poverty in the country, namely the food poverty line (FPL), lower-bound poverty line (LBPL), and upper-bound poverty line (UBPL). The FPL corresponds to the level of consumption below which individuals would be unable to purchase sufficient food to adequately nourish themselves. To obtain the LBPL and UBPL, the common variation of Ravillion's cost-of-basic-needs approach was followed (Ravallion, 2012). The LBPL extends to include non-food items, however these items come at the expense of losing the individual’s ability to sustain an adequate diet. Individuals above the LBPL but still below the UBPL can afford to buy both food and non-food items but are still classified as poor. The poverty lines for the period 2006 to 2011
9
were updated annually by making use of the consumer price index data, and have been included in Appendix A.
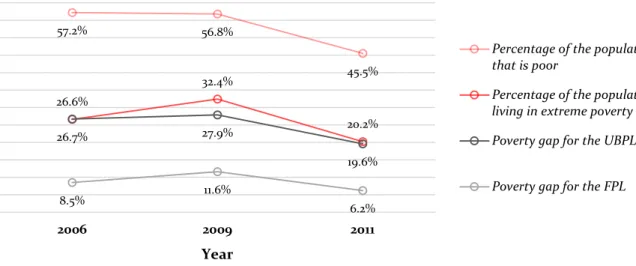
Those below the FPL constitute the extremely poor whilst those below the UBPL constitute the poor in their entirety. For an idea of how large the population in poverty is, one can look to the results of the Statistics S.A. (2014:7)Poverty Trends in South Africa survey which reveals that in 2011, as many as 23 million people (45.5% of the total population) were living in poverty, with 10.2 million of those living in extreme poverty. As can be seen, there is little consensus on the exact size of the BOP due to various measures being employed to measure it by different parties, however, the fact remains that it is indeed substantial.
Poverty headcounts, although intuitively easy to understand and communicate, tend to oversimplify the matter, assuming all of the poor are equally deprived within each band of the poverty lines. A more useful approach is to look at the size of the poverty gap, which “measures the average distance of the population from the poverty line and is expressed as a percentage of the poverty line” (Statistics S.A., 2014:13). Thus, the poverty gap indicates the depth of poverty. Figure 1-1 shows the official estimates of the poverty gap and headcount of the poor as a percentage of all those stuck in poverty in South Africa.
Figure 1-1 Poverty headcounts and poverty gaps (Statistics S.A., 2014:13)
It is evident that despite the increase in the poverty gap size for 2009 (related to the global economic crisis), poverty is on the decline, which, according to Statistics S.A. (2014:22), can be attributed to:
An expanding social safety net, income growth, above inflation wage increases, decelerating inflationary pressure on households, expansion of credit (especially unsecure lending) and the growth in formal housing. While the expansion of grants is probably the most significant of all these forces, it is a combination of multiple factors that has aided the country in poverty alleviation.
As will be addressed shortly, such an approach based predominantly on grants may alleviate poverty, but it is not the most ideal in terms of empowering the BOP.
57.2% 56.8% 45.5% 26.6% 32.4% 20.2% 26.7% 27.9% 19.6% 8.5% 11.6% 6.2% 2006 2009 2011 Year
Percentage of the population that is poor
Percentage of the population living in extreme poverty Poverty gap for the UBPL