University of Massachusetts Amherst University of Massachusetts Amherst
ScholarWorks@UMass Amherst
ScholarWorks@UMass Amherst
Masters Theses Dissertations and Theses
March 2016
Gender Inequality: Nonbinary Transgender People in the
Gender Inequality: Nonbinary Transgender People in the
Workplace
Workplace
Skylar DavidsonUniversity of Massachusetts Amherst
Follow this and additional works at: https://scholarworks.umass.edu/masters_theses_2 Part of the Gender and Sexuality Commons, and the Inequality and Stratification Commons
Recommended Citation Recommended Citation
Davidson, Skylar, "Gender Inequality: Nonbinary Transgender People in the Workplace" (2016). Masters Theses. 321.
https://scholarworks.umass.edu/masters_theses_2/321
This Open Access Thesis is brought to you for free and open access by the Dissertations and Theses at ScholarWorks@UMass Amherst. It has been accepted for inclusion in Masters Theses by an authorized administrator of ScholarWorks@UMass Amherst. For more information, please contact
Gender Inequality: Nonbinary Transgender People in the Workplace
A Thesis Presented by
SKYLAR DAVIDSON
Submitted to the Graduate School of the
University of Massachusetts Amherst in partial fulfillment of the requirements for the degree of
MASTER OF ARTS
February 2016
Gender Inequality: Nonbinary Transgender People in the Workplace
A Thesis Presented by
SKYLAR DAVIDSON
Approved as to style and content by:
______________________________ Donald Tomaskovic-Devey, Chair ______________________________ Joya Misra, Member
______________________________ Naomi Gerstel, Member
____________________________ Michelle Budig, Department Head
ABSTRACT
GENDER INEQUALITY: NONBINARY TRANSGENDER PEOPLE IN THE WORKPLACE
FEBRUARY 2016
SKYLAR DAVIDSON, B.A. STOCKTON UNIVERSITY Directed by: Professor Donald Tomaskovic-Devey
Most research on employment gender inequality focuses on differences between men and women, reinforcing a binary conception of gender. This study uses the National
Transgender Discrimination Survey to evaluate the employment outcomes of nonbinary transgender people (those who identify as a gender other than man or woman). The results of this study suggest that being out as a nonbinary transgender person negatively affects nonbinary transgender people's employment outcomes. Though all transgender people have higher unemployment rates than the general population, outness has different effects on nonbinary transgender people based on sex assigned at birth, with those
assigned male at birth tending to be discriminated against in hiring but those assigned female at birth more likely to experience differential treatment once hired. Race also contributes to differential treatment in the workplace. In an additional comparison between all transgender groups, I find that transgender women tend to have worse employment experiences than nonbinary transgender people and transgender men, the latter two tending to have similar outcomes.
TABLE OF CONTENTS Page ABSTRACT... iii LIST OF TABLES... v CHAPTER I. INTRODUCTION... 1
II. LITERATURE REVIEW... 3
A. Gender inequality... 3
B. What is a transgender person? What are nonbinary genders?... 3
C. Transgender people in employment settings... 6
III. HYPOTHESES... 14
IV. DATA AND METHODS... 16
A. Overview of the National Transgender Discrimination Survey... 16
B. Coding decisions... 19 C. Variables... 20 V. RESULTS... 26 A. Hypothesis 1... 27 B. Hypothesis 2... 27 C. Hypothesis 3... 30 D. Hypothesis 4... 31 VI. CONCLUSION... 33
APPENDIX: REGRESSION MODELS... 37
LIST OF TABLES
Table Page
1. Age Distributions for the General U.S. Population, Nonbinaries, Transgender
Men, and Transgender Women, 2008... 17
2. Race Distribution for the General U.S. Population, Nonbinaries, Transgender Men, and Transgender Women, 2008... 17
3. Educational Distributions for the General U.S. Population, Nonbinaries, Transgender Men, and Transgender Women, 2008... 18
4. Variables... 20
5. Comparing Outness and Appearance in Nonbinaries, Transgender Men, and Transgender Women... 22
6. Labor Market Outcomes of Nonbinaries, Transgender Men, and Transgender Women (National Transgender Discrimination Survey)... 23
7. Regression Models for Nonbinaries Only... 26
8. Regression Models for Nonbinaries Only, Including Interactions... 28
CHAPTER 1
INTRODUCTION
Most research on employment gender inequality focuses on the distinctions between men and women, reinforcing a binary conception of gender. Even the United States Equal Employment Opportunity Commission (EEOC) includes only male and female as gender options, meaning that the EEOC cannot identify who is transgender and that nonbinary transgender people (those whose gender identity is something other than only man or only woman) are not acknowledged and counted. My study compares employment outcomes among a variety of transgender people: transgender men,
transgender women, and nonbinary transgender people (whom I will call “nonbinaries”).
Thus my study contributes to employment research by providing information on how nonbinaries, a profoundly understudied group, fare in the workplace.
I use the National Transgender Discrimination Survey, which was conducted by the National Center for Transgender Equality and the National Gay and Lesbian Task Force in 2008. This survey allowed respondents to write in their own gender identity if the three predefined categories (male/man, female/woman, or part time as one gender, part time as another) were not appropriate. There were a variety of written-in responses, including but not limited to genderqueer, androgynous, nongendered, culturally specific third genders (e.g., Two-Spirit, Mahuwahine), and some unique responses (e.g., birl, OtherWise). It also permitted respondents to state the degree to which a variety of transgender terms (e.g., genderqueer, male to female) represent them. It also asked for sex assigned at birth. This allowed me to obtain a final sample of 1389 nonbinaries, 2906 transgender women, and 1347 transgender men. Using a survey of this size allows me to greatly expand upon prior research on transgender people, much of which has been based
on small samples and has not recognized the possibility of nonbinary genders.
Recently, there has been attention to transgender people in the mainstream media, including coverage of the suicide of Leelah Alcorn, of Caitlyn Jenner's male to female transition, and of the fashion choices of masculine transgender people. Further academic research is needed to both advance scholarly understanding of transgender people and to provide material that increases the public's understanding of transgender people. My study increases knowledge about transgender people's experiences through exploring how nonbinaries' outness in work settings influence their income, work status, and status within workplace hierarchies. At the same time, my study investigates the nature of gender as an interactional accomplishment. Though survey data does not provide a comprehensive explanation of interactions, I approach evaluating interactions through the questions in this survey regarding whether the respondent is out at the workplace and whether people perceive their appearance as being transgender or gender-nonconforming. In the next section, I introduce my theoretical approach to gender inequality, followed by an overview of my data and methods, my hypotheses, and my results.
CHAPTER 2
LITERATURE REVIEW
A. Gender Inequality
A variety of theories about inequality between men and women posit that
categorical distinctions allow for the generation of inequality on the basis of gender and other categories (e.g., Ridgeway 2011; Tilly 1998). Acker (1990) portrayed
organizations as being based on stereotypically male “ideal workers” rather than being gender-neutral. In discussing gendered and racialized discrimination, Harvey Wingfield (2009) explained how stereotypes hinder people's relationships with both coworkers and supervisors and that both the stereotypes and the separation from coworkers can
contribute to people's reduced chances for success in the workplace. Nonbinaries, however, do not inhabit a widely known and understood category, and transgender men and transgender women transition between categories. Because the norm in Western society is to view gender as a binary biological construct, transgender and gender nonconforming people challenge the categorical norms about gender and sexuality (Monro 2003). My research builds upon research about categorization and inequality by exploring what happens to people in a group that is likely to be miscategorized or not categorized.
B. What is a transgender person? What are nonbinary genders?
Because transgender terminology is complex and rapidly changing, I will describe how I am using important terms in this paper. “Transgender” is an umbrella term that
refers to people whose gender identity differs from the sex they were assigned at birth, and the term “cisgender” refers to people whose gender identity corresponds to the sex
people who are intersex can trouble this binary. Sex is a biological category:
designations of male, female, or intersex are based on a number of factors, including chromosomes, hormones, and genitalia. Though it is typical to view sex as a binary of male and female, the way in which this is done has varied across time and place (Fausto-Sterling 2000). Gender is distinct from sex, but related: it is the translation of biological realities into social expectations for “men” and “women” (Beemyn and Rankin 2011;
Sausa 2002). As with sex, it is common to view gender as a binary and marginalize expression that does not fit within this binary.
Gender identity refers to individual people's sense of their own gender, which may differ from their sex assigned at birth, from their gender expression, and from the way other people perceive their gender (Beemyn and Rankin 2011). Though most intersex people are assigned male or female at birth, some identify with a different gender later in life. Intersex people may come to identify with any gender identity (man, woman, or a nonbinary gender). Some people, regardless of sex assigned at birth, choose not to label themselves either cisgender or transgender. Gender identity is distinct from sexual orientation, which is the pattern of a person's attraction to others (Sausa 2002). Both transgender and cisgender people may identify with any sexual orientation, including but not limited to heterosexual, gay, lesbian, bisexual, queer, or asexual (Beemyn and Rankin 2011). Gender identity is not the same as gender expression, which is the degree to which someone expresses masculinity, femininity, both, or neither.
People's gender identity may be man or woman, or it may be something else, such as both man and woman, neither man nor woman, or a unique identity. For example, Beemyn and Rankin (2011) conducted a survey in 2005 and 2006, which was open to anyone who considered themselves part of the umbrella term “transgender,” regardless of
whether they used that term for themselves. In order to be inclusive of all gender-nonconforming people, they defined “transgender” as “anyone who transgresses or blurs
traditional gender categories” (2011:22). Respondents to the survey could describe their gender identity as woman, man, transgender, or other, and those who chose transgender or other were permitted to elaborate on their response in a text box. As in the National Transgender Discrimination Survey, there were varied written responses, some of which were unique (2011:23-25). Some identical write-in responses came both from
respondents who chose “transgender” as their gender identity and from respondents who chose “other,” indicating that much terminology related to gender is ambiguous
(2011:26). This may be related to varying personal experiences with biological sex, gender identity, and gender expression. Some gender identities that fall under the umbrella term “nonbinary gender” are genderqueer, agender, androgynous, Two-Spirit,
gender nonconforming or gender variant, third gender, genderfluid, and bigender.
Gender dysphoria refers to transgender people's feelings of distress because of the mismatch between their sex assigned at birth and their gender identity. Gender dysphoria can take the form of physical dysphoria, which is distress regarding sex characteristics such as genitals, breasts and facial hair; social dysphoria, which is distress regarding social interactions such as being perceived as the incorrect gender or being forced to wear clothing associated with the incorrect gender; or both physical and social dysphoria. All three transgender groups (transgender men, transgender women, and nonbinaries) can experience gender dysphoria. In other words, nonbinary genders are identities like those of “man” and “woman,” not political statements or fashion choices.
C. Transgender People in Employment Settings
Overview of Workplace Inequality for Transgender People
Transgender people have reported difficulty securing and maintaining
employment as a result of their gender identity and expression. Unemployment rates for transgender people are approximately twice as high as those for cisgender people (Grant et al. 2011), about the same difference as between whites and blacks (Bureau of Labor Statistics 2015). About half of transgender people have reported adverse job outcomes, such as being fired, not hired, or denied a promotion as a result of their gender identity or expression (Grant et al. 2011). This is higher than the rates for cisgender people; for example, 5.6% of cisgender people report being fired because of discrimination, 16.0% report not being hired because of discrimination, and 12.7% report being refused a promotion because of discrimination (Kessler, Mickelson, and Williams 1999). Being transgender can also influence someone's salary; Schilt and Wiswall (2008) found that while transgender women on average lose approximately a third of their salary after transitioning, transgender men on average see no change in their salary or a slight increase. This finding relates to the wage gap between men and women more generally; Schilt and Wiswall (2008) connect this inequality to the interactional tendency to treat men with more respect and authority than women. Transgender people of color, particularly African Americans, report poorer employment outcomes than white transgender people (Grant et al. 2011). The literature has established evidence of employment difficulty for transgender people. However, most studies on transgender people have used small qualitative samples without comparison baselines, so the
literature has not established the scope of the problem or made comparisons of inequality between different categories of transgender people.
The Role of Categorization
Ridgeway (2011) described how social relations are based on shared knowledge. Drawing on Goffman, she stated that everyday interactions are based on people's ability to coordinate behavior according to a consensus about how actors in a situation are related to one another and how they can be expected to act (2011:35-36). In order to define who people are and whom those people can be compared to, categories are needed. Because categories are based on contrast and differentiation, social coordination is thus based on directing people's attention to differences between people (2011:36-37). In order to facilitate everyday interaction, simple categorical systems are necessary. These “primary category systems” must be broad and general so that they can apply to nearly
everyone; thus they must be applicable to many contexts and easily visible. Ridgeway described “sex/gender” as a primary category. The biological baseline of sex becomes
culturally specific gender through expanding its range of application (further away from reproductive functions) and expanding behavioral expectations. Nonbinaries, who do not fit the gender binary, disrupt this system.
West and Zimmerman (1987) described gender as a performance that occurs in everyday life, in which people often judge others immediately based on their appearance. When people cannot immediately characterize someone as a woman or man, they become confused and often want to find some way to characterize that person in order to
determine how to relate to them (West and Zimmerman 1987:133). Similarly, Monro (2003) stated that there is no socially acceptable category for identities or presentations that are neither male nor female. As a result of the lack of interactional routines for people whose identity or expression transgresses the gender binary, most cisgender people lack interactional scripts with which to process these transgressors. This is
corroborated by reports from people whose gender presentation is ambiguous, who describe being stared at in public and overhearing confused remarks (Lucal 1999; Nordmarken 2014). The main trigger point for transgender workplace discrimination appears to be the beginning of the transition process, because the transition disrupts gendered interactional scripts and generates in at least some people annoyance, irritation and even aggression (Whittle, Turner, and Al-Alami 2007:14).
Categorization and Discrimination in the Workplace
Transgender people have identified a number of issues in their workplaces that influence their ability to feel comfortable in their work environment, demonstrating the variety of experiences transgender people have. For transgender people who are transitioning, one issue is workplaces' lack of procedures for ensuring that others in the workplace are aware of how to treat a transgender person who is transitioning (Whittle, Turner, and Al-Alami 2007). As one transgender woman reports:
We had a verbal agreement that I would use the ladies locker room and the customer disabled toilet, I started back to work as ****** (new name) put my stuff away and started work. Half an hour later I was summoned to Personnel, told there was no way I could use the locker room and was made to take my stuff out and carry it though the whole shop and keep it in a computer games cupboard... I was not allowed a key and had to ask a supervisor every time I needed my bag or coat, I was also sitting on the checkouts and getting abuse from customers which led to panic attacks, but they refused to take me off them. I managed to get in touch with my regional Manager and he arranged a meeting with the Manager, my store manager and myself, they told me they had wasted too much time and money on me and that they didn’t know what to do with me and that they would not be supporting me... I was given a filing cabinet in the car park attendants office for my bag and, they also decided to keep the disabled toilet locked because it had been vandalised so often and my only alternative was to cross the car park and use the garage toilet. (Whittle, Turner, and Al-Alami 2007:34)
Hierarchical workplaces can exacerbate this issue, because transgender people must carefully determine the degree to which they can be out at the workplace to avoid harassment or job loss (Dietert and Dentice 2009). They may only be able to be out to
some people—possibly only authority figures, and possibly never authority figures (Dietert and Dentice 2009:131, 135). Some transgender people who have already
completed their transition attempt to avoid disclosing their transgender status (Dietert and Dentice 2009). Employers and coworkers may cause confusion for transgender people; as one transgender man said:
My boss and I have talked and he said . . . he felt it would be best that I don’t come out in the workplace. He says he’s trying to look out for my best interests and he’s very fearful of what the employees will think or what they’ll say. (Dietert and Dentice 2009:136)
Bathrooms are a common source of difficulty for transgender people in the workplace. Many report being refused access to bathrooms or being verbally or physically attacked in bathrooms (Herman 2013; Nadal, Skolnik, and Wong 2012). As one transgender woman reports:
I felt forced to make sure I used the bathroom before I left the house and did not use the public restroom unless I was 100% [sure] there was no one in there or [I would] go to a different floor that I didn't work on where I was less likely to encounter the same [gossiping coworkers], or I waited until I got home to use the bathroom [because] I usually didn't feel safe at all using the restrooms in public. (Herman 2013:75)
Some cisgender people view transgender people they encounter in bathrooms as “predators,” in women's bathrooms or “targets,” in men's bathrooms (Nadal, Skolnik, and
Wong 2012). Transgender people may avoid using public bathrooms, causing physical discomfort, or may spend time searching for bathrooms that are less often used, so that they do not come into contact with another person there (Herman 2013). Bathroom issues can be especially prominent when a transgender person is just beginning their gender transition and is more visibly transgender (Whittle, Turner, and Al-Alami 2007). Westbrook and Schilt (2013) provide a potential explanation for the bathroom problem by describing people as being more likely to use gender identity as a criteria for determining
gender in gender-integrated spaces but more likely to use biology-based criteria for determining gender in gender-segregated spaces, especially women's spaces, because of the perception that women are vulnerable when in contact with a biologically male person. Transgender people report that finding an acceptable solution can be time-consuming or distracting, and some quit their jobs because of the lack of a solution (Herman 2013:75). A lack of a solution to this problem can thus contribute to transgender people's lack of job opportunities that reflect their skills and educational qualifications.
Transgender and gender non-conforming people report that gender-specific dress codes cause them difficulty, because they require them to dress in a manner inconsistent with their identity (Levi 2007). People may lose their jobs for disregarding dress code rules (Levi 2007). Because nonbinary genders are not categories considered part of the mainstream, there are typically not social norms of dress, behavior, or communication, so people often want nonbinaries to fit into the category of man or woman. In response, transgender people sometimes attempt to avoid drawing hostility from colleagues by forcing themselves to express gender according to traditional stereotypes (Schilt and Connell 2007). Thus the effect of appearance on interpersonal conflict involving
transgender people is ambiguous: sometimes it involves sex assigned at birth, sometimes gender stereotypes, sometimes both.
One problem transgender people experience in a variety of settings is verbal harassment. People may call a transgender or gender nonconforming person by
incorrectly gendered terminology, whether intentionally or not, and possibly in a public setting that causes embarrassment (Nadal, Skolnik, and Wong 2012). As one transgender woman recalled:
I'm very open about being transgender inside the school, and [someone] went and told some students that that's a man and students looked at me and were like, “What, that's not a man. Look at her face and she has breast [sic]. That's not a man.” So, they were standing and looking at me like if I was a circus freak, you know . . . as usual. (Nadal, Skolnik, and Wong 2012:69)
People may violate someone's bodily privacy by asking intrusive questions or making intrusive comments about someone's primary or secondary sex characteristics. For example, people may say that a person presenting as feminine is a man or ask that person what type of genitalia they have. Other forms of harassment include assuming that a transgender or gender nonconforming person has sexually transmitted diseases or is sexually deviant, using transphobic slurs, and denying or minimizing a transgender or gender nonconforming person's experiences of transphobia (Nadal, Skolnik, and Wong 2012).
Some transgender or gender nonconforming people fear being physically attacked because of verbal harassment or actually experience physical or sexual harassment because of their gender identity or gender presentation. Although any specific
transgender identity is composed of a diverse group of people, there are some stereotypes attached to transgender people, particularly transgender women (Nadal, Skolnik, and Wong 2012). For example, some transgender women, particularly those of color, have reported being profiled as sex workers (Nadal, Skolnik, and Wong 2012). Authority figures who believe stereotypes about transgender people may treat them unequally or harshly. For example, people of color have reported experiencing disrespectful language and physical assault when dealing with police (Grant et al. 2011; Nadal, Skolnik, and Wong 2012; Spade 2006). This may be connected to transgender people of color, particularly African Americans, reporting poorer employment outcomes than white transgender people as well (Grant et al. 2011). Schilt (2010:16) found that transgender
men who were tall and white and who appeared to be cisgender men tended to gain more status in the workplace than transgender men who were short, men of color, or who did not appear to be cisgender men. Thus men who fit hegemonic masculinity norms have better outcomes than those who do not (Connell and Messerschmidt 2005). Thus it may be useful, when practical, to look at transgender inequality through an intersectional lens.
Conflicts between someone's gender identity or expression and official identity documentation can lead to confusion or unintended outing. Changing one's name and gender on official identity documents can be difficult, because changing one document is sometimes dependent on changing another, which is in turn dependent on another (Nadal, Skolnik, and Wong 2012:74-75). In most places, it is impossible to obtain official
identity documents listing a nonbinary gender. Governments may not have explicit procedures for changing official identity documents (Whittle, Turner, and Al-Alami 2007), and some transgender people are not interested in obtaining surgery, which may be necessary to change official documents. Employers who are unfamiliar with difficulties involved in changing identity documents may be confused and not know how to react (Whittle, Turner, and Al-Alami 2007:41-42).
Even if a workplace has an antidiscrimination policy that includes gender identity and expression, cisgender workers may not understand what it means to be transgender, and this confusion can lead to people's belief that others may use the criteria to enter the incorrect sex-segregated space in order to harm or scare people (Westbrook and Schilt 2013). Without support from upper management, workplace protections for transgender employees may not be enforced (Dietert and Dentice 2009:138). Transgender people can be targets for discrimination and lose job opportunities if they cannot find a solution to these problems. In order to prevent problems, transgender people may sort themselves
into occupations or industries they believe to be friendly to transgender people, similar to what Tilcsik, Anteby, and Knight (2015) found for gays and lesbians.
CHAPTER 4
HYPOTHESES
There is a lack of data on nonbinary transgender people in the workplace; however, prior research regarding transgender and gender-nonconforming people has demonstrated that both identity and gender presentation can contribute to hostile or unequal outcomes. Though little research has been done to date regarding nonbinary genders, research on nonconforming people has indicated that
gender-nonconforming people tend to encounter hostile or confused reactions from people in everyday situations. Employment policies acknowledging and protecting transgender people are often lacking, and when they do exist, they may elicit confusion and negative reactions. In many situations, nonbinaries' identities are not acknowledged, and
nonbinaries are forced to affiliate with a binary gender option. Thus in many
employment situations, nonbinaries find it difficult to fit in, to be acknowledged and accepted by coworkers. My research explores differences in outcomes that can occur as a result of hostile treatment on the part of employers or coworkers.
Hypothesis 1: Nonbinaries who are open about their gender identity will encounter more negative employment outcomes compared to nonbinaries who are not open about their gender identity. This is because employers, coworkers, and clients are more likely to harass or discriminate against nonbinaries when nonbinary status is part of the explicit gender display.
Hypothesis 2: Nonbinaries who were assigned male at birth will encounter more
negative employment outcomes than nonbinaries who were assigned female at birth. As described in the literature, transgender women (assigned male at birth) tend to experience worse outcomes than transgender men (assigned female at birth). I expect people
assigned male at birth who deviate from masculinity (a valued characteristic) to
encounter negative outcomes for doing so, and I expect people assigned female at birth who deviate from femininity (a less valued characteristic) to encounter less hostility for doing so.
Hypothesis 3: Nonbinaries of color will encounter more negative employment outcomes than white nonbinaries. Gender identity intersects with race to create additional
challenges for people of color.
Hypothesis 4: Transgender women will encounter more negative employment outcomes than nonbinaries. Transgender men will encounter better employment outcomes than nonbinaries. Prior research on transgender women describes them as overwhelmingly experiencing negative outcomes. In contrast, there are sometimes benefits for
transgender men, such as an increase in salary. I do not expect nonbinaries to experience the potential positive effects some transgender men report, because they do not occupy a category (man) often perceived as valued. However, I do not expect them to experience as much negative outcomes as transgender women, because employers, customers, and coworkers may be more likely to react to nonbinaries with confusion rather than
stereotypes associated with a category (woman) often perceived as devalued. In addition, I hypothesize that transgender women will have the worst outcomes because they are stereotyped as sexual deviants and predators and because they report considerable harassment and violence as a result of their identity.
CHAPTER IV
DATA AND METHODS
A. Overview of the NTDS
I use data from the National Transgender Discrimination Survey. The researchers obtained participants through about 800 transgender organizations and about 150 online listserves. In addition, in order to obtain responses from hard-to-find participants, they distributed more than 2000 paper surveys to rural, homeless, and low-income people (Grant et al. 2011). The survey was available in both English and Spanish. The total number of respondents in this survey was 6456. Most participants took the survey online; about 500 completed paper surveys. The NTDS follows the precedent of
Blumstein and Schwartz's (1983) American Couples study in size and methods. For that study, they surveyed about 6000 couples in order to investigate experiences of marriage and cohabitation across sexual orientation, demonstrating the value of large-sample non-random surveys for studying LGBT people.
In contrast to much prior research on transgender people, based on small samples, often from clinical settings (Kuper, Nussbaum, and Mustanski 2012), the NTDS was designed to be large and as representative as possible of the transgender and gender nonconforming population of the United States. Though it is not a random sample and probably has some representational bias, perhaps underrepresenting racial and ethnic minorities and overrrepresenting highly educated people (Harris 2015), it does represent a demographically diverse population, including substantial variation along the lines of race, education, and age. It is by far the largest and most diverse sample of transgender people.
Men, and Transgender Women, 2008
Source National Transgender Discrimination Survey 2008 Current Population Survey Population Nonbinaries Transgender
Men Transgender Women General Population 18-24 26% 22% 10% 8% 25-34 41% 47% 23% 13% 35-44 15% 19% 20% 14% 45-54 11% 11% 27% 15% 55-64 8% 2% 19% 11% 65+ 1% 0% 3% 12%
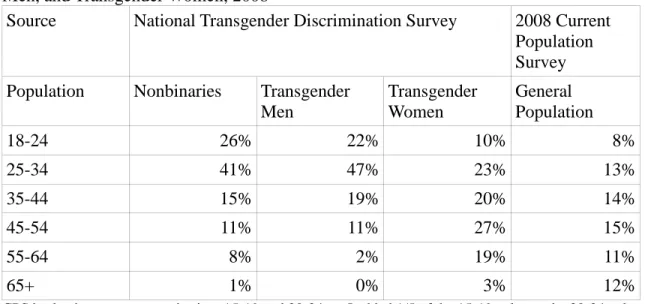
CPS broke down age categories into 15-19 and 20-24, so I added 1/5 of the 15-19 value to the 20-24 value to arrive at the 18-24 value.
As Table 1 demonstrates, people who identify in this survey as transgender men or as nonbinary genders tend to be much younger than the general population. This is likely because part of the process of taking on these identities involves understanding that the option to identify as such exists (Beemyn and Rankin 2011). Those identities have not been part of the mainstream discourse as long as that of a transgender woman, which has been in the media since coverage of transgender women such as Christine Jorgensen in the 1950s (Beemyn and Rankin 2011). As a result, it is younger cohorts who are more likely to identify with all three transgender categories, particularly transgender men and nonbinaries.
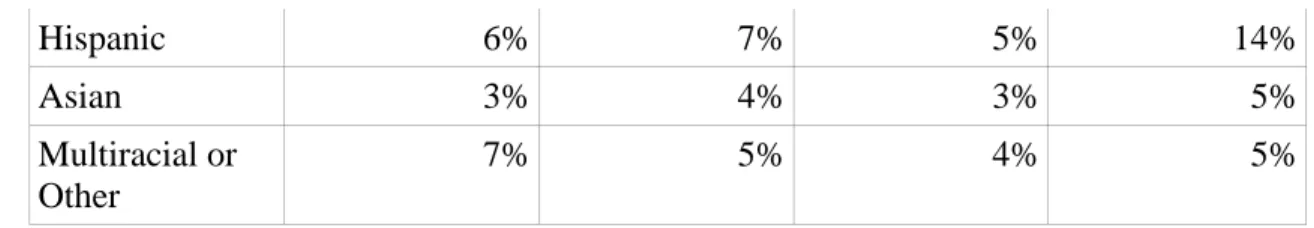
Table 2: Race Distribution for the General U.S. Population, Nonbinaries, Transgender Men, and Transgender Women, 2008
Source National Transgender Discrimination Survey 2008 Current Population Survey Population Nonbinaries Transgender
Men Transgender Women General Population Non-Hispanic White 79% 79% 83% 64% Black 5% 5% 5% 12%
Hispanic 6% 7% 5% 14%
Asian 3% 4% 3% 5%
Multiracial or Other
7% 5% 4% 5%
All gender identities found in the NTDS sample have more non-Hispanic white people than the general population. Black and Hispanic identities are represented at between a third and a half of their population rates.
Table 3: Educational Distributions for the General U.S. Population, Nonbinaries, Transgender Men, and Transgender Women, 2008
Source National Transgender Discrimination Survey 2008 Current Population Survey Population Nonbinaries Transgender
Men Transgender Women General Population Below High School 4% 3% 4% 13% High School/GED 7% 7% 9% 29% Some College, Associate's Degree, or Technical School Degree 39% 40% 45% 26% Bachelor's Degree 30% 30% 24% 15% Graduate or Professional Degree 20% 20% 19% 15%
The NTDS sample is more highly educated than the general population, with particularly strong representation among those with some college and BA level education and minimal representation among high school and lower graduates. The NTDS
nonbinary population is younger, whiter, and more educated than the general population. These are likely to be selection criteria that influence the adoption of nonbinary identity
labels. It is also possible at least to some extent that they are the result of more educated people (who are also more likely to be white and young) having higher response rates or being more likely to participate in the transgender communities the survey was
distributed to.
B. Coding Decisions
The question about sex assigned at birth had two responses, “male” and “female.” The question about gender had four responses, “male/man,” “female/woman,” “part time one gender, part time another,” and “other.” The NTDS also had questions in which
respondents could express the degree to which they identify “not at all,” “somewhat,” or “strongly” with certain transgender terms.
I coded write-in responses as nonbinaries, regardless of whether they were assigned male or female at birth, for a total of 859. Determining who from the category “part time as one gender, part time as another” counts as a transgender man, a transgender
woman, or a nonbinary person is difficult. To create a category of nonbinaries, I added to the respondents who wrote in their gender the respondents who chose “part time as one gender, part time as another” who identified strongly with the terms gender
nonconforming or gender variant, genderqueer, androgynous, third gender, Two-Spirit, and other, which are all terms that fall under the umbrella category of “nonbinary gender.” I added these 695 people to the category of nonbinaries, for a total of 1554.
The category of transgender women includes those people who chose “female/woman” as their gender identity but did not choose “female” as their sex
assigned at birth (2273 people). In addition, the category of transgender women is composed of those people who chose “part time as one gender, part time as another” and also stated that they identified strongly with the term “male to female” (679 people), for a
total of 2952 transgender women. Similarly, I placed into the category of transgender men those people who chose “male/man” as their gender identity but did not choose “male” as their sex assigned at birth (1319 people). In addition, this category includes those people who chose “part time as one gender, part time as another” and also stated that they identified strongly with the term “female to male” (119 people), for a total of
1438 transgender men. Respondents who fit none of these criteria, including cross-dressers and drag queens (1214), were dropped. This means that the resulting 5242 people identify as a gender other than that associated with their sex assigned at birth and are more likely to express their being transgender in everyday settings, such at work.
C. Variables
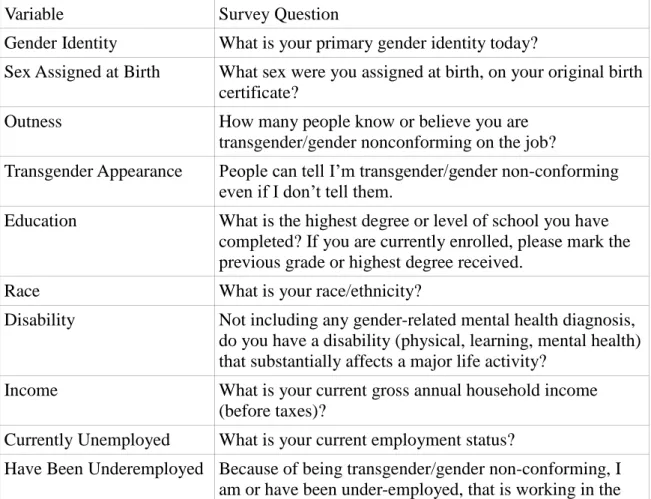
The variables used and their survey questions are as follows. Table 4: Variables
Variable Survey Question
Gender Identity What is your primary gender identity today?
Sex Assigned at Birth What sex were you assigned at birth, on your original birth certificate?
Outness How many people know or believe you are transgender/gender nonconforming on the job?
Transgender Appearance People can tell I’m transgender/gender non-conforming even if I don’t tell them.
Education What is the highest degree or level of school you have completed? If you are currently enrolled, please mark the previous grade or highest degree received.
Race What is your race/ethnicity?
Disability Not including any gender-related mental health diagnosis, do you have a disability (physical, learning, mental health) that substantially affects a major life activity?
Income What is your current gross annual household income (before taxes)?
Currently Unemployed What is your current employment status?
Have Been Underemployed Because of being transgender/gender non-conforming, I am or have been under-employed, that is working in the
field I should not be in or a position for which I am over-qualified.
Lost Job Because of being transgender/gender non-conforming, I lost my job.
Denied Promotion Because of being transgender/gender non-conforming, I was denied a promotion.
Removed from Contact Because of being transgender/gender non-conforming, I was removed from direct contact with clients, customers or patients.
The dependent variables, the employment outcomes I investigate, are annual income, whether the respondent is currently unemployed, and whether as a result of being transgender the respondent has been underemployed, lost a job, been denied a promotion, and been removed from direct contact with clients, customers, or patients.
The NTDS has only a household income question, not an individual income question. This variable has 14 options. The first 10 are intervals of $10,000. The next four intervals are $100,000-$149,999, $150,000-$199,999, $200,000-$249,999, and $250,000 and over. Although there are questions regarding the number of people in the household, whether the respondent has a partner, and whether the respondent is
financially responsible for any children, there is no way to determine whether the partner or children live with the respondent, and there is no way to tell who in the household earns income. As a result, I only compare incomes among transgender people who live alone. I recoded each category to its midpoint in order to create a ratio variable, and I collapsed the last three income categories to create a top income category of $200,000. I counted as unemployed both those respondents who are currently looking for a job and those who have stopped looking. The other four dependent variables are yes/no
questions.
regarding outness (“How many people know or believe you are transgender/gender
nonconforming on the job?”) has these responses: none, a few, some, most, and all. For simplicity, I collapsed the responses into three categories: none, some (composed of “a few” and “some” from the previous question), and most/all (composed of “most” and “all” from the previous question). Outness is the main variable of interest.
The question about transgender appearance (“People can tell I’m
transgender/gender non-conforming even if I don’t tell them”) has these responses: always, most of the time, sometimes, occasionally, and never. I collapsed this question into three responses: always/most of the time (composed of “always” and “most of the time” from the previous question), sometimes (composed of “sometimes” and
“occasionally” from the previous question), and never. For all three transgender groups,
the survey did not have the means to compare nuances of appearance, such as whether people know whether someone is transgender based on clothing, secondary sex
characteristics, mannerisms, a combination of these, or something else. The literature on categorization demonstrates that transgender or gender-nonconforming appearance can lead to negative outcomes for transgender people, so appearance is a control variable in my analyses to distinguish between the effects of appearance and the effects of outness. Table 5: Comparing Outness and Appearance in Nonbinaries, Transgender Men, and Transgender Women
Outness None Some Most/All
Nonbinaries 337 (28%) 469 (39%) 408 (34%) Transgender Men 251 (20%) 570 (46%) 425 (34%) Transgender Women 399 (21%) 654 (35%) 814 (44%)
Appearance Never Sometimes Always/Most of the Time
Nonbinaries 129 (11%) 636 (52%) 449 (37%) Transgender Men 453 (36%) 539 (43%) 254 (20%)
Transgender Women 306 (16%) 1241 (66%) 320 (17%)
As Table 5 shows, most people in each of the three transgender categories report that some people can tell from their appearance whether they are transgender or gender nonconforming. Many nonbinaries (37%) report that most or all people can tell, while in contrast, many transgender men (36%) report that no one can tell. The three transgender groups have similar levels of outness in the workplace, with more reporting being out to some or to most or all people than to no one. Outness may reflect different choices for nonbinaries compared to the other two transgender groups, however, because nonbinary genders are not mainstream categories. It is possible for a transgender man or a
transgender woman to appear cisgender, so some transgender men and transgender women are able to present themselves as their gender identity without calling attention to their transgender status. In contrast, a nonbinary transgender person must identify themselves as transgender in order for their gender identity to be recognized, indicating that nonbinaries must determine their ability to be out safely in work settings.
Baseline Comparisons
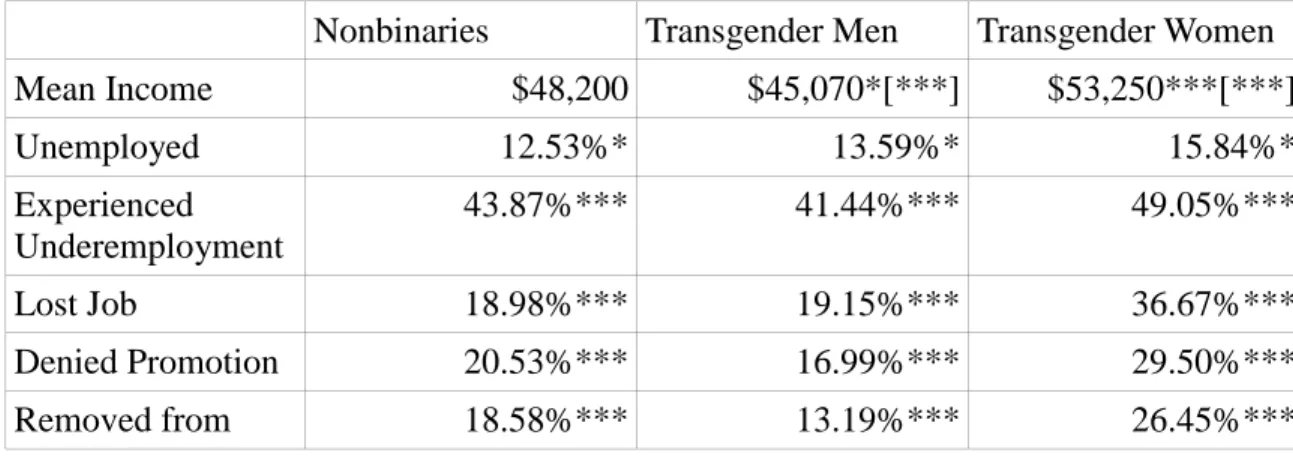
Table 6 descriptively compares nonbinaries, transgender women, and transgender men in terms of labor market outcomes.
Table 6: Labor Market Outcomes of Nonbinaries, Transgender Men, and Transgender Women (National Transgender Discrimination Survey)
Nonbinaries Transgender Men Transgender Women Mean Income $48,200 $45,070*[***] $53,250***[***] Unemployed 12.53%* 13.59%* 15.84%* Experienced Underemployment 43.87%*** 41.44%*** 49.05%*** Lost Job 18.98%*** 19.15%*** 36.67%*** Denied Promotion 20.53%*** 16.99%*** 29.50%*** Removed from 18.58%*** 13.19%*** 26.45%***
Contact
Chi-square tests for statistical significance were performed on all variables other than mean income, for which t-tests were used. For the t-tests, asterisks represent differences from nonbinaries, while asterisks in brackets represent the difference between transgender men and transgender women.
^ p < .1; * p < .05; ** p < .01; *** p < .001
Compared to nonbinaries, transgender women have higher incomes, but they also have a higher unemployment rate and experience more underemployment, job loss, denial of promotions, and removal from contact with clients, customers, or patients. Nonbinaries are more likely to have experienced underemployment, been denied a promotion or been removed from direct contact with clients or customers than transgender men. Like transgender men, nonbinaries have better outcomes than
transgender women on all measures other than income, where transgender women have higher incomes. This contrasts with Schilt's (2010) findings, but it is also the case that transgender women in this sample are older and whiter than the comparison groups. All groups of transgender people have a higher unemployment rate than the general
population. (The unemployment rate, including discouraged workers, for the United States as a whole in 2008 was 10.5% [Bureau of Labor Statistics 2011]). The regression analyses explore the magnitude of these differences, controlling for relevant demographic and human capital factors. We have already seen that these three groups tend to be more highly educated and more likely to be white than the general population, both of which tend to produce better employment outcomes.
Models
Because income is approximately normally distributed in this sample, I am able to use real income (and ordinary least squares regression) rather than logged income. Models for all other dependent variables use logistic regression. I report odds ratios (a measure of the likelihood of an event occurring). I compare among nonbinaries for each
dependent variable, focusing on outness, sex assigned at birth, and race, and I also compare nonbinaries to transgender men and to transgender women (with nonbinaries as the reference group) for each dependent variable. Each model includes outness,
appearance (appearing transgender or gender nonconforming), and sex assigned at birth. For sex assigned at birth, 0 stands for male and 1 stands for female; for outness, “not out” is the reference group, and for appearance, “not visibly transgender” is the reference
group. There is only a moderate correlation (0.38) between outness and appearance. In addition to these variables, each model also contains several demographic and human capital variables available in the NTDS dataset that typically influence
employment outcomes: education (an ordinal measure including below high school, high school, associate's degree/technical school/some college, bachelor's degree, and graduate or professional degree), race (including white, black, Latino, Asian, and other/mixed, with white as the reference group), age, and disability (yes/no). I also run models for nonbinaries that add an interaction effects between sex assigned at birth and outness.
CHAPTER V
RESULTS
This section proceeds in the order of the hypotheses. All significance values are for two-tailed tests.
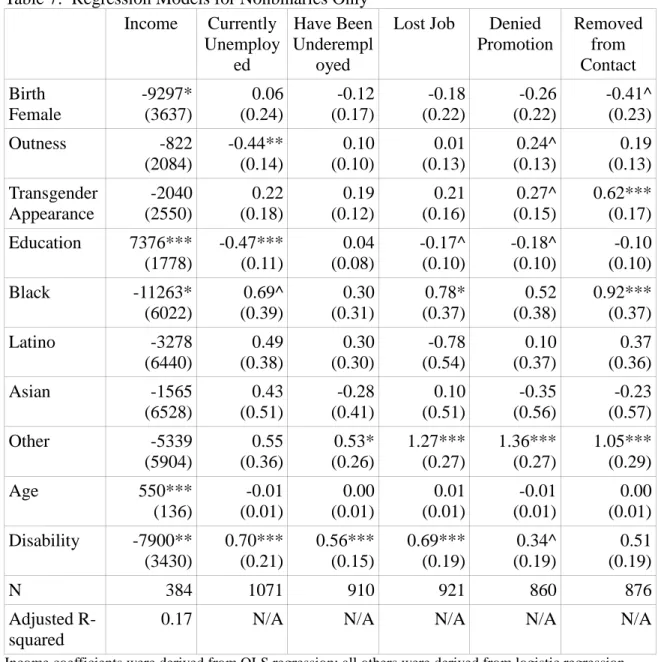
Table 7: Regression Models for Nonbinaries Only Income Currently Unemploy ed Have Been Underempl oyed
Lost Job Denied Promotion Removed from Contact Birth Female -9297* (3637) 0.06 (0.24) -0.12 (0.17) -0.18 (0.22) -0.26 (0.22) -0.41^ (0.23) Outness -822 (2084) -0.44** (0.14) 0.10 (0.10) 0.01 (0.13) 0.24^ (0.13) 0.19 (0.13) Transgender Appearance -2040 (2550) 0.22 (0.18) 0.19 (0.12) 0.21 (0.16) 0.27^ (0.15) 0.62*** (0.17) Education 7376*** (1778) -0.47*** (0.11) 0.04 (0.08) -0.17^ (0.10) -0.18^ (0.10) -0.10 (0.10) Black -11263* (6022) 0.69^ (0.39) 0.30 (0.31) 0.78* (0.37) 0.52 (0.38) 0.92*** (0.37) Latino -3278 (6440) 0.49 (0.38) 0.30 (0.30) -0.78 (0.54) 0.10 (0.37) 0.37 (0.36) Asian -1565 (6528) 0.43 (0.51) -0.28 (0.41) 0.10 (0.51) -0.35 (0.56) -0.23 (0.57) Other -5339 (5904) 0.55 (0.36) 0.53* (0.26) 1.27*** (0.27) 1.36*** (0.27) 1.05*** (0.29) Age 550*** (136) -0.01 (0.01) 0.00 (0.01) 0.01 (0.01) -0.01 (0.01) 0.00 (0.01) Disability -7900** (3430) 0.70*** (0.21) 0.56*** (0.15) 0.69*** (0.19) 0.34^ (0.19) 0.51 (0.19) N 384 1071 910 921 860 876 Adjusted R-squared
0.17 N/A N/A N/A N/A N/A
Income coefficients were derived from OLS regression; all others were derived from logistic regression. The Income column displays dollars; the other columns display log odds. Standard errors are in
parentheses.
A. Hypothesis 1
Hypothesis 1 was: nonbinaries who are open about their gender identity will encounter more negative employment outcomes compared to nonbinaries who are not open about their gender identity. There is some evidence that nonbinaries' outness influences their employment outcomes, although not all of it supports hypothesis 1. As Table 1 shows, on average, the odds ratio of being unemployed is 0.64 (corresponding to a log odds of -0.44) for each increase of one value on the three-value scale of outness (p < .01), but the odds ratio of being denied a promotion is 1.27 (corresponding to a log odds of 0.24) for each increase of one value on the three-value scale of outness (p < .1). This may mean that when employers recognize nonbinaries as a category, they are willing to employ them, though they may discriminate against them in job assignment. It may also mean that nonbinaries conceal their gender identity when applying for jobs and are penalized if they come out later on. This would concur with the fact that there was no statistically significant relationship between outness and income, underemployment, or job loss.
B. Hypothesis 2
Hypothesis 2 was: nonbinaries who were assigned male at birth will encounter more negative employment outcomes than nonbinaries who were assigned female at birth. There is conflicting evidence for this hypothesis. As Table 1 shows, the odds ratio of being removed from direct contact with clients, customers, or patients for those
assigned female at birth, compared to those assigned male at birth, is 0.66 (corresponding to a log odds of -0.41). However, some evidence contradicts hypothesis 2: as Table 1 shows, compared to nonbinaries assigned male at birth, nonbinaries assigned female at birth on average experience incomes lower by $9297 (p < .05). (A regression model
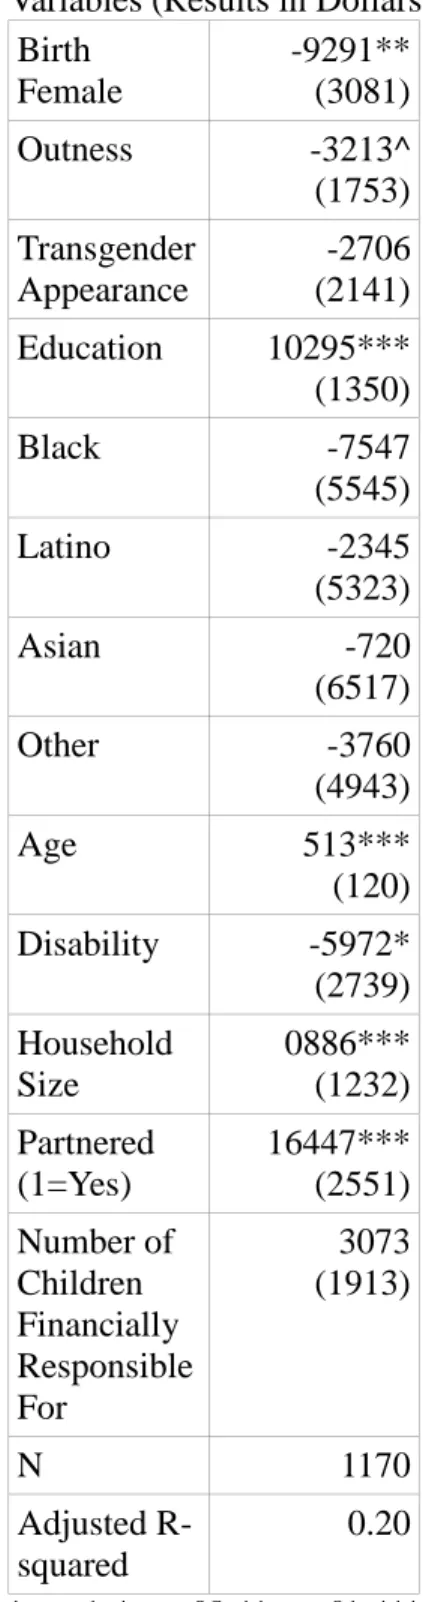
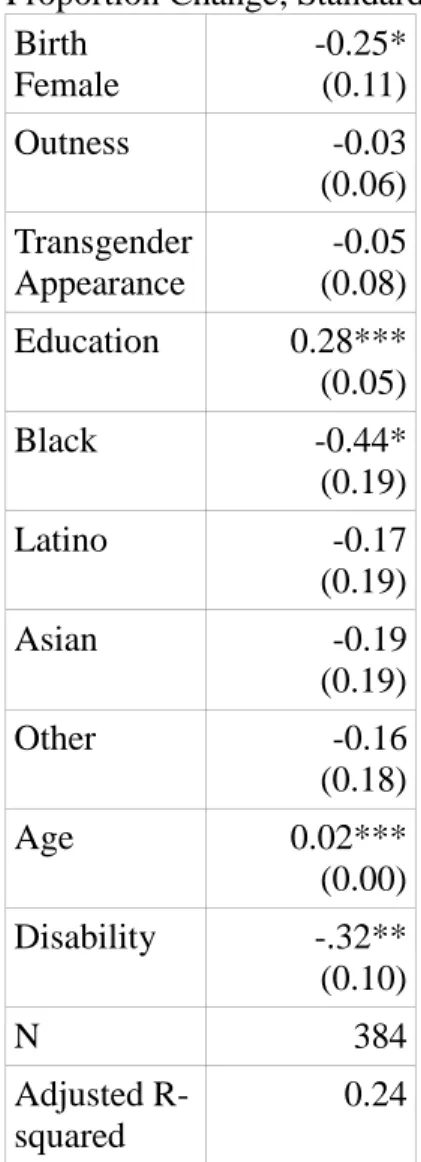
using logged income in Table A2 provides a similar result—nonbinaries assigned female at birth on average have incomes 25% lower.) The lower incomes of nonbinaries who were assigned female at birth holds when controlling for the imperfect household
composition measures (number of people in the household, whether the respondent has a partner, and whether the respondent is financially responsible for any children). These results suggest the need for future research to investigate transgender people's family relationships, including children they live with and children they pay child support for. The NTDS dataset cannot distinguish between those two categories.
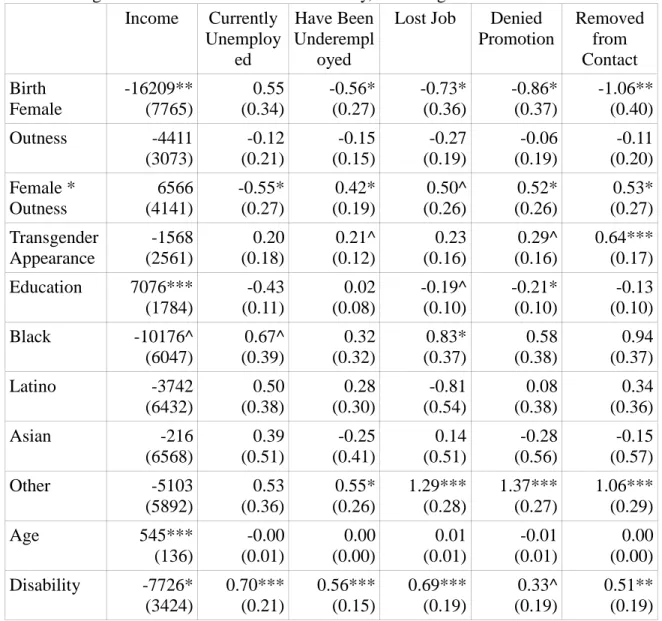
Table 8: Regression Models for Nonbinaries Only, Including Interactions Income Currently Unemploy ed Have Been Underempl oyed
Lost Job Denied Promotion Removed from Contact Birth Female -16209** (7765) 0.55 (0.34) -0.56* (0.27) -0.73* (0.36) -0.86* (0.37) -1.06** (0.40) Outness -4411 (3073) -0.12 (0.21) -0.15 (0.15) -0.27 (0.19) -0.06 (0.19) -0.11 (0.20) Female * Outness 6566 (4141) -0.55* (0.27) 0.42* (0.19) 0.50^ (0.26) 0.52* (0.26) 0.53* (0.27) Transgender Appearance -1568 (2561) 0.20 (0.18) 0.21^ (0.12) 0.23 (0.16) 0.29^ (0.16) 0.64*** (0.17) Education 7076*** (1784) -0.43 (0.11) 0.02 (0.08) -0.19^ (0.10) -0.21* (0.10) -0.13 (0.10) Black -10176^ (6047) 0.67^ (0.39) 0.32 (0.32) 0.83* (0.37) 0.58 (0.38) 0.94 (0.37) Latino -3742 (6432) 0.50 (0.38) 0.28 (0.30) -0.81 (0.54) 0.08 (0.38) 0.34 (0.36) Asian -216 (6568) 0.39 (0.51) -0.25 (0.41) 0.14 (0.51) -0.28 (0.56) -0.15 (0.57) Other -5103 (5892) 0.53 (0.36) 0.55* (0.26) 1.29*** (0.28) 1.37*** (0.27) 1.06*** (0.29) Age 545*** (136) -0.00 (0.01) 0.00 (0.00) 0.01 (0.01) -0.01 (0.01) 0.00 (0.00) Disability -7726* (3424) 0.70*** (0.21) 0.56*** (0.15) 0.69*** (0.19) 0.33^ (0.19) 0.51** (0.19)
N 384 1071 910 921 860 876 Adjusted
R-squared
0.18 N/A N/A N/A N/A N/A
Income coefficients were derived from OLS regression; all others were derived from logistic regression. The Income column displays dollars; the other columns display log odds. Standard errors are in parentheses.
^ p < .1; * p < .05; ** p < .01; *** p < .001
In an attempt to further explore the impact of outness, I investigated the
interaction between sex assigned at birth and outness, as shown in table 8. Employers' reactions to nonbinaries are highly conditioned by sex assigned at birth. Outness does not increase the odds of unemployment for nonbinaries assigned male at birth, but it is associated with substantially lower unemployment among those who were assigned female at birth. In contrast, outness does not increase the odds of underemployment, job loss, denial of promotion, or removal from contact with clients, customers, or patients for nonbinaries assigned male at birth but is associated with higher levels of those four negative employment outcomes for nonbinaries assigned female at birth. Thus outness appears to primarily contribute to discrimination in hiring for nonbinaries assigned male at birth and to discrimination while on the job for nonbinaries assigned female at birth. Specifically, the odds ratio for female*outness for unemployment is 0.58 (corresponding to a log odds of -0.55); for underemployment, 1.52 (corresponding to a log odds of 0.42); for job loss, 1.65 (corresponding to a log odds of 0.50); for denial of promotion, 1.68 (corresponding to a log odds of 0.52); and for removal from contact, 1.70 (corresponding to a log odds of 0.53). These interactions may mean that while employers are inclined to resist employing nonbinaries assigned male at birth outright, employers are inclined to police what they perceive as a rejection of femininity in a person assigned female at birth among people currently in their employment. As West and Zimmerman (1987:133) described, people often actively attempt to characterize someone as a woman or man. In
the case of nonbinaries assigned female at birth, employers may be categorizing them as women and judging them according to how well or poorly they conform to expectations for women. Nonbinaries assigned male at birth do not appear to be held to the same standards for gender conformity.
C. Hypothesis 3
Hypothesis 3 was: nonbinaries of color will encounter more negative employment outcomes than white nonbinaries. Consistent with prior research on
transgender men and women and providing support for hypothesis 3, nonbinaries of color sometimes experience worse outcomes compared to white nonbinaries. As Table 7 shows, on average, black people experience incomes lower by $11,263 (p < .05). (The regression model using logged income in Table A2 provides a similar evaluation,
showing that compared to white nonbinaries, black nonbinaries on average have incomes 44% lower.) As Table 7 shows, on average, the odds ratio of being unemployed for blacks compared to whites is 1.99 (p < .1), corresponding to a log odds of 0.69; for having lost a job, 2.18 (p < .05), corresponding to a log odds of 0.78; and for having been removed from direct contact with customers, clients, or patients, 2.51 (p < .001),
corresponding to a log odds of 0.92. On average, the odds ratio for having been
underemployed for people of mixed race or ethnicity or people of a race or ethnicity other than white, black, Latino, or Asian compared to whites is 1.70 (p < .1), corresponding to a log odds of 0.53; for having lost a job, 3.56 (p < .001), corresponding to a log odds of 1.27; for having been denied a promotion, 3.90 (p < .01), corresponding to a log odds of 1.36; and for having been removed from direct contact with customers, clients, or
patients, 2.86 (p < .001), corresponding to a log odds of 1.05. These coefficients suggest that black and mixed race nonbinaries experience racial bias.
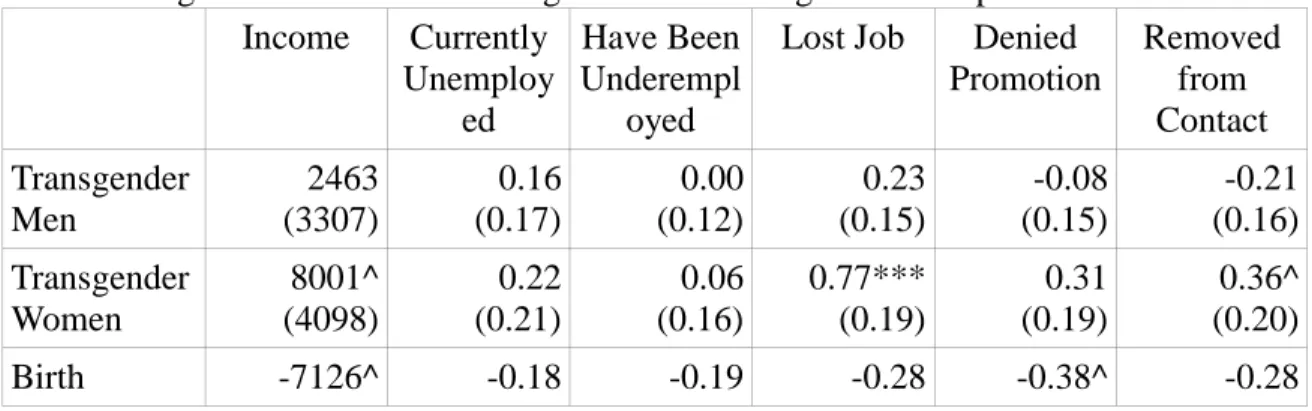
D. Hypothesis 4
Hypothesis 4 was: Transgender women will encounter more negative employment outcomes than nonbinaries. Transgender men will encounter better employment outcomes than nonbinaries. There is some evidence that nonbinaries have different outcomes compared to the other two transgender groups; some outcomes are worse for transgender women. Specifically, as shown in Table 2, on average, the odds ratio for having lost a job for transgender women compared to nonbinaries is 2.16 (p < .001), corresponding to a log odds of 0.77, and the odds ratio for having been removed from direct contact with clients, customers, or patients for transgender women compared to nonbinaries is 1.43 (p < .1), corresponding to a log odds of 0.36. Other results do not support hypothesis 4: compared to nonbinaries, on average, transgender women
experience incomes higher by $6664. This large difference is only marginally
statistically significant (p < .1). Information on what occupations and industries the three transgender groups work in (unavailable in this dataset) would improve our
understanding of why and where transgender women have higher incomes. There are no statistically significant differences between the outcomes of transgender men and
nonbinaries, suggesting again that femininity may play a role in transgender discrimination.
Table 9: Regression Models Including All Three Transgender Groups Income Currently Unemploy ed Have Been Underempl oyed
Lost Job Denied Promotion Removed from Contact Transgender Men 2463 (3307) 0.16 (0.17) 0.00 (0.12) 0.23 (0.15) -0.08 (0.15) -0.21 (0.16) Transgender Women 8001^ (4098) 0.22 (0.21) 0.06 (0.16) 0.77*** (0.19) 0.31 (0.19) 0.36^ (0.20) Birth -7126^ -0.18 -0.19 -0.28 -0.38^ -0.28
Female (4634) (0.23) (0.17) (0.21) (0.21) (0.22) Outness -13 (1212) -0.18** (0.07) 0.03* (0.05) -0.04 (0.06) 0.09 (0.06) 0.15* (0.06) Transgender Appearance -5015** (1540) 0.15^ (0.09) 0.18** (0.06) 0.06 (0.07) 0.17* (0.07) 0.20** (0.08) Education 10141*** (1035) -0.30*** (0.05) 0.06 (0.04) -0.07 (0.04) -0.03 (0.05) -0.02 (0.05) Black -3397 (4118) 0.45* (0.20) 0.07 (0.16) 0.13 (0.19) 0.07 (0.20) 0.12 (0.21) Latino -764 (4146) 0.37^ (0.20) 0.27^ (0.15) 0.07 (0.18) 0.30^ (0.18) 0.26 (0.19) Asian -1039 (4607) 0.03 (0.27) -0.37^ (0.20) -0.13 (0.24) -0.41 (0.27) -0.32 (0.28) Other -2157 (4381) 0.24 (0.22) 0.31^ (0.16) 0.69*** (0.17) 0.57** (0.18) 0.58** (0.18) Age 506*** (79) -0.01 (0.00) 0.00 (0.00) 0.00 (0.00) -0.01** (0.00) 0.00 (0.00) Disability -15129*** (2102) 0.63*** (0.11) 0.54*** (0.08) 0.57*** (0.09) 0.49*** (0.09) 0.39*** (0.10) N 1385 3837 3362 3488 3259 3316 Adjusted R-squared
0.20 N/A N/A N/A N/A N/A
Income coefficients were derived from OLS regression; all others were derived from logistic regression. The Income column displays dollars; the other columns display log odds. Standard errors are in parentheses.
CHAPTER VI
CONCLUSION
The results from this study suggest that being out at the workplace has negative effects for nonbinaries. Nonbinaries who are more out at the workplace are less likely to be unemployed but more likely to have been denied a promotion, indicating that although employers may be willing to work with nonbinaries, some are inclined to discriminate against them in access to authority. While employers appear more inclined to avoid hiring nonbinaries assigned male at birth compared to those assigned female at birth, they appear more inclined to discriminate after hire against nonbinaries assigned female at birth than those assigned male at birth once hired, suggesting that employers are inclined to police femininity. It is also possible that nonbinaries assigned male at birth and those assigned female at birth differ in their perceptions of discrimination or their willingness to report perceived discrimination, or that nonbinaries assigned male at birth are more likely to sort themselves into occupations that are less hostile to transgender people. This is unconfirmable using this dataset because there are no questions about occupation and industry, and it is always difficult to definitely observe discrimination with survey data.
The results of this study indicate that nonbinaries fare better than transgender women. Consistent with the literature on doing gender (West and Zimmerman 1987), this study has demonstrated that nonbinaries disrupt binary gender expectations through being out as a nonbinary gender identity. Although not observed in this data, it seems
reasonable to expect that this disruption leads to interactional failures, perhaps most strikingly with customers. Consistent with prior research on transgender people more generally, the results also indicate that nonbinaries of color, particularly African Americans, tend to face major challenges. The fact that nonbinaries of color have the
worst outcomes confirms that an intersectional analysis of how people do gender is necessary in order to understand how they are treated.
The fact that the three transgender groups sometimes experience the same challenges, particularly if they are people of color, indicates that some similar interventions may improve their workplace outcomes. The difficulties faced by nonbinaries and other transgender people are related to the practices and policies they come into contact with (and in the case of nonbinaries, practices and policies that deny their identity). Broader education about and recognition of nonbinaries could help put into practice effective transgender-inclusive policies. Following from Dietert and Dentice's (2009) emphasis on the importance of upper management in protecting
transgender people, businesses can do a variety of things to improve transgender people's experiences in the workplace.
Businesses can be inclusive of transgender people by evaluating their methods of recording gender, choosing to record it only when necessary and permitting people to respond with gender identity (including the option to write in a response) rather than biological sex when possible (Grant et al. 2011; Miller and Weingarten 2005; Sausa 2002). In the case of businesses with more than 100 employees (50 if federal
contractors), the EEOC currently mandates that they report employees' gender, but the EEOC only permits the options of male and female. If this were changed to provide transgender-inclusive options (adding transgender men, transgender women, and
nonbinaries), researchers may be able to investigate transgender employment inequality with more precision. This would still be an imperfect solution, because employees who are not out may not use the transgender options. If the EEOC did provide this option, it would educate employers that the category exists and is protected. Recognizing that
gender is an identity, in the same way that race is now treated as an identity, businesses could permit transgender people to change their name and gender on that institution's documentation, even if they have not done so legally (Beemyn 2005:83). Because the number of people who are likely to use transgender-specific options is small, the inclusion of these options should not pose a burden for data collection (Miller and Weingarten 2005). Businesses can include gender identity and expression on
antidiscrimination policies and implement standards for reporting transphobic incidents (Sausa 2002).
Finally, there are some things researchers can do in the future to improve our understanding of transgender people's employment outcomes. The results of this study are consistent with prior small, clinical samples of transgender people. However, it is unclear which transgender people had access to the NTDS but chose not to take it. Perhaps transgender people who have not experienced discrimination chose not to take the survey, causing the resulting sample to report more discrimination. Institutions that have the resources for large-scale or random sampling could include transgender-inclusive questions about gender (Grant et al. 2011). The size of the transgender population has been estimated at 0.3% of people (Gates 2011), so a large-scale survey with transgender-inclusive questions would be needed to provide an adequate sample size of transgender men, transgender women, and nonbinaries. Future research on
transgender people's employment outcomes would benefit from incorporating
information on transgender people's families. Research on the wage gap between men and women concludes that family structure, including having a partner and having children, can influence men's and women's salary (e.g., Blau and Kahn 2007). The NTDS is limited by having a household income question only, so future research should
investigate how transgender people of a variety of gender identities progress through the life course. Do transgender men and women follow the same patterns as cisgender men and women? And what does the life course look like for nonbinaries? Similarly, although coefficients for most control variables in my analyses were nonsignificant, the intersections between transgender status and education and disability would be useful topics for future research.
Following from Schilt and Connell's (2007) finding that transgender workers feel pressured by colleagues to abide by gender norms, researchers should also investigate how different types of gender presentation, such as masculine, feminine, mixed, and neutral, influence how transgender people are treated. Future studies should attempt to explain nuances of appearance, such as perceptions of transgender people's clothes, mannerisms, and sex assigned at birth. How do these different aspects of appearance contribute to different outcomes (or not)? Researchers could also investigate how, if at all, nonbinaries alter their gender expression for work environments. Finally, surveys regarding transgender people in the workplace should ask for information on the industry, occupation, and characteristics of employers and workplaces, such as transphobic
employers or the existence of an antidiscrimination statement. This would increase understanding of transgender people's decisions of where to work (as Tilcsik, Anteby, and Knight [2015] analyzed for gay men and lesbians).
APPENDIX
REGRESSION MODELS
Table A1: Income OLS Regression Model for Nonbinaries Only, with Additional Family Variables (Results in Dollars; Standard Errors in Parentheses)
Birth Female -9291** (3081) Outness -3213^ (1753) Transgender Appearance -2706 (2141) Education 10295*** (1350) Black -7547 (5545) Latino -2345 (5323) Asian -720 (6517) Other -3760 (4943) Age 513*** (120) Disability -5972* (2739) Household Size 0886*** (1232) Partnered (1=Yes) 16447*** (2551) Number of Children Financially Responsible For 3073 (1913) N 1170 Adjusted R-squared 0.20 ^ p < .1; * p < .05; ** p < .01; *** p < .001
Table A2: Logged Income OLS Regression Model for Nonbinaries Only (Results in Proportion Change; Standard Errors in Parentheses)
Birth Female -0.25* (0.11) Outness -0.03 (0.06) Transgender Appearance -0.05 (0.08) Education 0.28*** (0.05) Black -0.44* (0.19) Latino -0.17 (0.19) Asian -0.19 (0.19) Other -0.16 (0.18) Age 0.02*** (0.00) Disability -.32** (0.10) N 384 Adjusted R-squared 0.24 ^ p < .1; * p < .05; ** p < .01; *** p < .001
BIBLIOGRAPHY
Acker, Joan. 1990. “Hierarchies, Jobs, Bodies: A Theory of Gendered Organizations.”
Gender & Society 4(2):139-158.
Beemyn, Brett Genny. 2005. “Making Campuses More Inclusive of Transgender Students.” Journal of Gay & Lesbian Issues in Education 3(1):77-87.
Beemyn, Genny, and Susan Rankin. 2011. The Lives of Transgender People. New York: Columbia University Press.
Blau, Francine D., and Lawrence M. Kahn. 2007. “The Gender Pay Gap: Have Women Gone As Far As They Can?” Academy of Management Perspectives 21(1):7-23.
Blumstein, Philip, and Pepper Schwartz. 1983. American Couples: Money, Work, Sex.
New York: William Morrow.
Bureau of Labor Statistics. 2015. “Economic News Release: Employment Status of the Civilian Population by Race, Sex, and Age.” Retrieved March 18, 2015 from http://www.bls.gov/news.release/empsit.t02.htm.
Bureau of Labor Statistics. 2011. “Alternative Measures of Labor Underutilization for States, 2008.” Retrieved April 24, 2015 from http://www.bls.gov/lau/stalt08.htm. Connell, R.W., and James W. Messerschmidt. 2005. “Hegemonic Masculinity:
Rethinking the Concept.” Gender & Society 19:829-859.
Dietert, Michelle, and Dianne Dentice. 2009. “Gender Identity Issues and Workplace Discrimination: The Transgender Experience.” Journal of Workplace
Rights14(1):121-140.
Fausto-Sterling, Anne. 2000. Sexing the Body: Gender Politics and the Construction of Sexuality. New York, NY: Basic Books.
Grant, Jaime M., Lisa A. Mottet, Justin Tanis, Jack Harrison, Jody L. Herman, and Mara Keisling. 2011. “Injustice at Every Turn: A Report of the National Transgender Discrimination Survey.”
Harris, Benjamin Cerf. 2015. “Likely Transgender Individuals in U.S. Federal
Administrative Records and the 2010 Census.” U.S. Census Bureau Center for Administrative Records Research and Applications Working Paper 2015-03. Harrison, Jack, Jaime Grant, and Jody L. Herman. 2012. “A Gender Not Listed Here:
Genderqueers, Gender Rebels, and OtherWise in the National Transgender Discrimination Survey.” LGBTQ Policy Journal at the Harvard Kennedy School