1
Honors Project Report
Indoor asset tracking: RFID
Collin Murray
Supervised by Dr Audrey Mbogho
Seconded by Dr Hanh Le
Department of Computer Science University of Cape Town
2
Abstract
In this report we discuss the application of Radio Frequency Identification to asset tracking in a library in order to ascertain whether it is an effective wireless technology for the use of asset tracking. An RFID designed tracking system is prototyped and tested for range, accuracy and interference values in order to find strengths and weaknesses to the technology. Wi-Fi is used as a comparison to RFID and values for tests are compared between the two technologies. Conclusions are then drawn as to where RFID is suited to asset tracking, where it excels and where it requires further development. It is found that RFID is better on a smaller scale but is effective as a backup tracking system in
conjunction with Wi-Fi.
Categories and Subject Descriptors:
B.4.1 [Input/output and data communications] Receivers, Transmitters and Processors. C.0 [Computer Systems Organizations] Hardware/Software Interfaces
C.2.1 [Network Architecture and Design] Wireless Network Communications
Keywords:
3 Terminology:
RFID = Radio Frequency Identification
Wi-Fi = Wireless fidelity, network able to communicate information wirelessly Lookup table = Table designed by the fingerprinting process to store lookup data RSSI = Received signal strength indicator
Thanks and acknowledgement.
Without the following people this project would not has been a possibility. Thanks to Julian
Hulme for his advice and support with this project and for supplying the Wi-Fi results and
findings. Thanks to Dr Audrey Mbogho and Dr Hanh Le for their supervision and guidance.
Thanks to Yoann Paichard who supplied the majority of the information about RFID and
tracking systems as well as guiding this project towards its final goal. Thanks to Amal
Graafstra from rfidonline for his help in software and systems design. And finally thanks to
family and friends who supported me through this project.
4
Contents
Chapters:
1. Introduction………
7
1.1 Indoor Tracking………
8
1.2 RFID Introduction………..
9
1.3 Expected Outcomes………..
10
2. Background………
11
2.1 RFID and asset tracking………..…….………
11
2.2 Theoretical Background………..………
12
2.3 Comparison of Wireless Technologies………
14
2.4 Practical Background……….
16
3. Design & Implementation………
18
3.1 RFID Design Description………
18
3.1.1 Tags and Readers………
18
3.1.2 Coupling………
19
3.1.3 Our System and Constraints………
20
3.1.4 Where our tags differ………
21
3.2 RFID Methods………..
23
3.2.1 Triangulation………
23
3.2.1 Interference………
24
3.2.1 Fingerprinting………
24
3.2.1 Our System………
25
5
4. Testing & Results………..
28
4.1 Range……….
.29
4.2 Accuracy………
32.
4.3 Interference………..
34
5. Discussion & Comparisons………
38
5.1 Range………
38
5.2 Accuracy………
38
5.3 Interference………
39
5.3 Cost……….
39
5.5 Size………..
40
5.6 Availability & Standards………
40
5.7 Setup Time/complexity………
41
5.8 Power sources………
41
6. Conclusions………..
42
6.1 Pros and Cons………
43
6.2 Answering the important questions………
45
6.2.1 Is RFID a viable technology for asset tracking? …
45
6.2.2 How does RFID compare against Wi-Fi in a library…
45
6.3 Final Conclusion: The Combination………
46
Bibliography………
47
6
List of Figures
Table 1: Operating Frequencies of RFID
Table 2: Fingerprinting lookup table example
Figure 1: RSSI Vs Distance
Figure 2: RSSI Vs Distance with smoothing
Figure 3: Mean Square Error
Figure 4: Interference from users
Figure 5: Interference from Objects (wall)
Figure 6: Comparing RSSI of two tags
7
Chapter 1: Introduction
When this project started we were approached by a library in order to help them with a
problem. The library is fairly old and because of this had no integrated computer area for
people to work in. This was a problem as many people that frequent libraries rely on either
the computers for internet access or access to word processors to be able to continue on
write-ups etc even while researching.
The problem of building a computer area for a library is normally not too big of an issue but
the problem of creating a computer area for a library that has already been built, or in this
library’s case, has been around for many years and simply does not have the space available
for an expansion is a big problem. The solution to this problem has to be flexible so as to
allow other libraries affiliated to this library to include a similar system.
This leads to designing a system where laptops are lent out to library users for them to work
on while inside the library. This system allows users to work on the table space provided and
have access to any word processors and internet access through a wireless network in the
library. As with every system that involves lending out equipment, security is an issue.
Someone could walk out of the library with one of the laptops or forget the laptop somewhere
and be unable to find it again.
The library requires a way to track these laptops, to make sure that they are within the bounds
of the library, to make sure that they are not removed and if left somewhere by a negligent
user could be easily found. This is where we were approached, to design a system to do all of
the above.
The aim of this project, after narrowing down the search to two technologies that could
reliably track objects and have good documentation, is to compare RFID and Wi-Fi in the
field of asset tracking. The task is split between my project partner and myself and the aim of
my report is have a detailed look into the RFID system and how its strengths and weaknesses
could be used in Asset tracking, specifically in the setting of a library.
Due to the allocation of work being the two technologies themselves RFID will be explained
in more detail and have solid backup for values and data in this report while the WLAN
Wi-Fi side of things will be handled by Julian Hulme my project partner. Major differences in
compiled test data for the two technologies will be explained in order to further the
understanding of the differences between the technologies but only the background of RFID
and the description of the RFID design and implementation will be included in my report. For
a full understanding of the Wi-Fi system please refer to Julian Hulme's project report.
8
Wireless communications have been around for about 200 years [17] and is a growing field
with advancements and refinements being continuously made. While many wireless
technologies were developed for communication of data using air as a medium the field of
study is spreading out and exploring other uses. Along with breakthroughs in
communications such as bandwidth, encryption and larger ranges there are unexpected
breakthroughs such as the use of wireless technology in tracking.
Wireless tracking is the use of a wireless technology to locate an object within a certain
range as accurately as possible in order to relay that information to a display. A user
would then be able to understand that information and be able to locate items and get an
understanding of their location relative to other items.
This use of wireless technology has been investigated by projects such as Landmarc [5] and
the shopping cart project [8] and has shown to be a viable way of tracking objects. Along
with the ability to successfully track objects come the questions of how to track them, at what
scale would we be able to track them, what the drawbacks and issues would be and what
wireless technology would best fit the mold of wireless tracking.
While Wi-Fi and RFID have their pros and cons that will influence their effectiveness, as far
as we know no formal study has been compiled in the same indoor environment to compare
the two technologies with specific reference to tracking objects.
This paper intends to shed light on the important question of how Radio Frequency
Identification fits into the scheme of wireless tracking and how it compares with Wi-Fi in
various aspects such as interference, accuracy, efficiency, etc.
1.1 Indoor Tracking
Indoor tracking is a variant of wireless tracking that relies on wireless to be able to pinpoint
desired objects within a small area and track multiple objects at the same time. This provides
its own set of problems and design requirements.
When dealing with wireless tracking one of the most important aspects that need to be
discussed is the scale of the tracking. With tracking such as Taxi tracking [14-15], Radio
Frequency is used to checkpoint a truck as it passes through an area with emphasis being
placed on whether a taxi is within range of a checkpoint and not its exact position. While this
is perfect for the scenario of tracking a taxi outdoors it is not sufficient for our cause.
The tracking dealt with in this report is indoor tracking and this requires a much finer scale in
order to pinpoint items and differentiate between different items in close proximity to one
another. The main aim of the project is to devise a way of tracking laptops inside the confines
of a library and to be able to display warnings if a laptop is in danger of being stolen or lost.
This system is to act as both a monitoring and security system.
9
1.2 RFID Introduction
The two technologies to be compared for indoor tracking are Radio Frequency Identification
(known as RFID from this point onwards) and Wi-Fi 802.11, both of which are introduced
here with RFID looked over in more detail in the background section.
Picture 1: RFID Tags and Readers
RFID is a simple system based on two objects called Tags and Readers and operates on a
various different frequencies, (2.4MHz in our scenario). The tags can either be passive (they
only produce a signal when near a reader and rely on the signal produced by the reader to
power them) or active (the tags have their own battery life and produce a signal on their
own). In this project active tags are used as their range far exceeds that of passive tags
resulting in more accurate and faster reading and less overhead in the form of more readers.
These tags are attached to the laptops in the final testing.
The readers are simply base stations that read and record nearby tags, the how and why of
RFID will be explained in the design section. The main element in the project is RSSI or
Returned Signal Strength Indicator. This is a number between 0 and 255 and is based on the
signal strength of the tags. If a tag is close to a reader, the RSSI value will be high indicating
high signal strength whereas a tag further away will have lower signal strength. This is the
cornerstone of the project as RSSI can be used to calculate distance from a tag to a reader and
through a system of multiple readers, the location of a tag can be triangulated in 2 or 3
10
Picture 2: Wi-Fi Router and Card
Wi-Fi does potentially the same thing at the same frequency but on a separate band and with
different strengths and weaknesses. The wireless card on the laptop is used as the ‘Tag’ and
the wireless router itself will be the base station. This works well as the current setup in use
in the library can be extended and modified without major changes and can then be used for
both a regular wireless mesh network and a wireless tracking mesh network.
1.3 Expected Outcomes
The way in which we are approaching this project is that I will be doing the RFID side of things, including my report being on RFID. This includes the integration, design, background and testing of RFID. The Wi-Fi section will be references when comparing data in the final section.
What can be expected as a final result is not a solid conclusion that x is better than y, but a
better understanding of both systems that will allow us to see which system performs better
under different circumstances. This means that while we will have a conclusion that does not
give a definite answer as to who the 'winner' between the two systems is, we will be able to
say, for example: RFID is cheaper and is better for
this
application while WLAN
has
these
properties and is better for
this
application.
This final understanding is the main aim of the project, to get an accurate measurement of
each technology’s abilities and limitations and compare them against each other on an equal
foothold. This research will be considered successful when a fair study of each technology is
compiled along with the pros and cons of each under different circumstances and constraints.
11
Chapter 2: RFID Background
There has been a fair amount of research into the area of RFID but there is relatively little on
its use in wireless tracking. This background chapter will look at the research and
developments done into the field of RFID and many of the papers written about it.
A large portion of this research is on the refinement of RFID tracking and its use in real
world applications. The first section we look into is the background of RFID (2.1) and how it
works in the case of tracking. Section 2.2 discusses the theoretical background of RFID and
many of the issues involved with its functionality and designs. Section 2.3 looks into the
comparisons of various technologies and how they compare when used in asset tracking. The
final section 2.4 is the practical applications background of RFID and how it has been
developed and included into real work applications.
2.1 RFID & Asset Tracking
RFID is an electronic tagging technology that allows an object, place or person to be
automatically identified at distance without direct line of sight using an electromagnetic
challenge/response exchange [17]. This technology was originally designed in World War II
and has been gaining popularity in the last few years due to the extremely cheap nature of the
tags and ease of operation.
The RFID system consists of base stations called Readers and trackable tags. The readers and
tags used in this project are a freeware design from a company called
OpenBeacon
[18]. The
tags and readers are the same used in the 23
rdand 24
thChaos Communication Congress
(23C3) [18] RFID visitor tracking program which is what our project will emulate.
The tags themselves produce a unique ID number as a signal which is picked up by the base
stations. The base stations can then perform various calculations based on the signal strength,
power value and packet loss to locate the tag.
“There will be 1000 devices available for the expected 3000 guests at the conference. Each
device will transmit its unique id which can be connected to further information the user is
willing to publish. The transmitted signals will be collected by up to 25 RFID base stations
within the congress building and transferred to a data server via Ethernet.
Server based software is evaluating and estimating the positions of each visitor with an active
device based on its signal strength, occurrence and position of the receiving base station.
There will be different transmission power levels to increase the accuracy of the position
calculation. “
12
The designers created an impressive system to track people attending the conference and
produced a real-time display of locations for each person. The project write-up can be found
on their home site (
However, only in the last 4 years have RFID tags been used to track the location of items.
This stems from the nature of the RFID tag. There are two types of tags, Passive and Active.
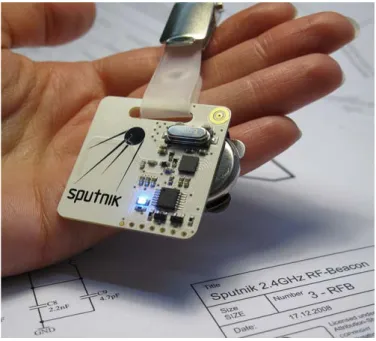
Picture 3: RFID active Tag (CCC Sputnik v2)
Passive tags respond by bouncing back the electromagnetic field created by a reader, and as
such, only work at short range (< 1 meter). Active tags have their own power source and
generate a signal like a regular radio antenna (1 – 100 meters). Both tags respond with only a
unique ID number that is programmed into that specific tag. The tags used in our system are
active tags due to the need for larger distances for tracking.
2.2 Theoretical Background
As stated earlier, RF is a system designed to identify tags, and as such, methods have been
developed to calculate the tags location. A successful method to locate a point in space is
using direction based polar calculations. The RFID based Smart Library [2] approach takes
the direction of the tag from the reader using a narrow band antenna and applies Pythagoras
rules to calculate its distance and direction from the reader. This approach is effective but
only when line of sight is not an issue. The readers have to be fine tuned and tags have to be
active, which means they require their own power cells.
13
The main problems of RFID tracking are difficult to solve [1] and include antenna
orientation, interference of walls and metallic objects, range of readers and tags, and collision
detection of readers in close proximity. However, the issue of range actually becomes the
main reason positioning works in systems such as Smart Library [2] as the signal strength
gives a good indication of the distance from the tag to the reader.
In [5], the problem of error is looked at and the application of reference points is introduced.
These points allow the error margin to be decreased as much as down to 1% in open areas,
allowing a far more accurate calculation of location. The application of these reference points
is known as fingerprinting and is explained in the Design and Implementations chapter.
A good theoretical approach to RFID tracking can be seen in the Geta Sandals paper [4]
where the distance of a person is measured by using active RFID tags. Instead of the normal
approach where the location of the RFID tag is taken in by a reader, two tags are placed on
the bottom of sandals and allow the distance of a human step to be measured. This then plots
out a virtual vector of the person’s movements as the direction of the steps are read. These
parts of data together allow a user to determine exactly where a person is in 2 dimensional
space by simply following their vector.
This approach was never implemented as there were minor flaws; the first is that there are
small errors gained during each step, and while small compared to each step, the combined
error becomes too large after long periods of time and the vector becomes inaccurate. This
problem was later solved using Reference points [5] that allow the vector to effectively reset
to 0. The second flaw was easily fixed and was caused by the incorrect values read off when
climbing stairs.
A question that arose was that of which band would be the most effective to use. A paper on
the UHF RFID [6] was of great interest as it shows error rates from multipathing increase as
environmental interference and distance increase and miss-reads from the reader are caused
by frequency fading over long distances.
Therefore, UHF is a good choice for medium distances as it has a better read rate than lower
frequencies at optimum range while lower frequencies would be better for longer range as
they would have less frequency fade over distance.
14
2.3 Comparison of Wireless technologies
The question of which technology to use was an important one. If we were to begin the
project without fully exploring the available technology that could be used we would
inevitably encounter a limiting factor that would cause many problems in the long run. The
case of what technology to use has been looked at by papers pertaining to the same system
we intend on building. One of the main papers was Landmarc’s [5] asset tracking system and
will be looked at further on.
The most important factors for a good wireless system are pointed out [7] to be low cost, low
power consumption, multi-directional reading from tag to readers, ease of implementation,
appropriate size and in our case a good indication of signal strength.
Infrared: Infrared has sufficient range for this application and is of low cost and power
consumption. It can broadcast easily to many readers at the same time and is easy to
implement as a small chip attached to the laptop and powered by a small cell.
Active Badge [8] is a system designed for asset tracking using infrared and was created at
Cambridge. This system was designed for indoor reading of RFID tags and its application is
simple. However, its weakness is line of sight. Infrared readers require line of sight to the
tags in order to locate and calculate their distance from the reader. This means we will not be
able to read the tags on the laptops if they are covered or on a lower level of the library
(double story indoor libraries need to be accommodated for).
While there are a few available methods for infrared scatter in order to ‘see’ around corners it
is too complex and expensive for the simple nature required of the project. Infrared also does
not generally support signal strength as a readable value and would be difficult to implement.
15
Ultrasonic: Ultrasonic relies on time-of-flight calculations and is successfully implemented
in the Cricket Location system [3]. This system can locate assets to within 10cm of their
position with an accuracy of 95%. However, this system requires extensive infrastructure to
become accurate enough for our application and is expensive to operate and purchase. While
the medium it uses is simple enough the required hardware and overhead infrastructure are
very complex and do not fit in well with the plan to track laptops.
The ultrasonic system relies on the time-of-flight method which works on how long the signal
takes to reach a base station and what kind of material it is traveling through. As this value
would change constantly and without a way to track this, the whole system becomes
unreliable.
Picture 5: Sonar Transceivers
RADAR: The IEEE 802.11 is a standard Radio Frequency [6] used for wireless networks and
can be modified to be used for tracking [9]. This system uses overlapping wireless networks
to supply 2 or more RSSI signal strength readings. These readings are then used to calculate
the direction and distance of the tag. The accuracy of such a system is around 3 meters with a
50% probability [5].
This technology is also known as Wi-Fi and can produce a viable tracking system if used
correctly. Wi-Fi was chosen as the technology to compare RFID to for the library’s asset
tracking and was investigated by Julian Hulme.
RFID: RFID HF/UHF [12], when compared to the other available technologies, has similar
attributes with easier to fix weaknesses. Cost is one of the major benefits of RFID, each tag is
cheap and readers are flexible when compared to other devices as they are low cost and
interchangeable. The readers themselves are not unique and can be interchanged resulting in
cheaper replacement or repairing. The tags also have very low power consumption due to the
way the tags broadcast.
16
Each CC Sputnik [18] tag has 4 levels of broadcasting power and the levels are cycled
through every few milliseconds. This leads to less power being used for the same end result.
The tags simply broadcast their signal to any surrounding readers and are not specific to
which reader they are communicating with. This approach means multiple readers can be
present in the same small area without the risk of interference from each and conversely, each
reader has the ability to read multiple tags at the same time with a quoted upper bound many
times that of the estimated number of laptops to be tracked.
For the library it is estimated that around 25 laptops would be in use at the same time. For the
testing scenario we have been provided with 4 tags and readers. This may seem like an issue
as load testing cannot be done with so few tags but this is offset by the nature of RFID. The
readers themselves can support upward of 50 tags each and the number of tags would have to
number in the hundreds to interfere with each other. This data can be seen in action from the
25C3 [18] project.
Each RFID tag is small enough to attach to a laptop and the message it broadcasts back to the
readers contains the tag’s ID, signal strength and power rating that it was broadcast at. These
values can be used to calculate position.
While RFID looks very good at face value it has a few issues of its own, but these issues are a
lot easier to mend than those in technologies looked at previously. Issues like signal
interference from real world objects and bad resolution are looked at in the design section.
These are the main types of wireless technologies that are being applied to asset tracking, and
while there are other methods being tried, they are beyond the scope of this project as they
are only experimental. One of the main types of currently working asset tracking devices
used is GPS [10], but the low resolution and inability to penetrate walls accurately causes
GPS to be unacceptable for this project. Some GPS solutions offer accuracy of up to 2cm but
the infrastructure required renders this solution not viable. [11]
2.4 Practical Background
Three of the major applications of RFID tracking are SpotOn [13], Landmarc [5] and Smart
Library [2]. All three use active RFID tags as they rely on signal strength to calculate the
location of the assets, but all three use different methods.
SpotOn uses an aggregation algorithm for three dimensional location sensing based on radio
signal strength analysis. Instead of the usual method of a central reader that measures the
signal strength of each tag and calculates the distance from the reader, SpotOn takes the
approach of reference readers
. Each reader attempts to find the location of the tag with
regards to that individual reader. Then each calculation is sent to a central database and a
final location is approximated for the asset. This approach is effective but has high initial
costs as multiple readers are needed. However, it is an accurate and precise way to track
assets.
17
When you compare this to the Landmarc[5] system, there are a few major differences. Firstly,
while Landmarc uses a similar reference system, the reference points are tags not readers.
These tags have known distance from the readers and allow the system to adjust on the fly
when measuring signal strength. If the signal strength for a known tag decreases, this is taken
into consideration when nearby tagged assets are read and allows correction of signal
strength. This method is more effective than the SpotOn [13] system as it is cheaper and
easier to install and maintain.
These two systems both rely on signal strength and have problems with interference and
signal fluctuations, while the last system relies on a different method of dimensional location.
Instead of signal strength, the Smart Library [2] system relies on signal direction read by a
directional antenna. An area is swept with two readers in narrow bands and when a tag is
picked up, its direction from the reader is recorded. Using multiple readers and the method of
tri-positioning, the location of the tag can be calculated.
There is a secondary type of system design that revolves around passive sensors, such as the
Taxi Tracking [14] and RF
2ID systems [15]. This system relies on checkpoints that read
whether a tag has gone through that checkpoint and only allows the location of tags within a
small area. While this design would work for a security check-point system, we are required
for our project to be able to locate laptops within a library at all times and the
checkpoint-system does not have sufficient resolution.
When all the papers are looked at together there is a pattern that emerges. Each paper
attempts to solve the problem of getting around the nature of the RFID tag. While RFID tags
are useful in identifying themselves, they lack the potential to provide their location. The
paper that contributed the most information to RFID tracking were Landmarc[5], Smart
Library[2], The magic of RFID[1] and the study of UHF[6]. These papers were useful due to
the unique nature in which RFID was used and supplied approaches that influenced the
design of our own system.
Each of the first 3 papers had a unique way of calculating the position of a tag and a unique
way of reducing the error involved. However, criticism could be leveled at the way Landmarc
applied reference tags. The tags were haphazardly placed around the test area and no
algorithm was used to determine optimal placement. While a grid fashion placement is
effective, a much better layout could be created by analyzing the location used for the asset
tracking and calculating the required reference tag spacing to effectively track objects.
All 4 main papers used the notion of reference tags or reference readers to mark the locations
and acquire more accurate readings. This shows the effectiveness of such a method.
18
Chapter 3: Design and Implementation
In chapter 3 we explain more about RFID and how it will be integrated into asset tracking in
our specific case. This chapter will have a more comprehensive explanation of RFID to back
up our decisions in using it and to explain how it works. This chapter also acts as a lead on
from the introduction chapter. In section 3.1 we go into detail about the design of RFID,
including the tags and readers, and explain how they interface with each other and provide
the required data to track objects. In section 3.2 we explain the methods designed for locating
and tracking objects. Section 3.3 defines the code used, the model the code is based on, the
required inputs for the program to function and the outputs required to display captured data.
Finally the design testing platform for the system is explained and a comprehensive list of
testing constraints is laid out to compare RFID to Wi-Fi in the same environment.
3.1 RFID Design Description
RFID stands for Radio Frequency identification and is a system in which objects can be
identified using radio frequency within a small to medium sized area. The system consists of
tags, readers and backend computation.
RFID works by placing a “tag” on an item. The tag is a small radio device capable of sending
information to a receiving reader. When a “reader” scans the tag it sends out a pulse of radio
energy which is intercepted by the tag and the tag sends back its unique number. This is
essentially a more powerful version of the UPC (Universal Product Code) or Bar Code.
3.1.1 Tags & Readers
The RFID tag is a simple radio device capable of broadcasting its own unique ID number. The tag is attached to objects and can be in one of two forms, active or passive. A passive tag has no external power source and obtains power from the interrogation pulse supplied by the reader.
19 Because they have no battery and simply reflect the power supplied by the reader they can effectively last forever as they have no power source to exhaust. The passive tag is little more than a loop of antenna wire and some circuitry to bounce the signal back to the reader.
Active tags have an external power source to provide a more powerful signal even without the presence of a reader. The tag operates in the same way a passive tag would, by receiving and returning a signal, but has more power therefore a larger range.
The RFID reader is a transceiver that interrogates the RFID tag to obtain a signal from it. The signal produced by the tag contains its unique ID number which is read by the reader and used to identify the tag from a list of known ID numbers.
3.1.2 Coupling
Coupling is the process in which a tag and reader communicate. This process differs between active and passive tags and is therefore named differently.
Inductive Coupling(passive tags)
The antenna of the reader generates a strong, high frequency electronic magnetic field which penetrates the cross-section of the tags antenna coil, providing electromagnetic induction in the tag. Due to the wavelength of the frequency used being several times greater than the distance between the reader and tag, the field created is a simply a magnetic alternating field influenced by the distance between the two objects (tag and reader). This is referred to as “near field coupling”.
Near field coupling occurs when a reader is close enough to a tag (roughly 1 wavelength) and produces an electric field strong enough to cause induction in the antenna coil of the tag. The tag and reader become part of a bidirectional electromagnetic system where energy can be exchanged. This energy is in turn used to power the passive tag.
Put into simpler terms, the reader gives the tag the power to operate, but only at close range (up to 30cm). If the passive tag is too far from the reader there is insufficient induction to allow the tag to transmit its signal.
Backscatter Coupling
In the case of an active tag there is no need for inductive coupling. Instead the signal produced by the reader is used to trigger effects on the tag. The interrogation signal produced by the reader’s antenna is broadcast over a large area and is picked up by the receiving antenna on the tag. This signal may be used to activate “power-down” functions on the active tag or notify the tag that the reader is in range and ready to receive. The tag then responds to the signal with its own broadcast.
20
3.1.3 Our System & constraints
The tags used in this project are the CCC Sputnik v0.1 tags and were used in the 23rd Chaos Computer Congress. They are active tags operating on a frequency of 2.4GHz, do not require line of sight and rely on the process of backscattering.
Picture 7: Operating Active CCC Sputnik tag
It is well known that Wi-Fi operates on the same frequency as RFID frequency and the question of interference between the two systems discussed in this paper needs to be addressed. Below is a summarized list of the RFID frequencies, including what type of Coupling is used on that frequency and the maximum allowed field strength for broadcasting. In the list, ISM is Industrial Scientific-Medical and SRD is short range device.
Frequency Range Frequency band + coupling Allowed signal strength
< 135kHz low frequency, inductive
coupling
72 dBµA/m 13.553 .. 13.567 MHz medium frequency (13.56 MHz,
ISM), inductive coupling, wide spread usage for contactless smartcards, smart labels and item management
60dBµA/m
433 MHz UHF (ISM), backscatter
coupling, rarely used for RFID
10 .. 100 mW 865.6 .. 868 MHz UHF (SRD), backscatter
coupling, new frequency, systems under development
500 mW ERP
2.446 .. 2.454 GHz SHF (RFID and AVI (automatic vehicle identification))
0.5 W EIRP outdoor 4 W EIRP, indoor
21 As stated earlier, our system shares an operating bandwidth of 2.4GHz with Wi-Fi. There is however very little interference between the two as they operate on slightly different subsections of the bandwidth and have different radio standards.
3.1.4 Where our tags differ:
Standard RFID tags produce just a simple unique ID when broadcasting a signal, usually 8 bits long. This leads us to an interesting problem; the standard RFID system is only designed to identify
This RSSI value is the indication of what signal strength the reader receives from the tags. For example: a tag produces the signal strength of 255 while next to a reader and when moved away this value would drop to 180. This RSSI can be mapped to a distance and the decreasing or increasing of the RSSI would map to the tag being moved further away from or closer to the reader respectively. The inverse square law can then be applied (“twice as far away = ¼ as powerful signal”) to find the distance.
tags in an area, not locate distances or calculate positions of tags. In a regular asset tracking system the readers would have to supply a RSSI (Received signal strength indication) value to provide data to calculate distance from the tags to the readers.
In conclusion, high RSSI would indicate a nearby tag while low RSSI indicates a tag further away. This would be the normal standard for asset tracking but is not the case in our system. The CCC Sputnik tags were designed to be as battery lenient as possible in order to remain operating as long as possible. The regular ID number was expanded and changed in order to create this new system. Instead of transmitting a long ID number the tags produce the following; this is a screenshot of an individual tag sending information to a reader recorded using HyperTerminal.
22 The data output from the tag is as follows:
[Tag unique ID], [Packet sequence number], [power output], [flags] Tag Unique ID:
This is the unique ID of the individual tag, in our case it is 2074, and will change for each tag. Packet Sequence Number:
This is to record which packets have been sent in order to avoid replay or packet stalling. This number changes with each packet sent from a tag.
Power output:
This is the secret behind the Sputnik’s tags success. Instead of the reader calculating the distance based on perceived RSSI it simply reads the data sent from the tag, the tag manages its own power output levels. The tag sends data at a baud rate of 115200 and swaps through 4 different power outputs. This value is [0], [85], [170] or [255] which corresponds to how much power the tag is using to broadcast the signal.
The tag transmits [0] when it’s broadcasting at 25% power output, i.e. lowest broadcasting power. Then it cycles to its second output power, output at 50% of full power or [85]. The tag then continues through the final 2 values.
This means that every 4 cycles it goes through all 4 values. If the tag is too far away the reader will not be in range of the first broadcast (i.e.: broadcasting the value [0] at 25% power). Then if it is in range of the 2nd broadcast ([85] at 50% power) it will record that value and the values at higher broadcasting powers.
In the above picture the RSSI is seen to move normally between the 4 values, 0 to 255, however towards the end the RSSI values become larger
Picture 9: HyperTerminal Output (Distancing values)
This sudden jump in signal strength is what occurs when a tag is moved out of range of the first 2 broadcasting powers (i.e.: further away from the reader). The 0 and 85 strength packets did not reach the reader; this means a higher average RSSI and indicates the tag being further away.
This unfortunately means we will only have these 4 RSSI values to work with when calculating the distance. Using a method of averaging and relying on packet loss to remove some of the packets we can refine the resolution to be quite accurate.
23
3.2 RFID Methods
3.2.1 Triangulation
The triangulation approach is a relatively straightforward technique. Three or more Reader
stations are positioned in the environment and their coordinates are recorded. If the
distance
r
from the reader to a tag can be measured, a circle with radius
r
can be drawn that
will represent the possible position where the tag is located with respect to the individual
reader. With two other base stations forming two more circles, the location of the tag can be
identified as the geometrical coincident point [4].
Picture 10: Triangulation
The triangulation technique consists of 2 steps [4]: The first step is to determine the average
signal strength over a short period of time between the 3 base stations and the tags; this is to
avoid spikes in the recorded data and allow a more consistent location. The second step is to
use the smoothed distance values from the readers to the tags and the readers known real
world position to calculate a final location for the tag.
This triangulation system works well in open areas where interference is not an issue.
However careful consideration has to be made for moving objects as constantly changing tag
readings need to be accounted for. The main advantage of this method is its on-the-fly ability
to adapt to changes in tag signal strength and that it relies heavily on the known location of
the readers. However interference is an issue.
24
3.2.2 Interference
Interference occurs when a solid object or frequency is introduced to the signal coming from
the tag that may cause false or bad readings on the reader. This would cause calculations of
location from the reader to be incorrect and lead to an incorrect final location of the tag.
Interference comes in many forms, two of the most important being wave propagation and
objective signal dampening. Wave propagation is the effect of one wave on another and
remains a problem when dealing with multiple tags due to them all operating on the same
frequency (2.4 MHz). This shouldn’t be a huge issue as it has been tested in the OpenBeacon
[18] system which is on a much larger scale.
The second problem is more serious, signal dampening. Due to the system relying heavily on
accurate RSSI to calculate the location of the tag anything modifying the signal strength in a
way that produces incorrect RSSI values is a problem. When dealing with RFID tags it may
be as simple as walking behind a wall or standing in a large group of people. This type of
interference will cause problems with triangulation as the distance value is calculated on the
signal strengths alone. Objective interference can be dealt with using a process called
fingerprinting.
Picture 11: Interference caused by wave propagation
3.2.3 Fingerprinting
Fingerprinting [19] is a system designed for locating objects in an area using signal strengths. Instead of the constant on-the-fly techniques of triangulation, fingerprinting uses a pre-setup knowledge of the area.
An area may be considered as a grid on flat ground (this works the same for 3 dimensions when using multiple readers) set up in order to map out co-ordinates. Each point on the grid will be fingerprinted to know the signal strengths from multiple readers at that point. These fingerprinting co-ordinates and RSSI values will then be stored in a type of lookup table. Once the fingerprinting is complete there will be a comprehensive list of co-ordinates mapping to signal strengths.
After the initial fingerprinting is completed the laptops can be tracked by recording the signal
strengths from the laptop’s tag to each of the surrounding readers and comparing those RSSI values to the previously set up lookup-table.
25 One of the major abilities of fingerprinting is to trouble shoot problem areas for tracking. If there is a section of the grid that is proving to be inaccurate, extra fingerprinting can be done in that area. That area will then have more points to map signal strength to and provide a finer granularity to the tracking system, effectively addressing the accuracy problem.
An example of the fingerprinting system can be seen in appendix A. In 2007 the openbeacon
development team fingerprinted a room using the same tags an readers used in this project in order to tracking visitors to the 23rd C3 conference in Berlin.
3.2.4 Our System
The system designed for the library tracking has to be robust enough to be able to track laptops anywhere inside the library while still being able to achieve an acceptable degree of accuracy. This is where a comparison between the two methods is required to determine which one should be used. Triangulation has good accuracy and would require very little initial setup time to begin tracking laptops but suffers greatly from interference. This system would work well in an empty library but when introducing interference in the form of library users the accuracy would drop and the system would become unreliable. Triangulation also normally revolves around 3 readers reading the tag’s RSSI simultaneously in order to have live streaming data and position the laptop. This may be a problem when multiple readers are needed for more accuracy or to provide a wider coverage area as data throughput to the server would become an issue and packet timing would be required to ensure that the multiple readings were from the same tag and the same tag pulse. This miss-timing problem may be solved by the packet sequence number supplied by the tag but remains an issue when waiting on data from multiple readers, effectively flooding the server’s port.
The fingerprinting system is less vulnerable to interference due to the way the co-ordinates are mapped to signal strength. If one of the readers become blocked the other readers in the area will still be able to position the laptop to within a certain degree of accuracy. This does come at a tradeoff when compared to triangulation as the system is only as accurate as the granularity of the initial fingerprinting setup. This is because of the way fingerprinting works, the RSSI from the tags are mapped to the best fitting co-ordinates by looking at the best fitting signal strength readings in the lookup table. So while there will be fewer problems with interference there is an accuracy limit created by the initial setup.
The fingerprinting system will also require more time to set up than the triangulation but when more readers are added the problem of scalability is not as large as in the triangulation system. The wave propagation interference caused by the other tags and laptops would not be a problem as the laptops Wi-Fi operate on a separate section of the band and other tags are not strong enough to provide any serious interference.
This leads us to the decision that fingerprinting would be the better option for a library situation. The lookup table would only have to be created once after the required number of readers is calculated and would be able to hold the load of interference better than the triangulation system. The fingerprinting system would also allow for future expansions better than triangulation due to its scalability.
26 The fingerprinting lookup table relies on the field of tracking to remain as constant as possible. If objects such as furniture were to be moved around or new equipment was installed the tracking area would need to be re-fingerprinted to reflect this. This is one of the shortcomings of the fingerprinting method in that it assumes the tracked area remains the same.
For the fingerprinting system there are two modes required:
Fingerprint: This mode would allow the users to fingerprint the floor of the library and create the lookup table.
Once every point has been fingerprinted there it will produce a list like the following
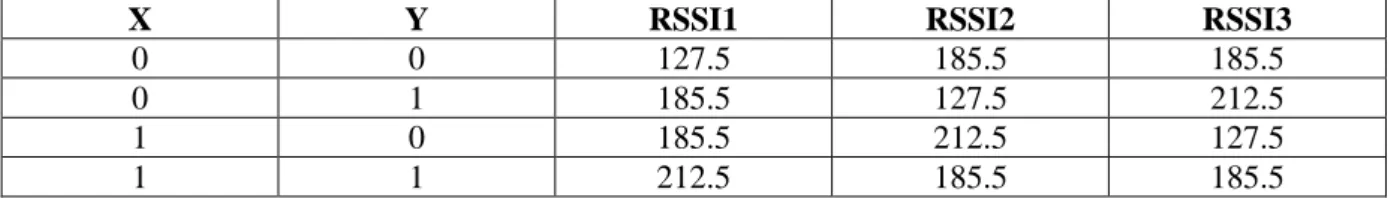
X Y RSSI1 RSSI2 RSSI3
0 0 127.5 185.5 185.5
0 1 185.5 127.5 212.5
1 0 185.5 212.5 127.5
1 1 212.5 185.5 185.5
Table 2: Fingerprinting lookup table
The X and Y values are the 2D co-ordinates on the grid and the RSSI1, 2 and 3 values are RSSI readings from the individual readers. In the above lookup table there are only 4 points to the grid and the system would look like the following.
Picture 12: Field testing setup for RFID
The first fingerprint position (0, 0) would map to the RSSI values (127.5, 185.5, 185.5) as reader1 is the closest while reader2 and 3 are equally far away. In the final system there would be many more points and co-ordinates in the table in order to store many different locations as well as many more readers to cover the larger area.
27 Locate: This mode reads from multiple readers and compares the received RSSI values to the lookup table to produce a co-ordinate.
If the recorded RSSI values from the tags over a short period averaged out to (135, 170, 170)
the tag would be closest to position (0, 0) and if the tag moved closer to position (0, 1) the
RSSI values would show this and map the tag to that position.
3.3 The Code & Testing Platforms
The coding system is designed in order to properly interface with the tags and readers and was compiled in C++. The readers connect via USB and in order to capture data from them the driver.inf file from OpenBeacon [18] has to be loaded so that the USB ports may be read as Serial (COM) ports in C++. Linux does not need this .inf file.
The final version of the code for testing purposes works on the client/server model where the server will be hosted on a server computer and the client program will be run on the computers that the readers will be connected to. These computers will serve as the reader’s connection to the main server for data capture.
The clients use TCP (winsock for windows) to connect to the server and pass the RSSI values it is currently capturing to the server to be computed for either fingerprinting or locating. Driver.cpp sets up the connection to the server while ComHandler.cpp performs the communication with the port that retrieves data from the reader.
Due to the readers being unable to process data themselves the role of the client program is to read data from the port interfacing with the multiple readers and pass data back to the server program where it is computed.
The server sets up communications with each available reader and prompts the user for a mode to run: Fingerprint: This mode allows the user to start fingerprinting the room by entering the grid locations and capturing the corresponding RSSI values.
Locate: This mode reads in the previously set up lookup file and connects to all available readers. Then the readers are prompted to begin transferring all data they are reading and pass the data back. The lookup table is then used with that data to display the calculated location of the tags.
For the testing platforms the only input or output file required is the lookup table which is stored as a simple .csv and are both run on windows (xp and vista). Windows was chosen as the platform due to it being the default operating system that would be available in a library.
28
Chapter 4: Testing & Results
In order to fully test RFID tracking the testing section was broken down into 3 main parts; Range, Accuracy and Interference testing. The testing was done in the Molly Blackburn hall at the University of Cape Town which is a wide, flat and open indoor area. This testing area was chosen as it will be the final demonstration area for this RFID project as well as being similar to a library. The hall is both tall and open with the only interference being tables and chairs that were moved aside for the experiment. This test bed provides a good area for the testing as results obtained for this “library-like” room are applicable to the type of environment that the tracking system will be deployed.
With no obstacles to interfere with the tracking, 2 laptops were used as readers with the USB RFID readers attached. A wireless LAN was then set up between the two laptops. The first laptop acted as both a reader and the server while the second laptop was the client and second reader.
As this was to be the testing ground for the two technologies the entire floor was mapped out for the fingerprinting process into a grid of 2x2 meter blocks. This required the running of the RFID client/server code in fingerprinting mode and storing each individual signal strength and meter co-ordinate. This system worked well while the Wi-Fi system was being calibrated but the fingerprinting of the RFID produced an unfortunate downfall which is explained in the Range (4.1) section below.
Picture 13: Grid Layout for testing RFID
Following the range checks the accuracy of RFID was measured by altering the position of the tags and viewing the signal strength.
29
4.1 Range
In order to have an effective system its maximum reading range needs to be known. This maximum distance enables the calculating of how many RFID readers will be needed for the final product, where the readers needs to be placed in the room and how effective the system will be as a security measure.
The range of the tags are a measurement in meters of how far away the tags can be from the readers and still provide a signal strong enough to allow for effective tracking. The range of each tag and reader was quoted at around 30 meters but was found to be much shorter.
When the 2x2 meter grid was set out in the Molly Blackburn hall it was in the region of 10 meters width and 24meters length which meant a total testing area of over 240 meters². When the RFID system was first tested the values for the tag would not change when moving from point to point on the grid. This was a scare at first but was later found to be a range issue.
If the tag is more than 4.60 meters away from the reader it does not have enough power to send a signal strong enough for the reader to pick up. This effectively limits the reading range of the tags to 4.5 meters to avoid incorrect values being sent to the reader.
In the server code the last known signal strength of a tag is stored by the server until the tag sends a new value, this is to account for tags moving out of the reading range of a reader. This value (of around 238 out of 255 signal range) remains constant if the tag is over 4.5 meters away and was providing bad data during the fingerprinting stage. Wi-Fi was able to go many times that distance away from its routers and still have strong signal.
This range issue required a new grid of fingerprinting points to be created in order to properly test the accuracy and interference of the system.
30 The second grid system was smaller in size being only 3 by 3 meters in length (i.e.: 9 grid points spaced at 1m intervals). This was now within the range of RFID and provided good points for the accuracy checks. The new grid system showed another part of RFID that was unexpected before testing which was the effect of the Inverse Square law.
Picture 15: The inverse square law
This law states that as a signal propagates from a source its strength decreases by a square of the distance traveled. This means that for a final implementation of our project it would be a good idea to allow readers to overlap their reading range in order to track laptops with better accuracy and reduce the amount of reading dead zones.
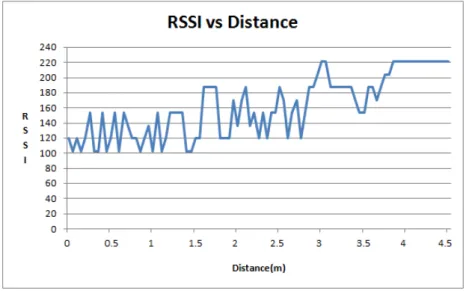
Once the test bed was set up the testing could begin. The first was the testing of the full range of the tags and how well they held their signal strength in the face of fluctuating signal and interference. Note: When reading in signal strength the 4 readings (0, 85, 175, 255) are read depending on range from the tag to reader (further away means the 0 or 85 signal strengths are not read). This means that when directly next to the reader the reader will pick up all 4 signals. This will provide an average signal strength of (0+85+170+255) / 4 = 127.5. This means our effective 0 value for our signal will be 127.5.
31 Range test: Test for range, 0.5m grid spacing, 5m total grid size, single tag, single reader, NO
smoothing.
Figure 1: RSSI Vs Distance
Figure [1] shows the fluctuation of RSSI signal from a single tag with regards to distance. This is obtained by averaging the 10 most recent RSSI readings received from the reader. It can be seen that the fluctuation is too unstable and indicates it being unsuitable for RFID tracking.
In order to reduce the effect of signal fluctuation a smoothing method needs to be applied. This method is obtained by averaging the 20 most recent results and finding the mean. This allows a more accurate display of signal strength. It can also be noted that the maximum range is shown to be just over 4 meters as the signal remaining constant indicates that no new RSSI values are being read from the tag. It is out of range of the reader.
Range Test 2: : Test for range, 0.5m grid spacing, 5m total grid size, single tag, single reader, WITH smoothing and 20 reading averaging.
32 Figure [2] shows a much smoother mapping of RSSI to distance. The ‘lag’ effect caused by the most recent 20 readings is also visible at the beginning of the graph. At first few recordings not enough readings have occurred to propagate the top 20 readings.
It can also be noted that the maximum range is slightly longer than in figure [1], this can be attributed once again to top 20 propagation and more accurate readings due to RSSI averaging requiring more readings.
4.2 Accuracy
Accuracy in the case of asset tracking is the degree of error between the real life position of an asset and the calculated position based on signal strength. The RFID system needs to be as accurate as possible to provide the users of the final system a good indication of where the laptop is. For the testing process the 3 by 3 meter fingerprinted grid set up for the range experiment was used.
When placing the tags at a point it would take between 1 and 2 seconds to start broadcasting accurate data. This was due to the code calculating signal strengths from the average of the last 20 RSSI readings, meaning that it took a small amount of time for the new signal strengths to propagate through the array of RSSI.
At the grid points the system was able to calculate the position of the tag to the exact real world location. This was due to the tags varying signal strength not being enough to cause the calculation of the server to push the values into the next grid points range. The tags would map to the correct real world points at every point on the grid with the only error being the time it takes for the server to update the tags movement through the 20 latest RSSI values.
When the tags were placed at varying distances from the grid points the effect of the fingerprinting system then became evident. The theoretical way the tags would act between two grid points would be to stay mapped to the closest point until it got to the halfway mark between two grid points. Once it passes this halfway mark the tag should then snap to the second grid point which is now closer.
33 What occurred during testing was slightly different and clearly visible in figure [1]. When the tags transmit the signal its value fluctuates by a small amount. This amount means that the final ‘overlap’ area of the grid points was larger than expected. This overlap area means that when the tag being read is between any two reference tags the fluctuating signal causes it to alternate between the two points.
Picture 17: Theoretical overlap snapping range
This overlap means that the RFID system is accurate to between 30cm to 50cm which is more than acceptable assuming that the average laptop is around the same size. This accuracy is the same throughout the 3 by 3 grid even though picture 16 shows only 2 readers.
While this method of fingerprinting allows us to detect where the asset is through snapping the calculated position to the nearest known grid point and gives us good control of error values it has a trade-off of accuracy. The system will never be more than 30-50 in error but it can also never be more than 30-50cm accurate.
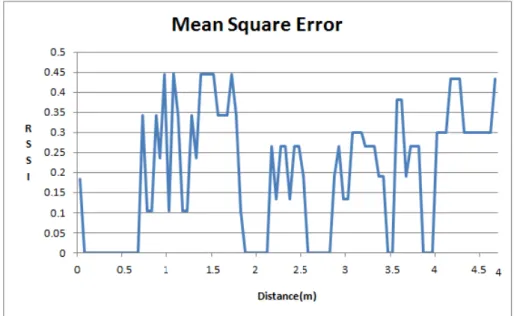
34 Accuracy Test: Test for accuracy, 0.5m grid spacing, 5m total grid size, single tag, single reader, WITH smoothing.
Figure 3: Mean Square Error
What is visible in figure [3] is the error between fingerprinted points. The algorithm used to obtain this was (Closest RSSI point – CurrentRSSI)/ (second closest fingerprint point RSSI– closest fingerprint point RSSI. This formula was needed due to the effect of the inverse square law What should happen in theory is when at a fingerprinted point such as 1, 2, 3 or 4 the value should be 0 indicating that there is no distance between the tag and the fingerprinted point.
As the tag moves away from this point the error should increase until the tag reaches midway between the two points. At this midway point between 1 and 2 the tag becomes closer to 2 and the error should drop, finally becoming 0 again when at point 2.
This should produce a rough sin graph which can be seen in figure [3]. The effect of fluctuation is evident and the graph is not smooth due to only having a 2 bit RSSI to produce results.
4.3 Interference
Interference is the effect of outside influences on the signal strength of the tag to produce incorrect readings and results. This is an important aspect of the RFID system and needs to be tested to ascertain whether interference will be a large problem. As stated earlier there are 2 main kinds of interference; wave propagation and objective signal dampening.
35
Wave propagation is the effect of other signals on the RFID signal causing packet loss or
otherwise changing the received RSSI value. This test would be as simple as adding more
signals on the same wavelength as RFID until the RSSI value obtained could be deemed
unreliable for tracking. This testing requires a large number of tags and readers and is
unfeasible due to price and availability for this project but was successfully implemented in
the CC23 conference [18] on a much larger scale than a library setting. For the purpose of our
project evaluation testing was done in a computer laboratory with multiple computers in a
closed environment and with over 4 wireless routers available for Wi-Fi connection. All 4
supplied tags were tested simultaneously but not enough interference was evident for a
conclusion to be made.
The second type of main interference, objective signal dampening, is more easily tested for.
In a library environment the main kinds of interference would be the users themselves and the
movement of bookshelves, walls, furniture, etc.
It is important to note that with the method of triangulation special care would have to be
taken with corners and walls as they would interfere with the signal providing unreliably low
RSSI and causing incorrect triangulation results. Fingerprinting does not have this error as an
area behind a wall will be fingerprinted and accepted as a bad signal area, even if close to a
reader. This is one of the main advantages of fingerprinting over triangulation.
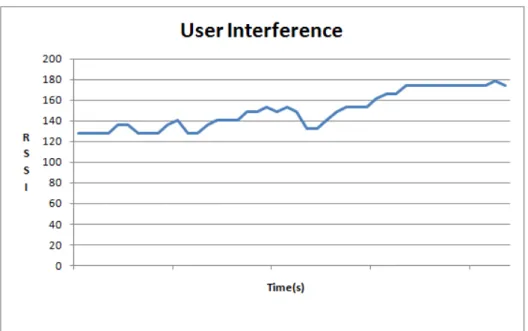
Interference Test: Test for user interference, 0.5m grid spacing, 5m total grid size, single tag, single reader, WITH smoothing.
36 In this test a tag and reader were set into a static position and the RSSI was read to be fluctuating between 136 and 148. Then users entered the room and stood between the reader and the tag. What was observed is evident in figure [4] as the RSSI value rose from its constant fluctuation of 136-148 up to values between150 to 170. This indicates a problem with interference as no more than 3 users were standing between the tag and reader at any one time.
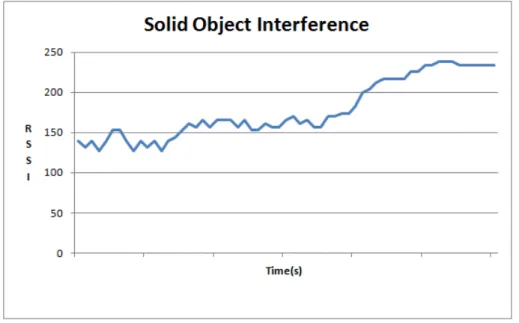
Interference Test: Test for solid object interference, 0.5m grid spacing, 5m total grid size, single tag, single reader, WITH smoothing.
Figure 5: Interference from Objects (wall)
In this test the reader and tag were again placed in a static position and a fluctuating reading was taken. This value was around 145-158. Then the tag was moved in an arc away from the reader behind a wall. The RSSI rose significantly to over 200 indicating that interference from walls and solid objects cause an unreliable RSSI value.
This amount of interference poses a problem to the system as walls would almost certainly interfere with RSSI values. This can be mitigated by strategic placement of readers and through the nature of the fingerprinting system.
One additional problem occurred when testing the tags and readers. This is the problem of different tags producing different RSSI values at the same distance away from the reader. If tag A was to be calibrated onto the system and to a certain RSSI value at 2 meters away from a reader but when tag B was used the system calculated the RSSI to be more or less than tag A at the same point this would be an issue.
To test for this problem every tag’s RSSI value was recorded and compared and the two tags with the highest mean square error were graphed together.
37 Interference Test: Test for different tag RSSI, 0.5m grid spacing, 5m total grid size, single tag, single reader, WITH smoothing
Figure 6: Comparing RSSI of two tags
What can be seen from figure [6] is that the two tags are not identical. This variation can be attributed to battery power, orientation, wiring connections inside the chip board or even the metallic makeup of the areal itself.
While the two tags RSSI values are not identical it is still within the bounds of acceptability. Tag B may have a maximum error of around 1m (as indicated by the graph) which is still acceptable for the requirement of locating laptops. During the testing phase of multiple tags the error was enough to provide slightly fluctuating results but not enough to affect the calculated position by more than a meter. This was the worst case that occurred in testing.
If this becomes a problem in a larger scale implementation of the tracking system the Fingerprint function can be upgraded to interface with a SQL database and store each individual tags RSSI lookup table.
38
Chapter 5: Discussion & Comparison
For a comprehensive study of RFID and to be able to compare it to Wi-Fi a set of sections is needed based on some of the most important aspects of asset tracking in the case of a library. These sections best reflect the needs of asset tracking and provide a good common ground to compare the two technologies.
The first 3 sections are based on the physical testing of the systems and how they compare to each other while the following sections are comparisons and discussions on other aspects of RFID with regards to Wi-Fi and tracking.
5.1 Range
The Range of RFID is an important component of the system as it influences the majority of the other aspects of the system. Range determines how far the readers and tags will reach, how many readers are required for accurate tracking, where the readers need to be placed for good constant readings, the algorithms to determine the RSSI and smooth the incoming data and the price of the entire system through the cost of multiple readers.
For RFID the range is only around 4 to 5 meters for accurate signal strength compared to Wi-Fi which is many times that. There is also a small area of bad signal at the base of the reader. When between 0 and 1 meter from the reader there is very little packet loss leading the RSSI to always be in the region of 127 RSSI.
This smaller range of 4 to 5 meters means a need for more readers in order to cover the desired area than Wi-Fi would and an increase in price. This smaller range is caused by lack of power on the tag itself and a small antenna to provide the signal from the tag.
5.2 Accuracy
Accuracy is the ability of a system to calculate the position of an object as closely to its real life position as possible and is an important aspect in asset tracking as the more accurate the tracking is the better the user will be able to locate the asset. For RFID the accuracy is between 30 to 50cm, this means that for accurate tracking the fingerprinting points need to be lain out within 1m of each other. The values produced by the tags need to be smoothed to provide reliable enough readings for the tracking, this means that there is a small delay between moving the tag and acquiring its position on the system. This delay is an acceptable amount for the accuracy trade-off.
For the purpose of asset tracking, 0.5 meter accuracy is an acceptable amount and will fulfill the needs of a laptop tracking system. Additional smoothing techniques or a higher RSSI value for the tags is required to obtain more consistent results