1
Student, Department of Electrical Engineering & Information Technology, Universitas Gadjah Mada, Jl. Grafika 2 Yogyakarta 55281 INDONESIA (tlp: 0274-555225; e-mail: [email protected])
2,3
Lecturer, Department of Electrical Engineering & Information Technology, Universitas Gadjah Mada (e-mail: [email protected], [email protected])
Study of Undersampling Method: Instance Hardness
Threshold with Various Estimators for Hate Speech
Classification
Naufal Azmi Verdikha1, Teguh Bharata Adji2, Adhistya Erna Permanasari3
Abstract—A text classification system is needed to address the
problem of hate speech in social media. However, texts of hate speech are very hard to find in social media. This will make the distribution of training data to be unbalanced (imbalanced data). Classification with imbalanced data will make a poor performance. There are several methods to solve the problem of classification with imbalanced data. One of them is undersampling with Instance Hardness Threshold (IHT) method. IHT method balances the dataset by eliminating data that are frequently misclassified. To find those data, IHT requires an estimator, which is a classifier. This research aims to compare estimators of IHT method to solve imbalanced data problem in hate speech classification using TF-IDF weighting method. This research uses the class ratio of dataset after undersampling, time of the undersampling process, and Index of Balanced Accuracy (IBA) evaluation to determine the best IHT method. The results of this research show that IHT method using the Logistic Regression (IHT(LR)) has the fastest undersampling process (1.91 s), perfectly balance dataset with the class ratio is 1:1, and has the best of IBA evaluation in all estimation process. This result makes IHT(LR) be the best method to solve the imbalanced data problem in hate speech classification.
Keywords— Hate Speech Classification, Imbalanced Data,
Instance Hardness Threshold, TF-IDF.
I. INTRODUCTION
International law has firmly established that any act which advocates hatred on the basis of nationality, race or religion, or incitement to discrimination, hostility or violence should be prohibited [1]. People who are proven to use hate speech can cause huge losses and even get a prison sentence. These laws also apply to people using hate speech on the internet and social media. Social media such Facebook and Twitter have been criticized for policies in removing hate speech content that is still considered less [2]. Therefore, it needs a text classification system that is capable of detecting hate speech in social media.
Classification system requires a training data containing hate speech texts. However, the hate speech texts in social media are hard to find which can lead the distribution of training data for the classification system to become
imbalanced. Classification using imbalanced data can cause a poor performance, even if the classifier tend to provide a better performance in the degree of accuracy. However, the classifier tends to focus on classes that have a larger data size (majority class) and will tend to ignore classes with fewer data (minority class). Furthermore, this also indicates that conventional evaluation such as the overall accuracy or error rate does not provide suitable information in the case of classification using imbalanced data [3].
There are several methods to overcome the problem of imbalanced data. Instance Hardness Threshold (IHT) is a method with resampling approach that can balance the dataset by reducing the number of data in majority class. This method also called the undersampling method. IHT selects data with a high hardness threshold [4]. Hardness indicates the likelihood of misclassification rate for each data. IHT requires a classifier to be used as an estimator in order to select the data.
There are several classifiers found in some researches that produce the best performance in text classification task. A research shows that k-Nearest Neighbors (KNN) has the best performance (accuracy) as compared to Naïve Bayes and Term-Graph to classify documents into various categories using Reuters-21578 dataset [5]. Decision Tree (DT) has the best performance (F-measure) as compared to Random Forest (RF) and KNN to solve the multi-label text classification problem for Arabic text [6]. Support Vector Machines (SVM) has the best performance (F-measure) as compared to Naïve Bayes, DT, and KNN to classify the terrorism events from the terrorism news article corpus in order to assist the Thai terrorism events extraction [7]. Logistic Regression (LR) has the best performance (accuracy, kappa and time of classification process) as compared to Bayes Net, Naïve Bayes, Simple Logistic, Decision Tree (J48 & J48 Graft), and Multi-Layer Perceptron to classify paragraph text citation for Prior Knowledge Activation [8]. All text classification task use the TF-IDF method for data text representation [5]–[8].
IHT method was used in some researches to balance datasets in the classification task. A research used several resampling methods including IHT to balance feature sets in the dataset of Magnetic Resonance Imaging for diagnosing prostate cancer [9]. There is no further explanation of what IHT estimator is used in this research. The result shows that IHT and SMOTE are performing the best on individual modality features. Another research studied a variety of resampling methods including IHT in order to improve the classification of commit messages in software repositories [10]. In that research, there is still no further explanation of what IHT estimator is used. Meanwhile, TF-IDF weighting
was used to represent data text [10]. The research shows that IHT able to balance dataset, but has the longest resampling time than the other resampling methods. The best classifier according to Geometric Mean evaluation is Multinomial Naïve Bayes (0.85) when using resampling dataset with IHT.
However, the problem in this research is there are so many classifiers that can be used as estimators of IHT to balance the dataset. Thus, this research aims to find the best estimator of IHT to solve imbalanced data problem in text classification, especially in the case of hate speech classification. The best classifiers from previous researches (KNN, DT, SVM and LR) are chosen to be IHT estimators in this research [5]–[8]. The TF-IDF method is used in this research for data text representation. This research uses the class ratio of dataset after undersampling, time of the undersampling process, and Index of Balanced Accuracy (IBA) evaluation to determine the best estimator of IHT method.
II. LITERATURE REVIEW
A. Hate Speech
There are some studies define hate speech in a variety way. A researcher has defined hate speech based on the content analysis of four dimensions: "Hate speech has specific target", "Hate speech is to incite violence or hate", "Hate speech is to attack or diminish", "Humour has a specific status" [10]. Based on those dimension, the researcher has defined hate speech as language that attack or diminishes, that incites violence or hate against groups, based on specific characteristics, such as physical appearance, religion, descent, national or ethnic origin, sexual orientation, gender identity or other, and it can occur with different linguistic styles, even in subtle forms or when humour is used.
Another researcher has defined hate speech as language that is used to expresses hatred towards a targeted group or is intended to derogatory, to humiliate, or to insult the members of the group [2]. This definition based on several laws, including Facebook and Twitter policy. People who convicted of using hate speech can often face large fines and even imprisonment.
Based on the definition of hate speech above which has a wide scope, this research used only two categories of hate speech: hate speech that contains language that used to expresses hatred towards a targeted group or the members of the group based on their race (racism) and hate speech that contains language that used to expresses hatred towards a targeted group or the members of the group based on their gender identity or other (sexism).
B. Imbalanced Data
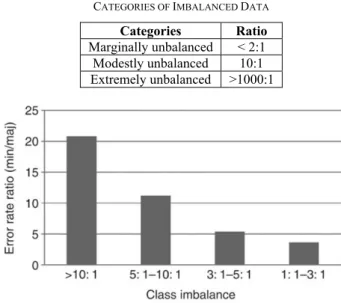
There is no exact degree of class imbalance required for a dataset to be considered as imbalanced data. However, a researcher has divided the categories of imbalanced data based on class ratios into three categories shown in Table I [11].
The impact of imbalanced data in the classification task, which is based on previous research, is shown in Fig. 1 [12].
Fig. 1 shows the impact of imbalanced data at the various ratio in the classification task. Fig. 1 shows imbalanced data
that have the ratio above 10:1 (modestly unbalanced) have error rate on minority class more than 20 times that of the error rate on the majority class, even for imbalanced data that have the ratio between 1:1 and 3:1 have a quite significant impact. It is suggested that researchers should consider the dataset that belongs to the marginally unbalanced category [12].
TABLE I
CATEGORIES OF IMBALANCED DATA
Categories Ratio
Marginally unbalanced < 2:1
Modestly unbalanced 10:1
Extremely unbalanced >1000:1
Fig. 1 Impact of imbalanced data [12].
C. Instance Hardness Threshold
Instance Hardness method was proposed in previous research [4]. Instance Hardness method used to find data in a dataset that has a property called hardness that indicates the probability of data being misclassified. Another research used Instance Hardness method in [4] to perform undersampling [13]. This undersampling method called Instances Hardness Threshold (IHT).
To perform undersampling, IHT select data with a high hardness threshold. Previous research described that the instance hardness (𝐼𝐻) are obtained from the breakdown of 𝑝 ℎ|𝑡 using Bayes’ theorem, where ℎ denotes the mapping function that maps input features to their associated labels and 𝑡 denotes the training data [9]. This function is shown in (1).
𝐼𝐻 〈𝑥 , 𝑦 〉 1 𝑝 𝑥 |𝑦 , ℎ (1)
In IHT, undersampling the data is done by removing the data with high hardness value. This process needs a classifier that trains the data using k-fold cross validation while
applying threshold when removing the data. III. EXPERIMENT AND RESULT
A. Dataset
This research uses annotated tweet dataset from previous research [14]. This dataset consists of 16,914 tweets ID. 3,383 of those tweets are annotated as sexism, 1,972 tweets are annotated as racism, and 11,559 are annotated as none (neither sexism or racism) [14]. The data retrieval process is done by
using Python module: Tweepy. Table II shows the number of data for each annotation.
There are some errors while retrieving tweets from their tweets ID. These errors are caused by several factors like the user has been suspended, no status found with that ID, etc. The total number of tweet errors is 865 tweets. Total number tweet errors and the error factors are shown in Table III.
TABLE II
DATASET AFTER DATA RETRIEVAL PROCESS
Annotation Number of Data
racism 1,970
sexism 3,378
none 11,559
Total Data 16,907
TABLE III LIST CODE OF TWEET ERROR
Code Description
Number of Tweet Errors
Code: 34 'Sorry, that page does not exist.' 15 Code: 63 'User has been suspended.' 131 Code: 144 'No status found with that ID.' 447 Code: 179 'Sorry, you are not authorized to see
this status.' 220
Failed to send request
"bad handshake: SysCallError(-1,
'Unexpected EOF')" 6
Failed to send request
HTTPSConnectionPool(host='api.twitte r.com', port=443): Read timed out. (read timeout=60) 9 Failed to send request 'Connection aborted.', OSError(""(10054, 'WSAECONNRESET')"" 1 Failed to send request 'Connection aborted.', RemoteDisconnected('Remote end closed connection without response',)
3 Failed to
send request
""bad handshake: SysCallError(10054, 'WSAECONNRESET')"" 3
Total 865
B. Pre-processing
Pre-processing tasks in this research are made by following steps below.
1. Remove tweets error.
2. Remove character letter 'b' that existed at the beginning of the data tweet. The character 'b' appears because Python version 3 reads data tweets not as a regular unicode string object but as a byte object.
3. Remove the Twitter attributes: ‘RT', ‘#', ‘@', URL link, emoticon, and HTML reference characters.
4. Remove punctuation. 5. Remove digit characters.
6. Remove empty data tweets caused by the previous process.
7. Tokenizing (unigram).
Step 1-6 are performed manually using Notepad++, while step 7 is performed using Scikit-learn [15]. There is some data
reduction caused by step 6 in pre-processing. The total number of data and features are shown in Table IV.
TABLE IV
DATASET &FEATURES AFTER PRE-PROCESSING
Annotation Total racism 1,923 sexism 3,119 none 10,701 Total Data 15,743 Total Features 15,312
C. Bag of Words (BOW) Weighting
After pre-processing has been done, this research uses Bag of Words weighting before resampling process is performed. This weighting process is performed using Scikit-learn module [15]. This weighting forms a high dimension matrix of 15,312 15,743 𝑡 𝑑 ,where 𝑡 represents the total number of features (terms) and 𝑑 represents the total number of data.
D. Undersampling using IHT
To perform undersampling using IHT, this research uses imbalanced-learn version 0.3 [13]. KNN, DT, SVM, and LR are used in the undersampling process using IHT method in this research. These classifiers are performed using Scikit-learn [15]. To avoid acronym conflict, IHT method that using KNN classifier to perform the undersampling process is abbreviated as IHT(KNN), and this also applies to IHT methods that using other classifiers. The parameters of each classifier are shown in Table V. 5-fold cross validation is used to train the data.
TABLE V PARAMETERS OF THE CLASSIFIERS Classifier Parameter KNN n_neighbors=5, weights=’uniform’, algorithm=’auto’, leaf_size=30, p=2, metric=’minkowski’, metric_params=None, n_jobs=1, **kwargs DT
criterion=’gini’, splitter=’best’, max_depth=None, min_samples_split=2, min_samples_leaf=1, min_weight_fraction_leaf=0.0, max_features=None, random_state=None, max_leaf_nodes=None, min_impurity_decrease=0.0, min_impurity_split=None, class_weight=None, presort=False SVM
C=1.0, kernel= 'linear', degree=3, gamma=’auto’, coef0=0.0, shrinking=True, probability=True, tol=0.001, cache_size=200, class_weight=None, verbose=False, max_iter=-1,
decision_function_shape=’ovr’, random_state=None
LR
penalty=’l2’, dual=False, tol=0.0001, C=1.0, fit_intercept=True, intercept_scaling=1, class_weight=None, random_state=None,
solver=’liblinear’, max_iter=100, multi_class=’ovr’, verbose=0, warm_start=False, n_jobs=1
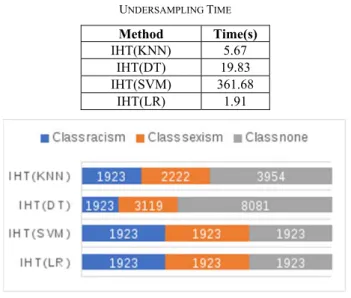
Table VI shows the time taken by IHT method using different classifiers in the undersampling process. IHT(LR) has the fastest computation time in the undersampling process
(1.91 s). IHT(SVM) has the longest computation time in the undersampling process (361.68 s). TABLE VI UNDERSAMPLING TIME Method Time(s) IHT(KNN) 5.67 IHT(DT) 19.83 IHT(SVM) 361.68 IHT(LR) 1.91
Fig. 2 Class ratio after undersampling.
Fig. 2 shows the ratio of data between classes after the undersampling process. It shows that IHT(LR) and IHT(SVM) methods are able to perfectly balance the dataset. Every data in each class has the same number or have a 1:1 class ratio. There is still an imbalance in the dataset that has been undersampling using IHT(DT). The number of data that belong to the class ‘none' is still larger than the class ‘racism’. Furthermore, there is no data reduction in the class ‘sexism’, indicating that IHT(DT) cannot find data with high hardness value in that class. The IHT(KNN) can balance the dataset better than IHT(DT). The dataset that has been undersampling using IHT(KNN) is still ‘marginally unbalance’, but IHT(KNN) is able to find data with high hardness value in the class ‘sexism’.
A. TF-IDF Weighting
After the undersampling process has been performed, the weight in the dataset is transformed into TF-IDF weighting. TF or Term Frequency weight is equal to the weight in BOW, while IDF or Inverse Document Frequency is computed with (2).
𝐼𝐷𝐹 𝑡 log 1 𝑛
1 𝑑𝑓 𝑑, 𝑡 1 (2)
where 𝑛 is the total number of documents, and 𝑑𝑓 𝑑, 𝑡 is the number of documents that contain features or terms 𝑡. Then to find the weight of TF-IDF (𝑊) is obtained with (3).
𝑊 𝑡 𝑇𝐹 𝑡, 𝑑 𝐼𝐷𝐹 𝑡 (3)
The resulting TF-IDF vectors are then normalized by Euclidean norm (4).
𝑣 𝑣
𝑣 𝑣 ⋯ 𝑣 (4)
B. Estimation & Evaluation
The estimation process in this research uses the same classifiers in the undersampling process employing IHT method. Each of the classifiers in the estimation process uses the same parameters as of the undersampling process.
Index Balanced Accuracy (IBA) evaluation is used to measure the performance of the classifiers in the estimation process [16]. IBA evaluates the performance not only deals with overall accuracy but also aims to support classifiers with better results in minority class. IBA can be calculated using (5).
𝐼𝐵𝐴 1 𝛼. 𝐷𝑜𝑚𝑖𝑛𝑎𝑛𝑐𝑒 . 𝐺𝑚𝑒𝑎𝑛 (5)
where Dominance is defined as (6)
𝐷𝑜𝑚𝑖𝑛𝑎𝑛𝑐𝑒 𝑆𝑒𝑛𝑠𝑖𝑡𝑖𝑣𝑖𝑡𝑦 𝑆𝑝𝑒𝑐𝑖𝑓𝑖𝑐𝑖𝑡𝑦 (6)
and Geometrics Mean (𝐺𝑚𝑒𝑎𝑛) is defined as (7)
𝐺𝑚𝑒𝑎𝑛 𝑆𝑒𝑛𝑠𝑖𝑡𝑖𝑣𝑖𝑡𝑦 𝑆𝑝𝑒𝑐𝑖𝑓𝑖𝑐𝑖𝑡𝑦 (7)
This research uses ∝ 0.1. All estimation processes in this research use 10-fold cross validation.
Table VII shows evaluation results of the entire estimation process, including estimation using the original dataset (undersampling method = ‘None'). Overall result shows that all IHT methods are able to improve all classification performance. The estimation process using KNN classifier has the best IBA improvement when using the dataset from the undersampling process of IHT(LR) method, with IBA = 0.77 that gives 143.75% improvement from the IBA value of the classification using original dataset. This estimation process has the lowest improvement when using the dataset from the undersampling process of IHT(DT) method (56.03% IBA improvement).
IBA evaluation in estimation process using DT classifier has the highest result when using the dataset from the undersampling process employing IHT(LR) (IBA = 0.78 and 45% IBA improvement), and the lowest IBA improvement is obtained when the estimation process using the dataset from the undersampling process employing IHT(KNN), which is 15.75% IBA improvement. The highest IBA evaluation in the estimation process using SVM classifier is 0.93 with 66% IBA improvement when using the dataset from the undersampling process employing IHT(LR), and the lowest IBA improvement is obtained when the estimation process using the dataset from the undersampling process employing IHT(DT) (IBA = 0.66 and 18.74% IBA improvement). The highest IBA evaluation in estimation process using LR classifier is 0.88 with 80% IBA improvement when using the dataset from the undersampling process employing IHT(LR), and the lowest IBA improvement is obtained when the estimation process using the dataset from the undersampling process employing IHT(DT) (IBA = 0.58 and 19.70% IBA improvement).
Fig. 3 shows the overall IBA evaluation. The highest IBA evaluation in all estimation process is obtained by SVM classifier using the dataset from the undersampling process employing IHT(LR). The lowest IBA evaluation in all estimation process is obtained by KNN classifier using the dataset from the undersampling process employing IHT(DT).
TABLE VII EVALUATION RESULTS
Classifier Undersampling Method Sensitivity Specificity G-Mean IBA IBA Improvement (%)
KNN None 0.45 0.72 0.57 0.31 - IHT(KNN) 0.66 0.82 0.74 0.54 70.11 IHT(DT) 0.62 0.80 0.71 0.49 56.03 IHT(SVM) 0.82 0.91 0.87 0.74 136.05 IHT(LR) 0.84 0.92 0.88 0.77 143.75 DT None 0.67 0.81 0.74 0.53 - IHT(KNN) 0.73 0.86 0.79 0.62 15.75 IHT(DT) 0.77 0.87 0.82 0.67 25.06 IHT(SVM) 0.83 0.91 0.87 0.75 40.50 IHT(LR) 0.85 0.92 0.89 0.78 45.82 SVM None 0.68 0.83 0.75 0.56 - IHT(KNN) 0.79 0.89 0.84 0.70 25.28 IHT(DT) 0.77 0.87 0.82 0.66 18.74 IHT(SVM) 0.93 0.96 0.95 0.89 60.64 IHT(LR) 0.95 0.98 0.96 0.93 66.64 LR None 0.62 0.80 0.70 0.49 - IHT(KNN) 0.75 0.87 0.81 0.64 32.82 IHT(DT) 0.70 0.84 0.77 0.58 19.70 IHT(SVM) 0.89 0.94 0.91 0.83 71.19 IHT(LR) 0.92 0.96 0.94 0.88 80.85
Fig. 3 Diagram of IBA evaluation.
IV. CONCLUSION
This research has applied a variety estimators of IHT undersampling method in order to improve the performance of hate speech classification. All IHT method with difference classifiers can improve the performance. The highest IBA improvement is obtained when estimated using KNN classifier and dataset from undersampling employing IHT(LR). However, the highest IBA evaluation in all estimation process is obtained when using SVM classifier and dataset from undersampling employing IHT(LR). IHT(LR) method has the highest IBA evaluation in all estimation process, outperform other IHT methods in this research. Furthermore, IHT(LR) has
the fastest undersampling time than other methods and able to balance dataset with class ratio 1:1. According to this results, IHT(LR) becomes the best method to solve imbalanced data problem in hate speech classification.
REFERENCES
[1] (2017) “International Covenant on Civil and Political Rights.” [Online], http://www.ohchr.org/en/professionalinterest/pages/ccpr.aspx, Accessed date: 15-Nov-2017.
[2] T. Davidson, D. Warmsley, M. Macy, and I. Weber, “Automated Hate Speech Detection and the Problem of Offensive Language,” Proceedings of the 11th International AAAI Conference on Web and Social Media, vol. abs/1703.04009, 2017, pp. 512-515.
[3] H. He and E. A. Garcia, “Learning from Imbalanced Data,” IEEE Trans.
0,00 0,10 0,20 0,30 0,40 0,50 0,60 0,70 0,80 0,90 1,00 None IHT(KNN ) IHT(DT) IHT(SVM) IHT(LR) None IHT(KNN ) IHT(DT) IHT(SVM) IHT(LR) None IHT(KNN ) IHT(DT) IHT(SVM) IHT(LR) None IHT(KNN ) IHT(DT) IHT(SVM) IHT(LR) KNN DT SVM LR IBA Value Classifiers
IBA Evaluation
Knowl. Data Eng., Vol. 21, No. 9, pp. 1263–1284, 2009.
[4] M. R. Smith, T. Martinez, and C. Giraud-Carrier, “An Instance Level Analysis of Data Complexity,” Mach. Learn., Vol. 95, No. 2, pp. 225– 256, 2014.
[5] V. Bijalwan, V. Kumar, P. Kumari, and J. Pascual, “KNN based Machine Learning Approach for Text and Document Mining,” Int. J. Database Theory Appl., Vol. 7, No. 1, pp. 61–70, Feb. 2014.
[6] M. A. Shehab, O. Badarneh, M. Al-Ayyoub, and Y. Jararweh, “A Supervised Approach for Multi-Label Classification of Arabic News Articles,” Proc. - CSIT 2016 2016 7th Int. Conf. Comput. Sci. Inf. Technol., 2016, pp. 1–6.
[7] U. Inyaem, P. Meesad, and C. Haruechaiyasak, “Named-entity Techniques for Terrorism Event Extraction and Classification,” 2009 8th Int. Symp. Nat. Lang. Process. SNLP ’09, 2009, pp. 175–179. [8] F. A. Wenando, T. B. Adji, and I. Ardiyanto, “Text Classification to
Detect Student Level of Understanding in Prior Knowledge Activation Process,” Adv. Sci. Lett., Vol. 23, No. 3, pp. 2285–2287, Mar. 2017. [9] G. Lemaitre, “Computer-Aided Diagnosis for Prostate Cancer using
Multi-Parametric Magnetic Resonance Imaging,” Doctoral Thesis, Universitat de Girona, Girona, Catalonia, Spain, Nov. 2016.
[10] P. Fortuna, “Automatic Detection of Hate Speech in Text : An Overview of the Topic and Dataset Annotation with Hierarchical Classes,”
Dissertation, Universidade do Porto, Porto, Portugal, Jun. 2017. [11] G. M. Weiss, “Foundations of Imbalanced Learning,” in Imbalanced
Learning, Hoboken, NJ, USA: John Wiley & Sons, Inc., 2013, pp. 13– 41.
[12] G. M. Weiss and F. J. Provost, “Learning When Training Data are Costly: The Effect of Class Distribution on Tree Induction.,” J. Artif. Intell. Res., Vol. 19, pp. 315–354, 2003.
[13] G. Lemaitre, F. Nogueira, and C. K. Aridas, “Imbalanced-learn: A Python Toolbox to Tackle the Curse of Imbalanced Datasets in Machine Learning,” CoRR, Vol. abs/1609.0, pp. 1–5, 2016.
[14] Z. Waseem and D. Hovy, “Hateful Symbols or Hateful People? Predictive Features for Hate Speech Detection on Twitter,” Proc. NAACL Student Res. Work, 2016, pp. 88–93.
[15] F. Pedregosa, G. Varoquaux, A. Gramfort, V. Michel, B. Thirion, O. Grisel, M. Blondel, P. Prettenhofer, R. Weiss, V. Dubourg, J. Vanderplas, A. Passos, D. Cournapeau, M. Brucher, M. Perrot, and E. Duchesnay, “Scikit-learn: Machine Learning in Python,” J. Mach. Learn. Res., Vol. 12, pp. 2825–2830, 2011.
[16] V. García, R. A. Mollineda, and J. S. Sánchez, “Index of Balanced Accuracy: A Performance Measure for Skewed Class Distributions,” in Pattern Recognition and Image Analysis: Proceedings of 4th Iberian Conference (IbPRIA 2009), 2009, pp. 441–448.