Financial Performance of Microfinance Institutions-A Macroeconomic and Institutional Perspective
29
0
0
Full text
(2) Financial Performance of Microfinance Institutions-A Macroeconomic and Institutional Perspective Katsushi S. Imai Economics, School of Social Sciences, University of Manchester, UK & Research Institute for Economics and Business Administration, Kobe University, Japan, Raghav Gaiha Faculty of Management Studies, University of Delhi, India Ganesh Thapa International Fund for Agricultural Development, Italy Samuel Kobina Annim* Lancashire Business School, University of Central Lancashire, UK & Department of Economics, University of Cape Coast, Ghana Aditi Gupta Yes Bank, Mumbai Abstract This study investigates the effect of both institutional factors and the macro economy on the financial performance of MFIs. Drawing upon the Microfinance Information Exchange data and cross-country data on macro economy, finance and institutions, we use three stage least squares and Hausman-Taylor to take account of endogeneity. We find that institutional factors affect MFIs’ financial performance, in particular, profitability, operating expense, and portfolio quality. Also, GDP and share of domestic credit to GDP have positive impacts on MFIs’ financial performance. Hence policies to raise country-level institutional qualities are required for making the activities of MFIs sustainable.. Keywords Microfinance, Financial Performance, Macro economy and Institutions. *Corresponding Author: skannim@uclan.ac.uk or skannim@gmail.com. Acknowledgements This study was sponsored by the Asia and Pacific Division of IFAD. It was carried out under the overall guidance of its Director, T. Elhaut, We are grateful for his guidance at all stages. The views expressed are, however, personal.. 1.
(3) Financial Performance of Microfinance Institutions-A Macroeconomic and Institutional Perspective. 1.. Introduction The financial crisis that started as early as September 2007, with the global money. markets threatening to bring down Northern Rock-the fifth largest mortgage lender in Britainhas put the strength of the financial markets across the world to a serious test. Sophisticated financial instruments and lack of regulation have undermined the stability of not just corporations but entire nations. The meltdown that came to the surface nearly four years ago has still not run its course- evidenced by the recent debt default crises in major European economies such as Greece, Spain, Portugal, Italy and Ireland. In a world with a high degree of financial integration, the events of September 2008, when Lehman Brothers filed for bankruptcy and Merrill Lynch was sold to Bank of America, did not only change the shape of American finance but that of the world economy at large. While academics continue to grapple with the finance-macro economy nexus, some policy makers and practitioners would argue that institutional factors and government regulation play a bigger and more proactive role than the fundamentals of macro economy in determining the operations and performances of the financial market as well as financial institutions. Also, the relationship between the financial operations and the macro economy will depend on characteristics of financial sub-sectors (bank-like, stock and microfinance) under consideration. This paper focuses on the effects of institutional factors as well as the fundamentals of macro-economy on the microfinance sector in view of the recent evidence on the role of microfinance in reducing poverty at both the household and national level (Imai et al. 2010a, 2010b). Unlike the studies by Cull et al. (2007) and Hermes and Lensink (2007) which measured performance of microfinance institutions (MFIs) in terms of their ‘general’ 2.
(4) objectives covering social (e.g. poverty reduction and gender equality) as well as financial ones, this paper follows the path of Gonzalez (2007) and Ahlin et al. (2011) to examine different dimensions of financial performance disaggregated and narrowly defined. The latter approach is justified as it will provide a yardstick by which we estimate the potential of integrating the microfinance sector into the economy-wide financial sector. In this paper, we examine financial performance using five specific indicators namely, return on assets, debtto-equity, operating expense, portfolio at risk and write-off ratios. Our paper is motivated by Gonzalez (2007) and Ahlin et al. (2011) who empirically showed that macroeconomic or macro institutional factors (e.g. growth of GNI per capita or political stability and voice and accountability) yield slower growth and higher default rates among MFIs. These findings suggest that in an era of global economic turmoil, microfinance lacks the capability to turn around the downturn. In view of the ripple effects of the crisis, it is particularly imperative to investigate the effects of macroeconomic and institutional factors on the financial performance of MFIs. The empirical literature on the relationship between financial performance of MFIs and the macro-economy can be viewed from a bi-causal perspective, that is, the financial performance of MFIs influences the macro economy (Krauss and Walter 2009; Imai et al 2010b) and/or the latter affects the former (Ahlin and Lin 2006, Ahlin et al. 2011, Thapa 2008). This potential bi-causal relationship requires a careful treatment of endogeneity. Further to the potential bi-causal relationship, the literature on the link between MFIs’ financial performances and the macro economy provides evidence of both pro-cyclical (e.g. in Bolivia, Marconi and Mosley, 2006) and counter-cyclical (e.g. in Indonesia, Patten et al., 2001) effects. The counter-cyclical effect suggests that investment through microfinance cancels out the other countervailing factors that bear on investment (Marconi and Mosley, 3.
(5) 2006). This is consistent with Galema et al. (2011) who used mean-variance spanning tests and showed that investment in microfinance has a diversification effect on the portfolio of investors. Krauss and Walter (2009) also examined microfinance as a means of reducing portfolio volatility, regressing key fundamental parameters and ratios of the leading MFIs against the S&P 500, MSCI Global and MSCI Emerging Markets indices (as proxies for global market risk) as well as against domestic GDP (as a proxy for domestic market risk). They consider the relative market risk, comparing MFIs to other potential emerging market investments – equities of listed emerging market institutions (EMIs) and equities of listed emerging market commercial banks (EMCBs). Their results show highly significant differences between MFIs and EMIs / EMCBs regarding asset sensitivity against all three global performance measures. A 10% drop in the S&P 500, for example, is expected to lead to no impact on MFIs in terms of the asset measure, whereas EMIs and EMCBs are expected to lose approximately 4%-5% of their asset value. Furthermore, both profitability and loan portfolio quality of MFIs seem to be less sensitive to global market movements than in the case of EMCBs. However, the findings from the Microfinance Banana Skins Survey conducted by CFI and CGAP in April 2009 reveal quite a diverging picture from the field. The economic crisis has completely transformed perceptions of the microfinance risk landscape: risks that were thought minor in a similar survey in 2008 have propelled to the top of the rankings, edging out risks that were previously seen as crucial to the prospects of microfinance. The biggest risers in this survey compared to the previous one, highlight the worsening business environment and threats to funding and liquidity. Many respondents fear a vicious cycle here: the recession creating a worse business environment leading to mounting delinquencies and. 4.
(6) shrinking markets, leading to declining profitability, loss of investor confidence, and then to cutbacks in funding and so on. Ahlin et al. (2011) examine the determinants of performances of MFIs where variables, such as self-sufficiency, borrower growth, or loan-size growth, are estimated by macroeconomic variables as well as macro-institutional factors, such as corruption control. Their paper relies on the Microfinance Information Exchange (MIX) data for the MFI specific variables. One of their main conclusions include that MFIs’ performance is not necessarily good or sometimes worse in the country where institutions are more advanced. However, one of the limitations in Ahlin et al. (2011) is that they do not take account of endogeneity of key explanatory variables, including macro-institutional factors. To overcome the limitations in Ahlin et al. (2011), the present study uses three stage least squares (3SLS) and Hausman-Taylor (HT) panel estimation to take account of the endogeneity of key explanatory variables, including institutional factors. We find that income, share of domestic credit to GDP and institutional factors, namely, control of corruption, the rule of law, voice and accountability and political stability improve MFIs’ financial performance. In three of the four perspectives (profitability, asset/liability management, efficiency and portfolio quality) of MFIs financial performance, most of the institutional factors show a positive impact (either maximizing or minimizing) on the financial performance indicator in question. The rest of the paper is structured as follows. The next section further explores why macro-institutional qualities would affect performances of MFIs to motivate our empirical analysis. Section 3 discusses the data and the variables to be used for the present study. Sections 4 and 5 provide econometric specifications and the main results. Conclusions from a broad policy perspective are offered in the final section.. 5.
(7) 2. How can macro institutions affect financial performances of MFIs? To motivate our econometric analyses in the later sections, this section provides brief explanations of how macro-level institutional qualities would affect financial performances of MFIs drawing upon the literature on the link between institutions and development of financial and banking sectors. To our knowledge, there have been no theoretical works to date to underpin the effect of macro economic or institutional context on the performance of MFIs.1 Empirical evidence is also scarce, mixed and sometimes counter-intuitive (Ahlin et al. 2011, Assefa et al., 2010 and Cuevas, 1996) both across countries and within a country. However, there is a large literature to link the macro-institutions (e.g. corruption, legal system, social and political institutions) and the banking sector or general financial development (e.g. Weill, 2011; Huang, 2010). Weill (2011) empirically showed that corruption reduces bank lending at macro levels, but it could alleviate firms’ financing obstacles at micro levels.. 2. Weill argued that corruption would make difficult law. enforcements of bank credit through the weakened functioning of court or public administration. Because MFIs have to operate within the country’s regulation of the financial sector, Weill’s results suggest that corruption could undermine the functioning of legal systems and reduce micro-lending or affect performances of MFIs. While there are direct effects of corrupted activities of MFIs on their performance at micro levels,3 regulations of microfinance and of the financial sector or a broader legal framework at macro levels would serve as a precondition for MFI’s financial performances. Meagher et al. (2006) carried out in. 1. Ahlin and Jiang (2008) have developed a theoretical model to examine the opposite direction of causality, that is, from microfinance to the macro-economy. They showed that microcredit can raise or lower long-run GDP as it can lower either substance or industrial technologies, while microcredit lowers poverty or inequality in the long run. A future study should develop a model that examines how macro-economic environment or institutions would affect microfinance performance. 2 As suggested by Weill (2011), an insightful theoretical model on this is virtually non-existent. 3 For instance, IRIN (2009) reported that local NGOs subcontracted by an international investor take bribes from borrowers in Benin. 6.
(8) depth comparative study of microfinance regulation of seven countries4 and concluded that the extent to which the government ensures the legal and regulatory framework sufficiently adapted to existing microfinance models and methods is key to better performance of MFIs in the country. In Bolivia and Brazil where microfinance sector grew rapidly, the existing legal framework served as the basis for elaborating the regulations for MFIs, while Mexico pursued its microfinance reform through legislative action (Meagher et al., 2006). However, Marconi and Mosley (2006) showed in the context of Bolivia during the crisis in 1998–2004 that government policies were counterproductive for the development of microfinance sector. Llanto et al. (1997) concluded that in the Philippine it was necessary for the government to bring microfinance under a supervisory and regulatory framework for building the institutional capacity of MFIs, which would affect their financial performance. However, Cuevas (1996) say that regulating all MFIs is not necessarily the right option. For this reason, we surmise that it is the MFI’s, nature of evolution orientation and desired growth path (graduation, downscaling, formalization and so on) of the MFI that should inform the role of enabling institutions. On the other hand, Huang (2011) showed that democratic process is important for institutional improvement on financial development, particularly among low income countries as, for example, democracy promotes property rights protection and contract enforcement and discourages corruption. As microfinance involves a contractual process and, in particular, group lending is only effective where women are willing to form a group to initiate a project, the link between general and financial performance of MFIs and democracy or political stability cannot be ignored. Thus, Huang’s (2011) argument is likely to apply to the microfinance sector.. 4. These are Bolivia, Brazil, Ghana, Indonesia, Mexico, Philippines, and South Africa. 7.
(9) It should be noted however, that causality from macro-institutions, such as a regulatory framework, to the financial performances of MFIs is likely to be complex as complying with regulation can be costly (Cull et al., 2011). Cull et al. found that profit oriented MFIs respond to supervision by maintaining profit rates but curtailing outreach, while MFIs with a weaker commercial focus instead tend to reduce profitability. Despite the complexity, it is safe to conclude that better macro-institutions (e.g. in terms of control of corruption, a legal and regulatory framework, social and political institutions) are likely to serve as distal factors that work through proximate factors, such as competition and board operations to enhance better institutional capacities and financial performances of MFIs. This prediction is tested in subsequent sections.. 3.. Data and Variables. This study uses secondary data from multiple sources. These are (i) the MIX market; (ii) the World Bank’s World Development and Governance Indicators; (iii) Chinn and Ito (2006) index of capital account openness as a measure of financial openness; and (iv) European settler’s mortality rate in the 15th century, based on Acemoglu, Johnson, and Robinson (2001, 2002, and 2005). We use Chinn-Ito index as an instrument for the share of domestic credit to GDP and the European settler’s mortality rate for the institutional factors. Other instruments include log of the lag of agricultural value added per worker and its square and an index of MFIs’ gross loan portfolio, number of MFIs and number of active borrowers. The choice of the respective instruments namely; European settlers’ mortality rate, financial openness, agriculture value per worker and [(gross loan portfolio /number of active borrowers) X number of MFIs] used for the potential endogenous variables, that is, institutional factors, share of domestic credit to GDP, GDP and gross loan portfolio (GLP) is 8.
(10) informed by the following intuitive argument and statistical evidence (see Appendix for results). In the case of European settlers’ mortality rate as an instrument for institutional factors, Acemoglu et al. (2001 and 2002) propose a theory of institutional differences among countries colonized by Europeans. In their seminal papers, they find strong evidence of a positive relationship between evolution and characteristics of existing institutions and nature of colonization. Financial openness is used as an instrument for the share of domestic credit to GDP as a higher level of financial openness (e.g. capital account openness) spurs on equity market development thereby enhancing financial deepening (Baltagi et al., 2009; Imai et al., 2010c). The relationship between agricultural value and GDP per capita is supported by the heavy reliance on agriculture sector by most developing economies (Imai et al., 2010c). Lastly, we argue that GLP of MFIs will be dependent on the number of active borrowers and MFIs in the country. The premise is that, for countries to attract funds for on-lending, most funders will examine the general microfinance landscape in the country (in this case number of MFIs in the country) and the ratio of GLP to number of active borrowers. This informs funders on the prospects of their investment. The explanatory variables have been divided into three blocks, macro, institutional and time-related determinants of MFIs’ financial performance. These are log of GDP per capita, share of domestic credit provided by banking sector to GDP, institutional factors (political stability, rule of law, voice and accountability, control of corruption and their average), log of MFIs’ gross loan portfolio, and year dummies. The choice of dependent variables is consistent with four broad perspectives of assessing financial performance of MFIs which the Annual Micro Banking Bulletin published by the MIX market focuses on, namely (i) Profitability, (ii) Asset Management, (iii) Loan Portfolio quality, and (iv) Efficiency. Amidst several indicators available for each component, we select a ratio that will enable us to 9.
(11) compare our results with previous studies specifically, Gonzalez (2007) and Ahlin et al. (2011). Also, our selection is based on the ratio with the highest observations for each component with the exception of ‘(iii) Loan Portfolio Quality’ where two ratios, that is, ‘portfolio at risk’ and ‘write-off ratio’ are used.5 ‘Return on Assets’, ‘debt-to-equity ratio’ and ‘operating expense ratio’ are, respectively, used to capture (i) Profitability, (ii) Asset Management (or leverage) and (iv) Efficiency of MFIs. MFIs’ base data accessed from the MIX market website for the analysis spans from 2005 to 2009 on 5,740 MFIs (pooled) in 106 countries. The data points, however, reduce to about 3,126 MFIs, in 97 countries for the period 2005 to 2008 and country level variables are matched onto the MFI datasets. This again varies given the different data requirements of our two econometric specifications discussed below as well as the type of dependent variable under consideration.. Microfinance Financial Performance Variables A myriad of financial ratios are available for assessing the performance of MFIs (CGAP 2003, the SEEP Network and Alternative Credit Technologies 2005). Although it is difficult to synchronise the different interpretations of all the ratios, they provide alternative perspectives in assessing the performance of MFIs for each of the four domains, namely, profitability, efficiency, leverage and risk. In essence, in interpreting the determinants of MFIs’ financial performance, due cognisance should be taken of the precise focus of each ratio. Based on the forgoing, this sub-section provides an interpretation of the five dependent. 5. This is because, although portfolio at risk (30-days) is mostly reported, it is merely an accounting provision and could include a part of the portfolio which was eventually recovered. Write- off ratio, on the other hand, is actual default. 10.
(12) variables used in this study. As mentioned earlier, the selection of these indicators was based on their wide usage and frequency of data points available from the MIX market. Return on assets (ROA) falls within the domain of profitability measures and tracks MFIs’ ability to generate income based on its assets. The ratio excludes non-operating income and donations. ROA provides a broader perspective compared to other measures as it transcends the core activity of MFIs, namely, providing loans, and tracks income from all operating activities including investment, and also assesses profitability regardless of the MFIs’ funding structure. ROA is expected to be positive as a reflection of the profit margin of the MFI, otherwise it reflects non-profit or losses. Efficiency of MFIs is measured by the share of operating expense to gross loan portfolio in most cases. The ratio provides a broad measure of efficiency as it assesses both administrative and personnel expense with lower values indicating more efficient operations. The debt to equity ratio is a member of the asset/liability management ratios and specifically attempts to track MFIs’ leverage. This measure provides information on the capital adequacy of MFIs and assesses their susceptibility to crisis. Microfinance investors mainly rely on this ratio as it helps to predict the probability of an MFI honouring its debt obligations. However, its use should always be contextualized as higher values could lead to growth of MFIs. As mentioned earlier, two ratios are used for MFIs’ risk, namely, portfolio- at- risk (PAR) and write-off ratios. Higher values for both ratios which indicate low portfolio quality are not desirable since they can lead to lower profits and likelihood of non-sustainability of both the MFI and clients. The PAR values represent client loans that are outstanding and write-off indicates the declaration of default (strike-out from book of accounts). It is worth noting that portfolio quality of MFIs is driven by internal institutional accounting practices/norms,. 11.
(13) degree of regulation (in the case of formal MFIs) and maturity of the microfinance market where the MFI operates.. 4.. Econometric Specifications. The present study applies two econometric models, 3SLS and HT to the unbalanced panel data. We attempt to use 3SLS for the pooled cross- section data with year dummies to address the endogeneity of key explanatory variables explicitly. That is, endogenous variables are instrumented by external factors.6 To supplement this, we have also applied HT model to take advantage of the panel data. In estimating HT model, we treat one time invariant variable (regulation), slow changing variables (institutional factors) and log of GLP as endogenous. In spite of the limitations, the use of unbalanced panel data for the entire sample will increase the number of observations. Across the two econometric models the sample size varies as our instruments used in the 3SLS cover only a subset of the entire sample.. Three Stage Least Squares (3SLS) We use 3SLS primarily because some of our key explanatory variables (institutional factors, log of GDP per capita, log of gross loan portfolio and share of domestic credit provided by banking sector) are likely to be endogenous. MFI fixed effects are not incorporated in case of 3SLS. This is one of the reasons for estimating the HT model as it takes into account the MFI fixed effects. Following Imai et al. (2010c), the instruments used for institutional factors and share of domestic credit provided by banking sector are European settler’s mortality rate and financial. 6. We have tried 3SLS where all MFI dummies are included as explanatory variables, which is equivalent to fixed-effects 3SLS. However, because of the huge sample size, the procedure did not converge and thus we report the case only with year dummies. 12.
(14) openness, respectively. The first stage regression results in Appendix 1 show a statistical significant relationship between the instruments and the potentially endogenous variables. To further examine the validity of our instruments, we present identification tests (under, weak and over) based on two-stage least squares estimations in Appendix 2. For the sake of brevity the results of the two-stage results are not presented but can be made available on request. Econometric specifications use one symbol (FINp) to represent each of the five different dimensions of MFI Financial Performance. Equation (1) below represents the structure of the model where the effect of macro level factors, characteristics of MFIs, Institutional variables, and year dummies are estimated on the financial performance of MFIs.. FIN p it = β10 + β 11 M it + β1 2 Cit + β 13 I it + β14 Dt + ε 1i. (1). where β 10 is a constant term; FIN p it represents each of the five financial performance indicators for ith MFI in time period t; M it is the vector of macro level factors, namely, log of GDP per capita and share of domestic credit to GDP; C it represent a vector of MFI characteristics, namely, size, age of MFI and its square to capture non-linearity, characterisation in terms of legal status, that is, Banks (our reference category), Credit Union and. Cooperatives,. Non-bank. Financial. Institutions,. Non-governmental. Financial. Organisations and other categories and regulation; I it represents institutional factorsspecifically, political stability, voice and accountability, control of corruption, the rule of law, as well as the average of these four indicators; Dt stands for year dummies with 2005 as a reference point and ε1i is an i.i.d. error term. As mentioned earlier, in view of potential endogeneity either from the perspective of bicausality or measurement error, we estimate a set of four reduced form equations and plug the predicted values in the structural model (Equation (1)). 13.
(15) LGDPpc it = β 2 0 + β 21 LlAg it + β 2 2 LlAg ^ 2 it + β 2 3 Dt + ε 2 i. (2). Equation (2) estimates log of the lag of agricultural value added per worker ( LlAg it ) and its square ( LlAg ^ 2 it ) to resolve potential endogeneity of the log of GDP per capita ( LGDPpc it ). Dt controls for yearly variation, β 2 0 is a constant term and ε 2 i is an i.i.d. error term. In addition to log of GDPpc, our second macro level variable is also likely to be endogenous and we resolve this by estimating Equation (3) below. Fit = β 3 0 + β 31 O it + β 32 Dt + ε 3 i. (3). where Fit is share of domestic credit to GDP and Oit represent financial openness (or the Chinn-Ito index of capital account openness). All symbols have the same interpretation as above with β 30 being the constant term. Also, the possible endogeneity of institutional factors is instrumented by the log of European settlers’ mortality rate, represented by E i in Equation (4) below. I it = β 4 0 + β 41 E i + β 4 2 Dt + ε 4 i. (4). All symbols have the same interpretation as above with β 40 representing a constant term. Lastly, size of MFI measured by log of gross loan portfolio is instrumented by loan per borrower at the national level multiplied by the number of MFIs in the country.. LGLPMFit = β 50 + β 51GLPNOABMF jt + β 5 2 D t + ε 5 i. 14. (5).
(16) where LGLPMFit represents the log of gross loan portfolio of MFI i in time t and GLPNOABMF jt is the log of country level [gross loan portfolio * number of active. borrowers]/[number of MFIs].. Hausman-Taylor Estimation In addition to 3SLS estimation, we estimate a panel regression using the HT technique. Unlike the traditional way of resolving endogeneity in the context of panel data, the HT model is capable of estimating time invariant explanatory variables (which are inestimable in case of fixed-effect instrumental variable estimation). Also, contrary to random effect estimation, HT estimation assumes that some of the explanatory variables are correlated with the unobserved panel-level random effect. This peculiar feature of the HT estimation enables us to include time-invariant variables, such as ‘whether the MFI is regulated or not” in the right hand side. Also, the HT estimation resolves endogeneity using variables specified within the model. Specifically, the HT model uses exogenous time-variant variables as instruments for endogenous time-variant variables and exogenous time-invariant variables as instruments for endogenous time-invariant variables. The structural form of the HT estimation is specified as follows;. FIN. pilt. = X. 1 ilt. ξ1 + X. 2 ilt. ξ 2 + Z 1 il λ 1 + Z 2 il λ 2 + a i + µ it. (6). where X 1ilt or X 2ilt represents a vector of time varying regressors, which is distinguished by subscript 1 or 2 in terms of whether it is correlated with the unobservable (ai). GDP, share of domestic credit to GDP and age of MFIs are treated as time-varying regressors that are uncorrelated with the unobservable term. GLP and institutional factors are treated as timevarying regressors that are correlated with the unobservable (that is, endogenous regressors). We treat GLP and institutional factors - which are our main variables of interest - as 15.
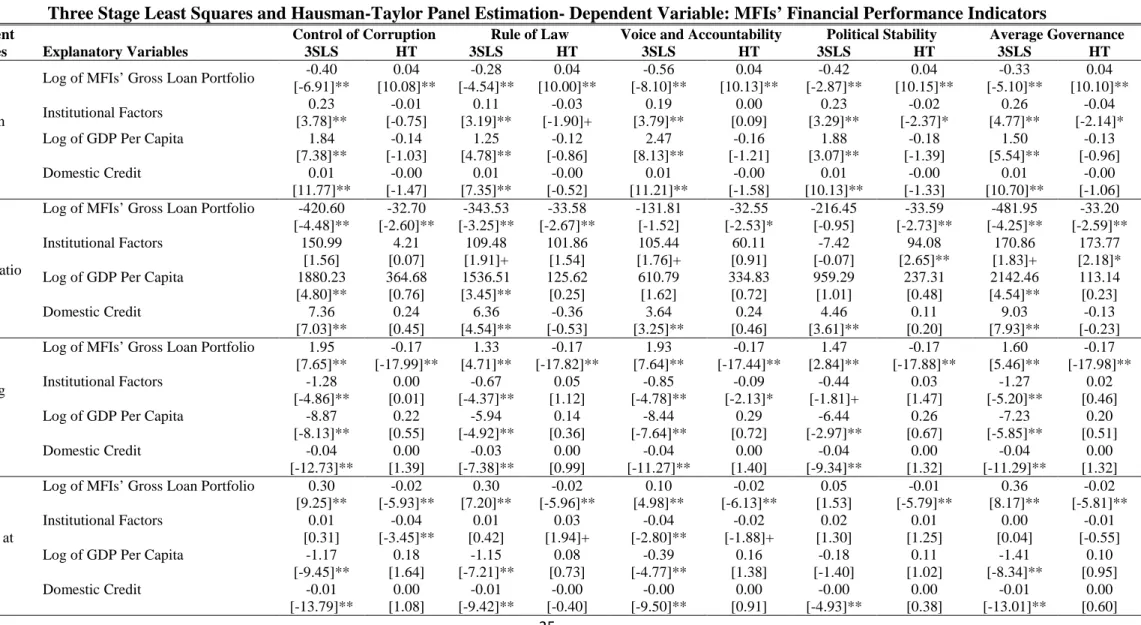
(17) endogenous, as discussed in the previous section. Z1il or Z 2il denotes time-invariant regressors, distinguished by subscripts 1 and 2 in a similar way depending on whether it is correlated with the unobservable or not. Legal status of the MFI is considered to be uncorrelated with the unobservable, while regulation is assumed to be correlated with the unobservable. The rationale is that in the case of regulation, whether MFIs should switch from the informal sector to the formal sector where operations are more heavily regulated is largely decided by MFIs themselves in most developing countries. As usual, all the regressors are assumed to be uncorrelated with the idiosyncratic error term µit .(Dr Imai: pl. clarify whether all or some, as some are endogenous but instrumented in a specific way in the HT procedure).. 5.. Econometric Results and Discussion For the sake of brevity, we present econometric results of log of MFIs’ GLP, institutional. factors, log of GDP per capita and domestic credit. The results of the full set of variables and descriptive statistics are provided in the longer version of the paper and will be provided on request. The first column of Table 1 shows five financial performance indicators used in this paper.7. Insert Table 1 here. The central argument of this paper is that institutional factors are important for achieving successful microfinance (financial) performance indicators. With each financial performance 7. For data accuracy check and comparison of our results with Ahlin et al. (2011), we run the same set of regressions on a restricted sample of MFIs that have either four or five diamonds and have obtained broadly similar results.. 16.
(18) indicator, the results based on two estimation techniques are presented. In the space of each of these estimation techniques, four different institutional factors plus their average are reported. The second row of Table 1 presents the results on the relationship between log of MFI’s GLP and ROA. The two different models resulted in different signs in coefficient estimates of both log of gross loan portfolio and institutional factors. The signs of the coefficient estimates for the two models largely depend on the degree of variation between internal and external factors that influence the financial performance indicator in question and the manner in which endogeneity is resolved. In essence, what matters is the source of endogeneity and how each model resolves it. In the case of log of MFIs’ gross loan portfolio (GLP), the HT model that uses internal instruments to resolve bias shows the right sign and statistical significance. Unlike the 3SLS, the observed positive coefficient of MFIs’ GLP indicates that higher GLP of MFIs is expected to increase ROA mainly as a result of economies of scale. Further inspecting the validity of our instruments, we carried out underidentification tests as well as weak identification tests based on two-stage least squares. Here, the null hypothesis that the equation is underidentified (or that the equation is only weakly identified) is strongly rejected, which implies that excluded instruments are relevant (or the excluded instruments are ‘non-weakly’ correlated with the endogenous regressors) in most of the cases. All our variables pass the identification tests (except GLP) validating our specification.8 Based on the governance model, we expect that the coefficient estimates of institutional factors will be positive. That is, an MFI in a country with better control of corruption (CC) (or voice and accountability, rule of law and political stability) is expected to operate more 8. This suggests that based on the specification of our model, using the external instrument (log of country level (GLP/NOAB)*MFI as an instrument for GLP) will not necessarily lead to the right sign. This partly supports the use of HT model that employs exogenous variables within the model to help minimize the endogeneity associated with GLP. 17.
(19) efficiently leading to a higher ROA. The results from the 3SLS show coefficient estimates that are consistent with our hypothesis. In terms of the relationship between MFIs’ leverage and size of MFIs, log of GLP points to a lower leverage indicating a potential to minimize risk of over-borrowing as firm size increases. In five of the ten cases that examine the effect of institutional factors on MFIs leverage, we find a statistically significant positive relationship. As indicated earlier, MFI’s willingness and ability to leverage its equity through borrowing is contextual and, among other factors, dependent on the stage of development of the MFI. In this case, our results show that macro institutional factors like rule of law, voice and accountability and political stability are likely to lead to higher debt-to-equity ratio. On efficiency, we observe that a better macro economy, measured by log of GDP per capita and domestic credit provided by the banking sector, is essentially one that optimises use of resources. The positive relationship between the share of domestic credit provided by the banking sector and MFIs efficiency can be attributed to the potential competition that the latter brings into the financial sector. This invariably forces MFIs to operate efficiently to stay in the market. As in the case of ROA, varied signs are observed for the two estimators. The results of 3SLS show that increase in size reduces MFIs per unit cost of operation, whilst those of HT estimation reveal that better institutional factors leads to efficient operations of MFIs. The evidence that all the institutional factors improves efficiency of MFIs (or drives down the cost of operation) is an indication that in the event of MFI liquidity constraints (e.g. due to lack of funds for on-lending) as threatened by the global economic crisis, other channels could be pursued to make the operations of MFIs sustainable. The fifth and last rows show the results for MFIs’ portfolio quality. With the exception of institutional factors, most of the results are comparable and consistent with a priori expectation. In particular, on the pro-cyclical relationship between the macro economy and 18.
(20) better MFIs’ performance, lower default risk is observed when macro economy performs better. In the case of portfolio at risk, most of the institutional factors tend to be statistically non-significant unlike write-off ratio. This is consistent with the underlying reason for exploring the effect of two different measures of portfolio quality. Thus, while portfolio at risk is a widely used measure and subsumes write-off ratio, its handling varies across different MFIs and countries. The observed negative sign indicates that better institutional factors reduce MFIs’ risk of default.. 6.. Conclusion. With shrinking donor investments in microfinance, a serious concern among policy makers and practitioners is how the macroeconomic factors or the crisis or the macro-institutional factors impact the performance of MFIs. The present paper investigated the effects of both institutional factors and the macro economy on the financial performance of MFIs, drawing upon the Microfinance Information Exchange (MIX) data as well as WDI 2010, World Governance Indicators, and Chinn and Ito (2006) index of capital account openness. In defining a dependent variable, we considered four broad categories of MFIs’ performance, namely, (i) Profitability (proxied by ‘Return on Assets’), (ii) Asset Management (‘debt-toequity ratio’), (iii) Loan Portfolio quality (‘portfolio- at- risk’ and ‘write-off ratio’), and (iv) Efficiency (‘operating expense ratio’). We examined the effects of institutional factors, namely, control of corruption, the rule of law, voice and accountability and political stability on the performance of MFIs. The present study used 3SLS and Hausman-Taylor model to take account of the endogeneity of key explanatory variables, including institutional factors. In contrast to Ahlin et al.’s (2011) work which shows that macro-institutional factors have little effects on MFI’s performances, we generally find that institutional factors affect MFIs’ financial performance, in particular, profitability, operating expense, and portfolio quality. It 19.
(21) is also found that the macroeconomic and financial factors, such as GDP and share of domestic credit to GDP, have positive impacts on MFIs’ financial performance - specifically profitability, operating expense ratio and portfolio quality. In three of the four indicators (profitability, asset/liability management, efficiency and portfolio quality) of MFIs financial performance, most of the institutional factors have a positive impact. As markets-especially financial- are increasingly globally integrated with high contagion risks, macro-economic policies must be better coordinated. Of particular importance. is. fiscal stimulus in both USA and Eurozone countries. Politics continues to hamper expansionary policies and consequently a quick recovery. Groups such as G-20 have failed to resolve the deadlock. So it is difficult to be optimistic. A related issue in an environment of global crisis is whether there is a pro-cyclical or counter-cyclical interaction between microfinance performance and the macro- economy. Our results point to proc-cylical interactions and a serious risk of deterioration in MFIs’ performance. If however, there is a counter-cyclical interaction, as suggested by Galema et al. (2011), the country may be able to attract investors’ funds in microfinance despite the global crisis and use them for helping the poor who are likely to be hit by the crisis. Improving macro-institutional quality could also contribute substantially to making the activities of MFIs more sustainable under the continuing feeble and faltering recovery of the global economy. Institutions, however, evolve slowly and what adds to the challenge is the difficulty of identifying “triggers” that will accelerate their reform. However, governments could improve narrowly defined institutions, such as a regulatory and legal framework for MFIs in order to ensure that such a framework is sufficiently adapted to the existing microfinance models of the country. In sum, the challenge of improving the financial performance of MFIs is daunting.. 20.
(22) References Acemoglu, D., Johnson S. & Robinson, J. A. (2001) The Colonial Origins of Comparative Development: An Empirical Investigation, American Economic Review, 91(5), pp.13691401. Acemoglu, D., Johnson, S. & Robinson, J. A. (2002) Reversal of Fortune: Geography and Development in the Making of the Modern World Income Distribution, Quarterly Journal of Economics, 117(4), pp.1231-1294. Acemoglu, D., Johnson, S. & Robinson, J. A. (2005) A Response to Albouy’s A Reexamination Based on Improved Settler Mortality Data, Draft, March, 2005. Ahlin, C., and Jiang, N. (2008) “Can micro-credit bring development?” Journal of Development Economics, 86, pp.1-21. Ahlin C., and Lin J. (2006) “Luck or Skill? MFI Performance in Macroeconomic Context” Bureau for Research and Economic Analysis of Development, BREAD Working Paper No. 132, Centre for International Development, Harvard University, USA. Ahlin C., Lin J. and Maio M. (2011) “Where Does Microfinance Flourish?: Microfinance Institution Performance in Macroeconomic Context” Journal of Development Economics 95, pp.105-120. Assefa E., Hermes N. and Meesters A. (2010) “Competition and Performance of Microfinance. Institutions”. http://www.microfinancegateway.org/gm/document-. 1.1.9499/competition%20and%20performance%20of%20MFIs.pdf Date Accessed: 7th February 2012. 21.
(23) Baltagi, B. H., Demetriades, P. O. and Law, S. H. (2009) “Financial development and openness: evidence from panel data”, Journal of Development Economics, 89(2), pp. 285– 296. CGAP. (2003) “Definitions of Selected Financial Terms, Ratios, and Adjustments for Microfinance”. Microfinance. Consensus. Guidelines. Washington,. D.C.:. CGAP.. http://www.cgap.org/p/site/c/template.rc/1.9.2784. Chinn, M.D. and Ito, H. (2006) “What matters for financial development?: Capital controls, institutions and interactions”, Journal of Development Economics, 81, pp.163–192. Cuevas C.E. (1996) “Enabling Environment and Microfinance Institutions: Lessons from Latin America”, Journal of International Development, 8(2): 195-209 Cull R., Demirgüc-Kunt, A, and Morduch, J. (2007) “Financial Performance and Outreach: A Global Analysis of Leading Micro banks”, The Economic Journal, 117(517):107- 33. Cull R., Demirgüc-Kunt, A, and Morduch, J. (2011) “Does Regulatory Supervision Curtail Microfinance Profitability and Outreach?” World Development, 39(6): 949–965. Gonzalez, A. (2007) Resilience of Microfinance Institutions to National Macroeconomic Events: An analysis of MFI asset quality, MIX Discussion Paper No. 1. Hermes, N and Lensink, R. (2007) “The Empirics of Microfinance: What do we Know?” The Economic Journal, 117(517): 1 – 10. Huang, Y. (2011) “Political Institutions and Financial Development: An Empirical Study”, World Development, 38(12): 1667–1677. Imai, K. S., Arun, T., & Annim, S. K. (2010a). “Microfinance and Household Poverty Reduction: New evidence from India” World Development, 38(12), 1760-1774. 22.
(24) Imai, K. S., Gaiha, R., Thapa, G. & Annim, S. K. (2010b) “Microfinance and Poverty A Macro Perspective” Economics Discussion Paper, No: EDP1020, Manchester: University of Manchester. Imai, K. S., Gaiha, R., Thapa, G. (2010c) “Is the Millennium Development Goal of Poverty Still Achievable? Role of Institutions, Finance and Openness”, Oxford Development Studies, 38(3), 309-337. IRIN (2009) “BENIN: Corrupt microfinance institutions profit from poorest”, Humanitarian News and Analysis, January 2009, http://www.irinnews.org/report.aspx?reportid=82247, accessed on 6th February 2012. Krauss N. and Walter I. (2009) "Can Microfinance Reduce Portfolio Volatility?" Economic Development and Cultural Change, 58(1), 85-110. Llanto, G. M. Garcia, E., and Callanta, R. (1997) “An Assessment of the Capacity and Financial Performance of Microfinance Institutions: The Philippine Case”, Journal of Philippine Development 43(24) No.1, 1-66. Marconi, R. and Mosley, P. (2006) “Bolivia During the Global Crisis 1998–2004: Towards the Macroeconomics of Microfinance” Journal of International Development 2(18) 237 – 61. Meagher, P., Campos. P., Christen, R.P., Druschel, K., Gallardo, J., Martowijoyo, S. (2006) “Microfinance Regulation in Seven Countries: A Comparative Study FINAL REPORT”, the IRIS Center, University of Maryland. Patten, R. H., Rosengard, J. K. and Johnston, D. E. (2001) “Microfinance Success Amidst Macroeconomic Failure: The Experience of Bank Rakyat Indonesia During the East Asian Crisis” World Development 29(6): 1057-69. 23.
(25) Thapa, G. (2008), Sustainability and Governance of Microfinance Institutions: Recent Experiences and Some Lessons for Southeast Asia, Working Paper No: 07-11, 21 August 2008, Rome: IFAD. The SEEP Network and Alternative Credit Technologies (2005) Measuring Performance of Microfinance Institutions: A Framework for Reporting, Analysis, and Monitoring Washington D.C., USA. Weill, L. (2011) “Does corruption hamper bank lending? Macro and micro evidence”, Empirical Economics, 41: 25–42.. 24.
(26) Table 1: Effect of Institutional Factors on MFI Financial Performance: Three Stage Least Squares and Hausman-Taylor Panel Estimation- Dependent Variable: MFIs’ Financial Performance Indicators Dependent Variables. Explanatory Variables Log of MFIs’ Gross Loan Portfolio. Return on Assets. Institutional Factors Log of GDP Per Capita Domestic Credit Log of MFIs’ Gross Loan Portfolio. Debt to Equity Ratio. Institutional Factors Log of GDP Per Capita Domestic Credit Log of MFIs’ Gross Loan Portfolio. Operating Expense Ratio. Institutional Factors Log of GDP Per Capita Domestic Credit Log of MFIs’ Gross Loan Portfolio Institutional Factors. Portfolio at Risk. Log of GDP Per Capita Domestic Credit. Control of Corruption 3SLS HT -0.40 0.04 [-6.91]** [10.08]** 0.23 -0.01 [3.78]** [-0.75] 1.84 -0.14 [7.38]** [-1.03] 0.01 -0.00 [11.77]** [-1.47] -420.60 -32.70 [-4.48]** [-2.60]** 150.99 4.21 [1.56] [0.07] 1880.23 364.68 [4.80]** [0.76] 7.36 0.24 [7.03]** [0.45] 1.95 -0.17 [7.65]** [-17.99]** -1.28 0.00 [-4.86]** [0.01] -8.87 0.22 [-8.13]** [0.55] -0.04 0.00 [-12.73]** [1.39] 0.30 -0.02 [9.25]** [-5.93]** 0.01 -0.04 [0.31] [-3.45]** -1.17 0.18 [-9.45]** [1.64] -0.01 0.00 [-13.79]** [1.08]. Rule of Law 3SLS HT -0.28 0.04 [-4.54]** [10.00]** 0.11 -0.03 [3.19]** [-1.90]+ 1.25 -0.12 [4.78]** [-0.86] 0.01 -0.00 [7.35]** [-0.52] -343.53 -33.58 [-3.25]** [-2.67]** 109.48 101.86 [1.91]+ [1.54] 1536.51 125.62 [3.45]** [0.25] 6.36 -0.36 [4.54]** [-0.53] 1.33 -0.17 [4.71]** [-17.82]** -0.67 0.05 [-4.37]** [1.12] -5.94 0.14 [-4.92]** [0.36] -0.03 0.00 [-7.38]** [0.99] 0.30 -0.02 [7.20]** [-5.96]** 0.01 0.03 [0.42] [1.94]+ -1.15 0.08 [-7.21]** [0.73] -0.01 -0.00 [-9.42]** [-0.40]. 25. Voice and Accountability 3SLS HT -0.56 0.04 [-8.10]** [10.13]** 0.19 0.00 [3.79]** [0.09] 2.47 -0.16 [8.13]** [-1.21] 0.01 -0.00 [11.21]** [-1.58] -131.81 -32.55 [-1.52] [-2.53]* 105.44 60.11 [1.76]+ [0.91] 610.79 334.83 [1.62] [0.72] 3.64 0.24 [3.25]** [0.46] 1.93 -0.17 [7.64]** [-17.44]** -0.85 -0.09 [-4.78]** [-2.13]* -8.44 0.29 [-7.64]** [0.72] -0.04 0.00 [-11.27]** [1.40] 0.10 -0.02 [4.98]** [-6.13]** -0.04 -0.02 [-2.80]** [-1.88]+ -0.39 0.16 [-4.77]** [1.38] -0.00 0.00 [-9.50]** [0.91]. Political Stability 3SLS HT -0.42 0.04 [-2.87]** [10.15]** 0.23 -0.02 [3.29]** [-2.37]* 1.88 -0.18 [3.07]** [-1.39] 0.01 -0.00 [10.13]** [-1.33] -216.45 -33.59 [-0.95] [-2.73]** -7.42 94.08 [-0.07] [2.65]** 959.29 237.31 [1.01] [0.48] 4.46 0.11 [3.61]** [0.20] 1.47 -0.17 [2.84]** [-17.88]** -0.44 0.03 [-1.81]+ [1.47] -6.44 0.26 [-2.97]** [0.67] -0.04 0.00 [-9.34]** [1.32] 0.05 -0.01 [1.53] [-5.79]** 0.02 0.01 [1.30] [1.25] -0.18 0.11 [-1.40] [1.02] -0.00 0.00 [-4.93]** [0.38]. Average Governance 3SLS HT -0.33 0.04 [-5.10]** [10.10]** 0.26 -0.04 [4.77]** [-2.14]* 1.50 -0.13 [5.54]** [-0.96] 0.01 -0.00 [10.70]** [-1.06] -481.95 -33.20 [-4.25]** [-2.59]** 170.86 173.77 [1.83]+ [2.18]* 2142.46 113.14 [4.54]** [0.23] 9.03 -0.13 [7.93]** [-0.23] 1.60 -0.17 [5.46]** [-17.98]** -1.27 0.02 [-5.20]** [0.46] -7.23 0.20 [-5.85]** [0.51] -0.04 0.00 [-11.29]** [1.32] 0.36 -0.02 [8.17]** [-5.81]** 0.00 -0.01 [0.04] [-0.55] -1.41 0.10 [-8.34]** [0.95] -0.01 0.00 [-13.01]** [0.60].
(27) Log of MFIs’ Gross Loan Portfolio Institutional Factors Write-off ratio. Log of GDP Per Capita Domestic Credit. 0.12 [6.66]** -0.06 [-4.06]** -0.49 [-6.92]** -0.00 [-10.46]**. -0.01 [-6.42]** 0.00 [0.14] 0.01 [0.20] 0.00 [0.44]. 0.08 [4.25]** -0.03 [-3.09]** -0.33 [-4.27]** -0.00 [-6.40]**. -0.01 [-6.30]** -0.02 [-2.98]** 0.05 [0.86] 0.00 [1.58]. 0.11 [6.68]** -0.04 [-4.03]** -0.45 [-6.56]** -0.00 [-9.80]**. -0.01 [-6.48]** -0.01 [-1.39] 0.01 [0.13] 0.00 [0.55]. t statistics in brackets ---- + p<.10, * p<.05, ** p<.01. 26. 0.08 [3.28]** -0.00 [-0.16] -0.31 [-3.28]** -0.00 [-6.77]**. -0.01 [-6.42]** -0.00 [-0.92] 0.01 [0.17] 0.00 [0.49]. 0.09 [4.76]** -0.05 [-4.00]** -0.38 [-4.94]** -0.00 [-8.61]**. -0.01 [-6.43]** -0.02 [-1.81]+ 0.03 [0.40] 0.00 [0.76].
(28) Appendix 1: First Stage Regression for 3-Stage Least Squares Institutional factors Endogenous Variables. Instruments. Control of Corruption. Rule of Law. Voice and Accountability. Political Stability. Average Governance. 1.22[102.83]**. 1.26[108.44]**. 1.25[103.59]**. 1.27[108.18]**. -0.03[-17.35]**. -0.03[-22.04]**. -0.03[-20.16]**. -0.03[-21.89]**. 0.84[1.88]+. -0.79[-1.71]+. -0.57[-1.24]. -0.62[-1.35]. 1.47[121.26]**. 1.46[120.53]**. 1.45[119.42]**. 1.45[119.35]**. -0.12[-29.58]**. -0.03[-5.44]**. -0.11[-18.42]**. -0.09[-24.95]**. Return on Assets Log of GDP per capita Share of Domestic Credit Log of GLP Institutional Factors Log of GDP per capita Share of Domestic Credit Log of GLP Institutional Factors Log of GDP per capita Share of Domestic Credit Log of GLP Institutional Factors Log of GDP per capita Share of Domestic Credit Log of GLP. 1.28[110.91]** Log of lag of Agric. Value per worker -0.03[-23.66]** Log of lag of Agric. Value per worker Squared -0.76[-1.66]+ Financial Openness 1.45[119.52]** Log of country level (GLP/NOAB)*MFI -0.11[-29.26]** Log of European Settlers Mortality Debt-to-Equity Ratio 1.27[118.66]** Log of lag of Agric. Value per worker Log of lag of Agric. Value per worker Squared -0.03[-24.60]** -0.57[-1.32] Financial Openness 1.45[126.94]** Log of country level (GLP/NOAB)*MFI -0.11[-31.25]** Log of European Settlers Mortality Operating Expense Ratio 1.28[111.13]** Log of lag of Agric. Value per worker -0.03[-23.67]** Log of lag of Agric. Value per worker Squared -0.65[-1.41] Financial Openness 1.45[119.10]** Log of country level (GLP/NOAB)*MFI -0.11[-29.33]** Log of European Settlers Mortality Portfolio at Risk 1.27[112.11]** Log of lag of Agric. Value per worker Log of lag of Agric. Value per worker Squared -0.03[-22.94]** -0.34[-0.75] Financial Openness 1.43[120.82]** Log of country level (GLP/NOAB)*MFI. 27. 1.21[110.29]**. 1.25[115.92]**. 1.24[111.14]**. 1.25[116.01]**. -0.03[-17.88]**. -0.03[-22.95]**. -0.03[-20.88]**. -0.03[-22.74]**. 1.21[2.85]**. -0.60[-1.38]. -0.62[-1.41]. -0.37[-0.85]. 1.46[128.43]**. 1.45[128.14]**. 1.44[126.68]**. 1.44[126.66]**. -0.12[-30.97]**. -0.03[-6.21]**. -0.10[-18.10]**. -0.09[-25.80]**. 1.22[103.07]**. 1.26[108.59]**. 1.25[103.78]**. 1.27[108.43]**. -0.03[-17.40]**. -0.03[-22.03]**. -0.03[-20.17]**. -0.03[-21.94]**. 0.92[2.04]*. -0.68[-1.48]. -0.50[-1.09]. -0.50[-1.08]. 1.47[120.84]**. 1.45[120.11]**. 1.45[118.94]**. 1.45[118.92]**. -0.12[-29.64]**. -0.02[-5.31]**. -0.11[-18.45]**. -0.09[-24.99]**. 1.20[103.65]**. 1.25[109.70]**. 1.24[104.26]**. 1.25[109.00]**. -0.02[-16.49]**. -0.03[-21.24]**. -0.03[-19.24]**. -0.03[-20.94]**. 1.35[3.05]**. -0.29[-0.64]. -0.39[-0.86]. -0.15[-0.33]. 1.45[122.49]**. 1.44[121.92]**. 1.43[120.65]**. 1.43[120.61]**.
(29) Institutional Factors. -0.11[-29.80]**. Log of European Settlers Mortality. -0.12[-29.65]**. -0.02[-5.01]**. -0.10[-17.81]**. -0.09[-24.62]**. 1.28[108.38]**. 1.22[99.94]**. 1.26[105.92]**. 1.25[100.35]**. 1.27[105.34]**. -0.03[-22.88]**. -0.03[-16.52]**. -0.03[-21.09]**. -0.03[-19.12]**. -0.03[-21.08]**. -0.11[-0.24]. 1.56[3.39]**. -0.05[-0.10]. -0.00[-0.01]. 0.10[0.20]. 1.44[114.32]**. 1.46[116.21]**. 1.44[115.24]**. 1.43[114.19]**. 1.43[114.17]**. -0.11[-28.82]**. -0.13[-29.16]**. -0.02[-5.18]**. -0.11[-18.81]**. -0.09[-24.76]**. Write-off Ratio Log of GDP per capita Share of Domestic Credit Log of GLP Institutional Factors. Log of lag of Agric. Value per worker Log of lag of Agric. Value per worker Squared Financial Openness Log of country level (GLP/NOAB)*MFI Log of European Settlers Mortality. Appendix 2: Identification test of Instruments: Based on Two-Stage Least Square Estimations Identification Tests Under Identification Weak Identification Over Identification. GDP. Domestic Credit. Gross Loan Portfolio. Control of Corruption. Rule of Law. Voice and Accountability. Political Stability. Average Governance. 626.18 (0.00). 152.79 (0.00). 2.20 (0.14). 22.87 (0.00). 3.22 (0.07). 2.54 (0.11). 452.54 (0.00). 112.99 (0.00). 384.02 (0.00). 159.08 (0.00). 2.21 (0.14). 22.93 (0.00). 3.20 (0.07). 2.52 (0.11). 562.26 (0.00). 118.07 (0.00). Exactly identified. Exactly identified. Exactly identified. Exactly identified. Exactly identified. Exactly identified. Exactly identified. Exactly identified. 28.
(30)
Figure
Related documents
Notes: Table 10 shows the top 10 countries of trademark ownership location regarding the total number of registrations (left) and the average number of
While progress in reducing under-five and neonatal mortality rates in urban areas appears to be levelling off, polices targeting rural populations and scheduled caste and tribe
To ensure effective planning and monitoring of some set of financial indicators (reference points) of strategic development of the enterprises which are on emerging markets
1.563 billion population, thus representing 22.7 percent of the total global population (WDI, 2010), with half of its total population still living under poverty (PED, 2010),
Petrescu-Mag Ioan Valentin: Bioflux, Cluj-Napoca (Romania) Petrescu Dacinia Crina: UBB Cluj, Cluj-Napoca (Romania) Sima Rodica Maria: USAMV Cluj, Cluj-Napoca (Romania)
To analyze the effect of five select variables – Yield on gross loan portfolio (Nominal), Total Assets, Cost per Borrower, Gross Loan Portfolio and Number of
For single class object detection, SFJTC yields similar performance as CSFJTC as analyzed in Section II theoretically and in Section III-B experimentally. However, SFJTC is
Capitalizing on his degree in marketing from Syracuse University and MBA from Columbia University, Rob repositioned the company’s offerings to include a multi tiered product
