Effect of Determinants of Lending Interest Rate Fluctuations on
the Profitability of Commercial Banks in Kenya
Brenda Jebiwott Rop and Dr. Fredrick M. kalui Egerton University, P.O.Box.536 Egerton, Kenya
ABSTRACT
Volatility in lending interest rates represents one of the key forms of financial risk faced by commercial banks in Kenya. The aim of this research project was to identify and assess the effect that the determinants of lending interest rate volatility have on the profit levels realized by commercial banks in Kenya for the period 2010-2015. This study used profitability measured by Net Interest Margin as the dependent variable, while the independent variables were Borrowers’ Default Rate, Central Bank of Kenya Liquidity Ratio, Central Bank Kenya Cash Reserve Ratio, Inflation Rate and Maturity Mismatch. The study population was the total 42 commercial banks that were in operation as at the end of 2015, with a sample size of 20 banks. The study used secondary data collected from individual commercial banks, among them audited financial statements, published bank supervision reports by Central Bank of Kenya, data on inflation was obtained from Kenya National Bureau of Statistics. Data analysis involved both descriptive and inferential statistics; with descriptive statistics involving the use of mean, standard deviation, minimum and maximum values of data collected, while the inferential statistics comprising the use of regression coefficients to test the hypotheses ywith values generated using the Statistical Package for Social Sciences software. The findings of the study revealed that Borrower’s Default Rate, Inflation Rate and Maturity Mismatch Risk would impact negatively on the profitability of banks, whereas Cash Reserve Ratio and Liquidity Ratio would impact positively on the profitability of commercial banks in Kenya. The study therefore concluded that commercial banks should work in tandem with Central Bank of Kenya in order to constantly monitor the Cash Reserve Ratio and Liquidity levels to avoid cases of instability; the Inflation Rate should be watched as well in order to know and study the borrowing culture of the various bank clientele, and that both Maturity Mismatch and Borrowers Default Rate levels should be contained to avoid growth in Non-Performing Loans and to keep the banks’ loan book open and in constant flow.
Key words: interest rate fluctuation, Default Rate, Liquidity Ratio, Cash Reserve Ratio DOI: 10.7176/RJFA/10-8-21
Publication date: April 30th 2019
Background of the Study
The banking industry has undergone through considerable structural change due to the growth brought about by regulations and legislature governing the industry practices today. Implementation of the structural adjustment programme (SAP) in 1983 contributed a lot to this. Back then, interest rates were maintained below the market rates and direct control of credit was the most important monetary control instrument used by the government (KIPPRA, 2015). Market-based credit allocation was undermined by less competitive banking systems, inadequate regulatory framework and borrowers were less sensitive to interest rates; this resulted in SAP and interest rates deregulation taking place in 1991.
The Kenyan government then adopted the Central Bank of Kenya (CBK) Amendment Act (which was commonly called the Donde Act) in 2001 which then allowed CBK to regulate interest rates (BCBS, 2010). Reforms in the financial sector started in January 1988; among them changes in policy and institutional measures, interest rate liberalization, development of money and capital markets, improvement of efficiency of financial intermediation, development of more flexible monetary policy instruments and removal of credit ceilings (BCBS, 2004). The institutional reforms were aimed at setting up a regulatory policy that will ensure consistent supervision of the financial system through the technical expertise at the Central Bank of Kenya. Kenya in 2009 initiated a framework to encourage lending through public and private credit reference bureaus (CRB), institutional strategies to spur economic development such as the vision 2030, and alternative financial systems to giving collaterals in order to access credit; for example, unsecured loans (CIML, 2015).
In the past decade, lending interest rates have become more volatile, and banks have arguably become more exposed to such volatility because of the changing character of their products (CBK, 2014). Every year, products offered and bought by commercial banks have become more complex and varied thus exposing these banks to this
risk (CIML, 2015). In addition, the structure of balance sheets drawn by commercial banks has also changed. A higher number of commercial banks have increased the size of their long-term assets and liabilities, especially those with values that are considered more sensitive to changes in lending interest rates, this meant therefore that it became more vital and necessary to hedge against lending interest rate volatility now than it was a decade ago. This change has influenced the degree of competition among the industry players and has had significant effects on the bank returns (Saunders & Schumacher, 2003). Interest rate movement is a major concern to all financial institutions and markets. It affects decision making, performance, and growth of any particular financial institution, (Demirguc-Kunt & Huizinga, 1999). Changes in lending interest rate affects the income and expenditure of financial institutions making it challenging to maintain positive net interest margins over time. Other factors include restrictive regulations by governments and mismanagement of commercial banks, (Ndede, Matete K., & Ambrose, 2014). Interest rate influences the overall level of economic activity, flow of goods and services and financial assets within the economy. The major determinants of lending interest rate volatility include; demand and supply of loanable funds, expected inflation rates, loan default rates, CBK regulatory requirements, monetary and fiscal policies, level of government borrowing, efficiency of the banking sector among others.
Lending Interest Rate Fluctuation
Lending interest rate fluctuations is expected to affect profitability of commercial banks whose role is resource allocation; whereby they channel funds from depositors to investors. Banks can only perform this vital role, if they generate necessary income to cover the operational cost they incur, with regulations imposed by CBK being considered as a contributing factor (Maigua & Gekara, 2016). Volatility in net interest income is considered the key factor to changes in returns by many commercial banks, however understanding the degree of impact resulting from these changes on net interest income of banks would aid in identifying the channels through which this could affect the overall bank profitability. Under general conditions, bank profits increase with rising lending interest rates, the banking system as a whole is immeasurably helped rather than hindered by an increase in interest rates, though it may be challenging to prove the direction of the relationship between interest rates and profitability (Mange’eli, 2012). The degree to which the bank can change the portfolio mix and/or hedge in the short term would determine the magnitude of the effect of lending interest rate changes and other shocks on bank profitability (BCBS, 2010).
Lending rates prevailing in different countries differ depending on the efficiency of their financial markets. Efficiency can be reflected by various parameters such as the ability of financial instruments’ prices to accommodate market information (Craigiey, 2011). As such, banks are likely to charge higher lending rates in developing countries where financial markets are imperfect due to divergent availability of information between borrowers and lenders; with the creditworthiness of borrowers being doubtful, value of collaterals overstated and inefficiency considered common at institutional level. Consequently, most banks in these countries are addicted to the policy of high lending interest rates (Chirwa & Mlachila, 2004). This however may be counterproductive as high lending interest rates may contribute to higher rates of loan default (Saunders & Cornett, 2003). In Uganda, specifically within the last decade, controls on lending interest rates and credit were gradually abolished in order to improve on the efficiency in mobilization and allocation of financial resources. In 1994, commercial banks were allowed to set their own lending interest rates based on market conditions and completely leaving out controls on bank rates. This was meant to promote economic growth and financial development through increased efficiency in savings mobilization, credit allocation and investment (BCBS, 2004).
Profitability of Commercial Banks in Kenya
Profitability of commercial banks is measured using a number of common indicators (profitability ratios), among them Net Interest Margin (NIM), Return on Assets (ROA) and Return on Equity (ROE). Given that net income gives us an idea of how well a bank is doing, it does not consider the bank’s size, thus making it hard to compare how well one bank is doing relative to another. The basic measure of bank profitability that takes into consideration the size of the bank is the return on assets (ROA), which is computed by dividing the net income of the bank by its total assets. ROA is useful in measuring how well a bank is performing as it indicates how well a bank’s assets are being used to generate profits after tax.
Another commonly watched measure of bank profitability is net interest margin (NIM), which is computed as the difference between interest income and interest expenses as a percentage of total assets. An example of a commercial bank’s primary functions is issuing liabilities and using the proceeds to purchase income-earning
income on its assets and has low costs on its liabilities, profits will be high (Davies & Vaught, 2011). How well a bank manages its assets and liabilities is affected by the spread between the interest earned on the bank’s assets and the interest costs on its liabilities. This spread is exactly what the net interest margin measures. If the bank is able to raise funds with liabilities that have low interest costs and is able to acquire assets with high interest income, the net interest margin would be high, and the bank is likely to be highly profitable.
If the interest cost of its liabilities rises relative to the interest earned on its assets, the net interest margin would fall, and bank profitability would suffer (Gardner and Mills, 2005). Shareholders of banks are more concerned with how much the bank is earning on their equity investment, an amount that is measured by the return on equity (ROE), and computed by dividing the net income against capital. ROA and ROE, are widely used to assess the profitability of commercial banks. This study adopted Net Interest Margins (NIM) as the profitability measure for these commercial banks as it clearly brought out returns earned from assets and liabilities of banks (Peng, Lai, and Shu, 2003)
Commercial Banks in Kenya
Existence of commercial banks in Kenya date as far back as 1896 when the predecessor of the current Kenya Commercial Bank (KCB), then known as National Bank of India opened an outlet in Mombasa. The bank extended its operations to Nairobi in 1904. According to (KIPPRA, 2015), commercial banks perform the role of servicing and portfolio risk management; and in Kenya they act as intermediaries between savers and borrowers while providing investment opportunities. The government, through CBK regulates and supervises the activities of commercial banks. Even with government efforts of streamlining the banking industry, as recent as 2015 some banks have been placed under receivership (Imperial Bank – Kenya Deposit Insurance Corporation and Chase Bank – Kenya Commercial Bank) or collapsed (Dubai Bank) altogether due to mismanagement among other reasons (CIML, 2015).
According to Central Bank of Kenya (CBK), the banking sector is growing and profitable, although expenses are climbing faster than revenues and non-performing loans have also increased. CBK classifies banks into tiers (tier 1, tier 2 and tier 3), representing a total of 42 commercial banks in operation. Tier 1 banks have an asset base of more than Kshs. 40 billion, tier 2 banks have an asset base between Kshs. 40 billion and Kshs10 billion while tier 3 banks have an asset base of less than Ksh. 10 billion. In Kenya, CBK lends money to commercial banks as a lender of last resort and as such is a key determinant of the final lending interest rates charged on loans and mortgages. Interest rates decisions are taken by Monetary Policy Committee (MPC) of the CBK (Kiragu, 2012). In 2010, the Kenyan government raised core bank capital from Kshs. 1 billion to Kshs. 5 billion in 2016. Historically, from 1991 until 2012, interest rate averaged 15.1% reaching an all-time high of 84.7% in July of 1993 and a record low of 0.8% in September of 2003 (CBK, 2015).
Statement of the Problem
Kenya has had one of the most erratic changes in the lending interest rates in the recent past. In 2011, CBK increased its base lending rates from 5% in January to 11% in October and 16.5% in December; this effectively increased commercial banks’ lending rates to between 20-25%. This was meant to control inflation, which had increased to 19.7% in November from 4.51% in January 2011, but implications were felt on the borrowing and savings of both the consumers and commercial banks (CBK, 2011). Managing profits margins in an environment where CBK is constantly fighting for lower lending rates is difficult for these commercial banks (Ngalawa & Ngare, 2014). When there are no ceilings on lending interest rates, it is easier for banks to charge a higher risk premium, making investments riskier as borrowers have to pay more for their loans with no guarantee that these investments will pay back. Fluctuation in lending interest rates largely affects a bank’s returns as it changes its net interest income and the level of operating expenses and interest-sensitive income (Hanweck & Ryu, 2005). Commercial banks largely derive income from its securities and lending portfolio. Loan portfolios represent a large portion of bank assets thereby implying that interest and fees earned are vital sources of the bank’s income. For commercial banks to effectively handle borrowers’ default risk, they should charge higher premiums on their lending rates. Consequently, commercial banks issue loans and take deposits with different maturities and at different rates of interest (Gardner & Mills, 2005).
Several studies have been undertaken to investigate interest rates changes and profitability in developed economies. (Flannery, 2011) found a negative relation between the bank interest rates and bank net asset position. (Mbai,
2006) found out that proper interest rate management reduced bank exposure to risk and provides an opportunity to stabilize and improve their net income.
(Ndung’u, 2003) carried out a study on the determinants of profitability for quoted commercial banks in Kenya with findings revealing that sound asset and liability management had significant influence on profitability. (Gichure, 2015) found out that poor performance of commercial banks puts pressure on them to retain high lending rates in an attempt to minimize the losses associated with non-performing loans. (Kipng’etich, 2011) did a study which concluded that if banks were to attain higher profitability levels, changes in interest rates would be among the key determinants for consideration. With varied conclusions highlighted by the above studies, it became necessary to conduct a study that would establish the effect that the determinants of lending interest rate volatility had on the profitability of commercial banks in Kenya.
General Objective of the Study
The general objective of the study was to determine the effect that the determinants of lending rate fluctuations have on profitability of commercial banks in Kenya.
Specific Objectives
i.
To examine the effect of Borrowers’ Default Rate (BDR) on the profitability of commercial banks in Kenyaii.
To determine the effect of CBK Liquidity Ratio on the profitability of commercial banks in Kenyaiii.
To determine the effect of CBK Cash Reserve Ratio (CRR) on the profitability of commercial banks in Kenyaiv.
To determine the effect of Inflation Rate on the profitability of commercial banks in Kenyav.
To determine the effect of Maturity Mismatch Risk on the profitability of commercial banks in Kenyavi.
To determine the combined effect of determinants of lending interest rate volatility on profitability of commercial banks in KenyaResearch Hypothesis
i. H01: Borrowers’ Default Rate (BDR) has no effect oncommercial bank profitability in Kenya ii. H02: CBK Liquidity Ratio hasno effect on commercial bank profitability in Kenya
iii. H03: CBK Cash Reserve Ratio (CRR) has no effect on commercial bank profitability in kenya iv. H04: Inflation Rate has no effect on the profitability of commercial banks in kenya
v. H05: Maturity Mismatch Risk has no effect on commercial bank profitability in Kenya
vi. H06: Determinants of lending interest rate fluctuations have no effect on commercial bank profitability in Kenya
Theoretical Perspective
The theories below discuss interest rates, their fluctuation or changes and how they affect the different consumers in the market, specifically the banking industry.
Market Segmentation Theory
This modern theory was proposed by Fredrick Lutz in 1980. This theory assumes that markets for different maturity bonds are completely segmented. The interest rate for each bond with a different maturity is then determined by the supply of and demand for the bond with no effects from the expected returns on other bonds with other maturities. It maintains that short-term and long-term rates are distinct markets, each with its own buyers and sellers, and are not easily substituted for each other. This theory portrays individual and financial investors as having preferred investment horizons that are dictated by the nature of liabilities they hold. This theory states that lenders and borrowers sought different maturities other than their preferred or usual maturities (their usual habitat). An absolute to this theory is that, if an investor wants to go out of their sector, they would want to be compensated for taking on that additional risk. This theory is also known as Preferred Habitat Theory (Davies & Vaught, 2011).
Liquidity Preference Theory
This theory was proposed by John Maynard Keynes in 1936. This theory suggests that an investor demands a higher interest rate, or premium, on securities with long-term maturities, which carry greater risk, because all other factors being equal, investors prefer cash or other highly liquid holdings. According to this theory, interest rates on short-term securities are lower because investors are not sacrificing liquidity for as long as they would be with medium to long-term securities (Keynes, 2005).
This theory views bonds of different maturities as substitutes, but not perfect substitutes. Investors prefer short rather than long bonds because they are free of inflation and interest rate risks. It predicts that interest rates of different maturities will move together because the long-term rates are essentially tied to the short-term rates. Long rates will also be less volatile because part of the long rate, which is just an average of the short rates, will smoothen out the volatility in the short rates. According to this theory, investors would always prefer short-term securities to long-term securities. In order to encourage them to hold long-term securities, they should yield higher interests than short-term securities.
Loanable Funds Theory of Interest Rates
This theory was proposed by Dennis Robertson in the 1930s. According to this theory, the rate of interest is determined by the demand for and supply of funds in the economy at that level in which the two are equated. It is thus a standard demand-supply theory as applied to the market for loanable funds (credit), treating the rate of interest as the price for the acquisition of such funds. Some of the assumptions include; the market for loanable funds being fully integrated – not segmented, characterized by perfect mobility of funds throughout the market. There is perfect competition in the market; the forces of competition are expected to clear the market so that one single rate of interest is the market (or equilibrium) rate of interest. This theory assumes that lending interest rates are determined by the supply of loanable funds and demand for credit (Robertson, 1930). The demand for loanable funds originates from domestic and foreign borrowers, consumers as well as governments, while the supply is generated by domestic savings, money circulation via banking systems and foreign lending (Hanweck & Ryu, 2005). With these factors determining long-term interest rates, short-term rates are decided by financial and monetary conditions in the economy
Determinants of Lending Interest Rate Fluctuation
As indicated earlier, lending interest rate fluctuation is realized when there are movements in rates, with high fluctuation implying rapid and large upward and downward movements over a relatively short period of time and low fluctuation implying much smaller and less frequent changes in interest rates. Determinants of lending interest rate volatility could be categorized into bank-specific, macroeconomic, or industry specific (Ronald & Mohammed, 2003). Bank-specific determinants include customer deposit level, demand for loanable funds, bank size, customer default risk, assets and liabilities portfolios, bank policies etc. Macroeconomic determinants include expected inflation rates, exchange rates, discount rate, government policy etc. Industry-specific determinants include CBK regulatory requirements and ratios, competitor rates, monetary and fiscal policies among others. This study will focus on borrowers’ default risk, inflation rate, CBK reserve requirements and maturity mismatch of assets and liabilities as they largely influence the profitability of commercial banks in terms of interest income earned (Saunders & Schumacher, 2003). These determinants are discussed broadly below.
Borrowers’ Default Risk
Default risk is considered as one of the most important determinants that explain changes in lending interest rates. Loan defaults occur when borrowers are not willing and/or unable to repay loans (Jarnér & Nguyen, 2011). Among the many factors, high lending interest rate is the most important factor which influences the borrowers’ ability to repay loans. (Chirwa & Mlachila, 2004) found that extremely high interest rates were detrimental to investment and growth. Even with the application of a number of remedial measures, such as supplying fresh loans, loan rescheduling, imposition of penal interest rates, denial of additional credit to repeat defaulters, management takeover of problematic projects, and legal actions, loan default problems continue to reign the credit markets in developing countries (Mills, 2005).
Central Bank of Kenya Regulatory Ratios
CBK in its quest to regulate the financial markets has instituted monetary policy measures aimed at supporting stability in the exchange rate and striving for the principal goal of achieving low inflation. As part of the measures
that it employs is the enforcement of minimum (or regulatory) liquidity and reserve ratios that banks must adhere to (CBK, 2011). Presently, two sets of regulatory ratios, Liquidity Ratio that measures the value of liquid assets that a commercial bank has as a percentage of liabilities to the public. The requirement by CBK is that 27% of a commercial banks’ public liabilities should be in liquid form and available on demand; which means that at least 27% of the total balance sheet assets are maintained as liquid funds or near cash assets (equivalent assets); and Reserve Ratio (Cash Reserve Ratio – CRR) which is what commercial banks are presently required to maintain at 5.25% (CBK, 2015).
Mismatch in maturities of Assets and Liabilities (Maturity Mismatch Risk)
This results from time differences in the maturity (for fixed rate) and re-pricing (for floating rate) of assets and liabilities. While such mismatches are fundamental to the business of banking, they can expose a banking institution’s income and underlying economic value to unanticipated fluctuations as lending interest rates vary (Brousseau & Durré, 2013). This risk is often gauged by comparing the volume of a bank’s assets that mature within a given time period with the volume of liabilities that do so. Commercial banks whose asset maturities are longer than their liability maturities are said to be “liability sensitive,” as their liabilities will change more quickly. The returns of a liability-sensitive bank increase when lending interest rates fall and vice versa. On the other hand, an asset-sensitive bank (those whose asset maturities are shorter than liability maturities) would generally benefit from increased lending interest rates and be hurt by decline in rates (BCBS, 2010). .
Inflation Rate
Inflation affects lending interest rate because it affects the value of money promised in future. The rate of interest quoted in the financial market (market interest rate) is sometimes compared with the real rate of interest, which is the observed market rate, corrected for price changes (inflation). Expectations of high inflation causes savers to require higher nominal (market) interest rate, as it is the only way they can maintain the existing real rate of interest. Real interest rate is measured as nominal interest rate minus expected inflation rate, because an expectation about future inflations definitely affects market interest rate. This affects interest rate levels, the higher the inflation rate, the more lending interest rates are likely to rise. This occurs because lenders would demand higher premium rates as compensation for the decrease in purchasing power of the money they would expect to be repaid in the future (KIPPRA, 2015).
Lending Interest Rate Fluctuation and Banking Activities
Changes in lending rates is the extent to which the interest rate changes over time. High change implies rapid and large upward and downward movements over a relatively short period of time; with low changes implying much smaller and less frequent changes in value. Changes in lending interest rates have adverse effects both on a bank’s earnings and its economic value (CBK, 2015). Every financial transaction that a commercial bank engages in exposes it to unexpected interest rate changes. However, banks differ in the degree and level of risk that they would be willing to be exposed to; and in the same breathe, some banks would seek to minimize this exposure (Ballester, Ferrer, Gonzalez, & Soto, 2009). Such banks generally do not deliberately take positions to benefit from a particular movement in lending interest rates, but rather, they try to equate the dates for re-pricing and maturities of both their assets and liabilities. Some other banks may be willing to take on higher levels of risk and also choose to assume certain positions on interest rates or decide to leave them optional (Mahshid & Naji, 2003).
Fluctuations in the general level of lending interest rates may impact on the volume of some types of banking activities that mostly generate fee-related income. An example could be volumes of residential loans that typically decline as lending interest rates rise, which in turn results in lower mortgage fees. On the other hand, mortgage payments or servicing mostly face slower repayments when lending interest rates are rising as borrowers are less likely to do refinancing. Consequently, expected fee income and economic value that would arise from servicing related mortgage business may increase or stabilize in periods of gradual rise
Conceptual Framework: Below is a diagrammatic representation of the variables that were used for the study. It shows clearly how the dependent variable is relating to the independent variables.
Independent Variables Intervening Variable Dependent Variable Figure 1 Source: Researcher Research Methodology Target population
The study employed a descriptive research design. The population under study was all 42 commercial banks in the Kenyan market, inclusive of two that are in receivership (Chase Bank and Imperial Bank). CBK classifies commercial banks into tiers, tier 1 consisting of 8 banks, tier 2 consisting 9 banks, tier 3 consisting of 25 banks as shown below. This categorization was as on August, 2017 as summarized in Appendix II
Population Distribution
Commercial Banks’ Categories Population
Tier 1 8 Tier 2 9 Tier 3 25 Total 42 CBK Liquidity Ratio Borrowers’ Default Rate (BDR) CBK Cash Reserve Ratio ( CRR ) Inflation Rate Maturity Mismatch Profitability • NIM • Lending Interest Rate • Firm Size • Ethical Standards
Sample
The study employed a stratified sampling design that aided in capturing the specific characteristics of different commercial banks that influence the lending interest rate volatility. This method involved dividing the population into smaller groups called ‘strata’ based on their shared characteristics, each stratum was then taken in a number proportion to the stratum’s size when compared to the population, then pooled to form a sample (Kothari, 2008). This sampling involved three strata namely Tier 1, Tier 2 and Tier 3 commercial banks in Kenya as depicted below. Two formulas by W. G. Cochran (1977) and Toby Yamane were used to compute the study sample size as well as the number of banks in each tier (stratum), (Cochran, 2004). The study sample size was computed using the first formula and 20 was arrived at, whereas the second formula was used to determine how many banks would be sampled from each tier.
n=N/ 1+{(N-1)/N} n= 42/ 1+ {(42-1)/42} = 20
Where;
i = Tier 1, Tier 2 and Tier 3
ni = computed sample size from Tier i n = desired sample size from the population Ni = estimated population of each stratum (Tier) i N = estimated population size.
Sample Size Distribution
Commercial Bank Categories Strata Size (Ni) Sample Size (ni)
Tier 1 6 3
Tier 2 11 6
Tier 3 25 11
Total 42 20
Data collection
Secondary data was used to conduct this study. Data on profitability was accessed from audited annual financial statements and reports of the specific banks. Data on inflation rates for the years 2010-2015 was obtained from the KNBS. Data on reserve requirements (data that was related to CRR and Liquidity Ratio) was obtained from the CBK bank supervision reports.
Data Analysis and Presentation
This study used quantitative method of analysis with the aid of SPSS (Statistical Package for Social Sciences). Data collected was coded and entered into excel sheets. Both descriptive and inferential statistics was used to analyze the data. Descriptive statistics involved the use of mean, standard deviation, minimum and maximum values of the variables, with tables being used to highlight the observable trends and patterns of the findings. The results of the study findings were organized, summarized and presented using tables. Inferential statistics included the use of regression model to show the combined relationship between the variables; the Pearson’s correlation matrix was used to test the hypotheses at 95% confidence level. The SPSS software was used to generate the beta values for the specific variables under study. The regression model assumed the format shown below.
Y = β0 + β1X1 + β2X2 + β3X3 + β4X4 + β5X5 + ε
Where:
β0 = Constant, (co-efficient of intercept – the value of dependent variable when independent variable is zero). ε = Error term
X1 represents the Borrowers’ Default Rate (BDR) X2 represents the CBK Liquidity Ratio
X3 represent the CBK Cash Reserve Ratio (CRR) X4 represents the Inflation Rate
X5 represents the Maturity Mismatch Risk
Below is a summary of how the above variables were measured.
Results and Discussion Descriptive Statistics Net Interest Margin (NIM)
Table 1 below gives a summary of the mean, standard deviation, maximum and minimum values of the dependent variable NIM. The averages annual NIM for the banks range between a high of 6.82% and low of 6.02%. The year 2013 had the highest average NIM of 6.82%, while the year 2015 had the lowest NIM of 6.02%. The highest maximum value was 14.92% registered in the year 2012 with the minimum value of 0.95% registered the same year. The standard deviation of data ranges between 1.94% and 3.19% depicting a minimal variation. Given that NIM is the difference between interest paid on deposits and interest earned from loans against interest earning assets, commercial banks that have higher NIMs register higher profits. The standard deviation throughout the study period was lower than the mean values, which depicts that these commercial banks posted profits generally with limited variations.
Table 1: Net Interest Margin (NIM)
YEAR MEAN NIM STD DEV MAX MIN
2010 6.04% 2.47% 12.33% 1.11% 2011 6.25% 2.61% 12.67% 1.21% 2012 6.25% 3.19% 14.92% 0.95% 2013 6.82% 2.43% 13.82% 3.74% 2014 6.22% 2.19% 11.38% 1.55% 2015 6.02% 1.94% 9.64% 1.53% AVERAGE 6.27% 2.47% 12.46% 1.68%
Borrower’s Default Rate (BDR)
Table 2 below highlights the mean, standard deviation, maximum and minimum values for borrower’s default rate. The year 2013 had the lowest mean default rate of 2.22% and 2015 had the highest rate of 2.86%, with the highest maximum rate of 17.59% in 2015, and the lowest rate of -5.22% being posted in 2010. The standard deviation values range between 1.89% and 3.29%, which shows a small variability in the default rate. Borrower’s default rate measures the amount of bank loans that are non-performing or in default or close to default; therefore, the higher the rate is the higher the provision for bad debts, which translates to lower profits. Commercial banks should strive to have quality loan books that depict manageable NPLs to total loans ratio. Standard deviation values for the years 2010 and 2011 were higher than the minimum values, meaning that some commercial banks posted losses.
Table 2: Borrower’s Default Rate (BDR)
YEAR MEAN BDR STD DEV MAX MIN
2010 2.79% 3.29% 11.28% -5.22% 2011 2.51% 2.74% 11.75% -2.50% 2012 2.65% 2.46% 10.49% 0.07% 2013 2.22% 1.89% 8.25% 0.09% 2014 2.33% 1.91% 7.79% 0.10% 2015 2.86% 3.01% 17.59% 0.15% AVERAGE 2.56% 2.55% 11.19% -1.22% CBK Liquidity Ratio
Table 3 below shows the mean, standard deviation, maximum and minimum values of the stipulated CBK liquidity ratio for commercial banks. The year 2013 posted the highest liquidity ratio of 32.07% and the lowest ratio of 30.68% being posted in 2010. The standard deviation values gave a range of 6.37% and 8.34% that depicting minimal variability in the profitability of banks. CBK requires that commercial banks maintain at least 27% of their assets in liquid or near liquid state; these assets should be available on demand. The highest maximum value of 58.10% was recorded in 2010 with the minimum of 14.79% being posted the same year. This means therefore that the extremely high liquidity ratios only reduce profitability if banks are above their optimal liquidity level (27%), which is what is already stipulated by CBK. Commercial banks with higher liquidity ratio are able to survive and improve on their profitability in the future, especially in a competitive market where these higher levels act as an effective guarantee of the bank’s solvency allowing the bank to offer more surplus to borrowers. Higher ratios would equally mean that commercial banks in Kenya prefer to invest in safe, short-term investments as compared to credit loans that attract much higher rates.
Table 3: CBK Liquidity Ratio
YEAR MEAN CBK
LIQUIDITY RATIO
STD DEV MAX MIN
2010 30.68% 8.28% 58.10% 14.79% 2011 31.38% 6.70% 46.35% 16.77% 2012 32.07% 6.60% 50.23% 17.34% 2013 31.75% 6.58% 47.43% 17.20% 2014 30.75% 6.37% 44.05% 15.32% 2015 31.67% 8.34% 49.02% 16.07% AVERAGE 31.38% 7.15% 49.20% 16.25%
CBK Cash Reserve Ratio (CRR)
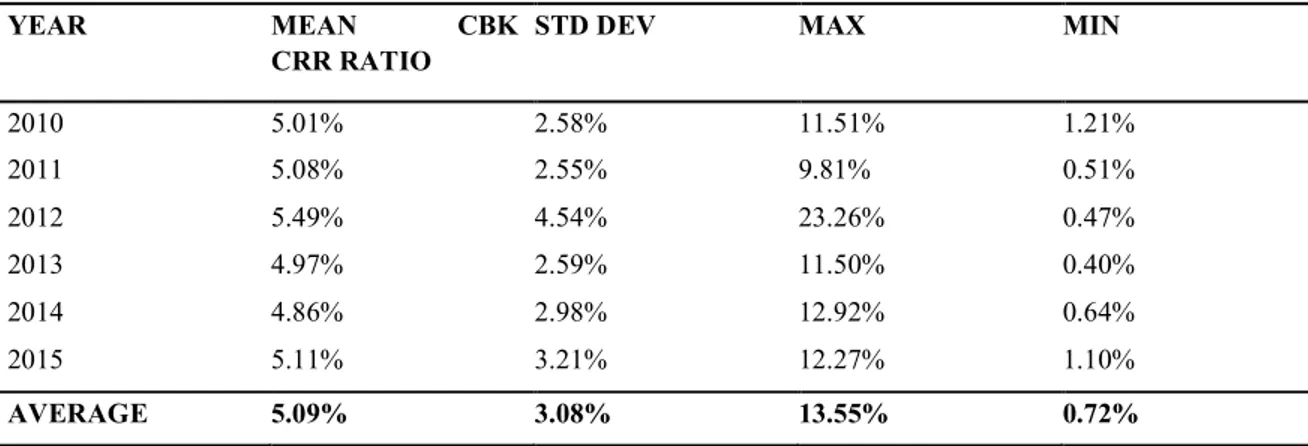
Table 4 below shows the mean, standard deviation, maximum and minimum values for CBK cash reserve ratio. CBK stipulates that all commercial banks should maintain at least 5.25% of their reserves with CBK, failure to which severe penalties are expected. In 2012, the highest CRR of 23.26% was recorded with the lowest of 9.81% recorded in 2013. In 2015, the highest mean of 5.11% was recorded with a low of 4.86% being in 2014. The standard deviation values ranged within 2.55% and 4.54%. Commercial banks that constantly post high CRR levels than the required are considered stable to handle any cash crisis to sort challenges as operational costs, this also means that normal operations of a bank cannot be interfered with. On the other hand, banks with minimal CRR could face all sorts of problems including being unable to lend to their clients, which would mean that they don’t collect expected interest income from products as loans leading to lower profits or posting losses altogether.
Table 4: CBK Cash Reserve Ratio (CRR)
YEAR MEAN CBK
CRR RATIO
STD DEV MAX MIN
2010 5.01% 2.58% 11.51% 1.21% 2011 5.08% 2.55% 9.81% 0.51% 2012 5.49% 4.54% 23.26% 0.47% 2013 4.97% 2.59% 11.50% 0.40% 2014 4.86% 2.98% 12.92% 0.64% 2015 5.11% 3.21% 12.27% 1.10% AVERAGE 5.09% 3.08% 13.55% 0.72%
Maturity Mismatch in Assets and Liabilities
Table 5 below shows the mean, standard deviation, minimum and maximum values for the maturity mismatch in commercial bank assets and liabilities. The year 2015 recorded the highest mismatches whereas 2010 posted the lowest. The annual deviation values range between 1.21% in 2013 and 5.61% in 2011, with maximum values ranging between 51.36% in 2010 and 73.59% in 2015, the minimum values averaging between 44.78% in 2010 and 66.66% in 2015. The mean annual maturity mismatch levels ranged between a high of 62.48% in 2015 and a low of 52.93% in 2010. Higher percentages of mismatches translate to decreased profitability when compared to the lower maturities mismatches; which means that commercial banks that record high asset and liability mismatch post lower returns than they previously did and not necessarily the lowest within the industry at a particular time and vice versa.
Table 5: Maturity Mismatch Risk
YEAR MEAN
MATURITY
MISMATCH
STD DEV MAX MIN
2010 52.93% 4.65% 51.36% 44.78% 2011 57.94% 5.61% 56.56% 48.62% 2012 57.63% 2.58% 55.32% 51.67% 2013 58.53% 1.21% 58.71% 57.00% 2014 61.09% 4.88% 68.46% 61.56% 2015 62.48% 4.90% 73.59% 66.66% AVERAGE 48.68% 3.97% 60.67% 55.05% Inflation Rate
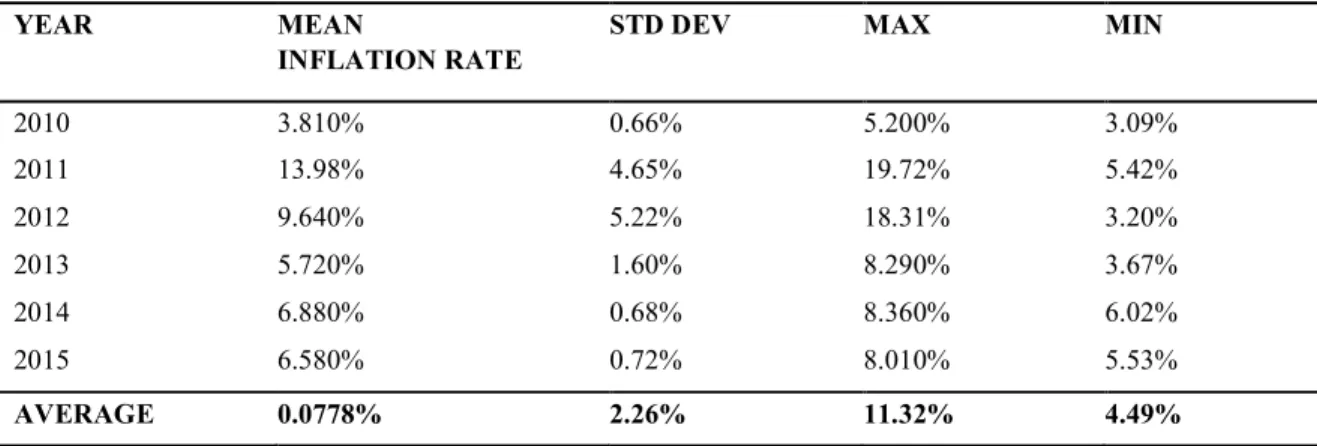
Table 6 highlights the mean, standard deviation, maximum and minimum values for the annual inflation rate in the country. The year 2011 posted the highest average mean of 13.98% as compared to the year 2010 that posted the lowest mean rate of 3.81%. The annual means in Kenya are computed from monthly tallies of various sectors of the economy. Maximum values of up to 19.72% were realized in 2011 to minimum values of 3.09% in 2010. High rates translate to higher cost of living, which then leads to prioritizations of individual needs; meaning that bank clients are less likely to use the various facilities offered by the banks due to the minimal savings realized. This then results in products such as loan books being smaller which then largely affects the profits announced by various commercial banks. Higher inflation rates as depicted in the year 2011 could be good for borrowers, for example if a business borrows money, it gets cash it can use now that it can pay back later. Since inflation causes the value of currency to decline over time, cash now is worth more than cash in the future.
Table 6: Inflation Rate
YEAR MEAN
INFLATION RATE
STD DEV MAX MIN
2010 3.810% 0.66% 5.200% 3.09% 2011 13.98% 4.65% 19.72% 5.42% 2012 9.640% 5.22% 18.31% 3.20% 2013 5.720% 1.60% 8.290% 3.67% 2014 6.880% 0.68% 8.360% 6.02% 2015 6.580% 0.72% 8.010% 5.53% AVERAGE 0.0778% 2.26% 11.32% 4.49% . Inferential Statistics Correlation Matrix
Pearson’s Correlation Matrix is used to test the degree of association between two or more variables, in terms of strength and direction, with values ranging from -1 (showing a perfect negative linear relationship) to +1 (showing a perfect positive linear relationship), and zero indicating no relationship between the variables (Mugenda & Mugenda, 2012).
Correlation coefficient results on table 4.10 below shows that Borrowers’ Default Rate (BDR) had a negative correlation coefficient r = -0.789, indicating that when BDR increases, NIM of commercial banks decreases. CBK Liquidity Ratio (LQDTY) had a positive and significant (as indicated by the asterisk) correlation coefficient r = 0.567, which means that an increase in liquidity would translate into an increase in NIM of banks. The correlation between liquidity and NIM is strong as 0.567 is closer to 1. CBK CRR presents a positive and significant (as indicated by the asterisk) correlation coefficient r = 0.609, which translates to an increase in NIM of banks with an increase in cash reserve ratio. The correlation between CRR and NIM is strong as 0.609 is closer to 1; this relationship is stronger than the other variables. Maturity Mismatch Risk (MMR) had a negative correlation coefficient r = 0.258, which means therefore that an increase in maturity mismatch risk results in a decrease in NIM of commercial banks in Kenya. Inflation Rate had a negative correlation coefficient r = -0.317, which means that with an increase in inflation rates, there would be a decrease in NIM of banks accordingly.
Table 7: Correlation Coefficient Results BDR LQDTY CRR MMR INFLATIO N NIM BDR Pearson Correlation Sig. (2-tailed) N 1 20 LQDTY Pearson Correlation
Sig. (2-tailed) N -.189* 1 .426 20 20 CRR Pearson Correlation Sig. (2-tailed) N -.318* -.230 1 .172 .330 20 20 20 MMR Pearson Correlation Sig. (2-tailed) N .133 -.534* .015 .178 .454 1 .577 20 20 20 20 INFLATIO N Pearson Correlation Sig. (2-tailed) N -.394 .206 -.121 -.101* 1 20 .085 .383 .611 .671 20 20 20 20
NIM Pearson Correlation Sig. (2-tailed) N -.789 .567* .609* .-258 -.317 .623 20 1 .708 .481 .648 .272 20 20 20 20 20
*. Correlation is significant at the 0.05 level (2-tailed).
Regression analysis
This is a quantitative research method used when the study involves analyzing several variables, where the relationship includes a dependent variable and one or more dependent variables; this analysis aids in understanding between the independent variables and the dependent variable. This analysis consists of the model summary, analysis of variance and the results of regression coefficients. The coefficient of correlation (R) shows the degree of relationship between two or more variables, it measures the nature and strength of the relationship between the variables. This study used the Adjusted R-Square to show the goodness of fit of the regression model; this is because it only increases if the new term added improves the model by being relevant to the study, and decreases when the added predictor adds no relevance to the study. The coefficient of determination (R-Square) was not used as it shows some bias between the variables; it continually increases when new variables are added to the model with disregard of the relevance of those variables to the study.
Table 8: Model Summary
Model R R Square Adjusted R Square Std. Error of the Estimate
1 .826a .757 .684 .32834
a. Predictors: (Constant), Inflation Rate, CBK Cash Reserve Ratio, CBK Liquidity Ratio, Borrowers' Default Rate (BDR), Maturity Mismatch Risk
According to the model summary on table 8 above, the coefficient of correlation (R) is .826 (82.6%) which portrays a strong relationship between the variables. The coefficient of determination (R-Square) is .757 (75.7%), which means that the independent variables tested (Maturity Mismatch-MM, Inflation Rate, Liquidity Ratio, Cash Reserve Ratio-CRR) contributed to 75.7% variation in the profitability (NIM) of commercial banks. The Adjusted R-Square is .684 (68.4%) which shows that the above independent variables explain 68.4% of the changes in the profitability of commercial banks in Kenya at a 95% confidence level. This means that other factors, or in this case other determinants not discussed in this study contributed 31.6% variation in the profits of commercial banks.
Table 9 ANOVAa
Model Sum of Squares Df Mean Square F Sig.
1 Regression .005 5 .001 18.904 .009b
Residual Total
.012 114 .001
.017 119
a.
Dependent Variable: Net Interest Margin (NIM)b.
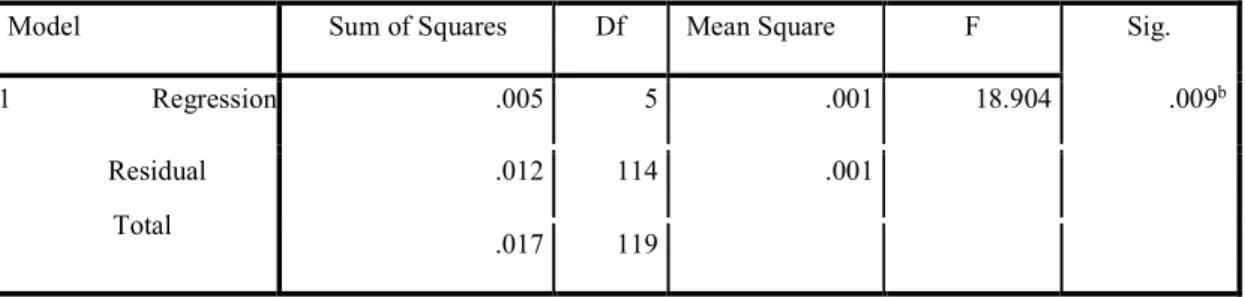
Predictors: (Constant), Inflation Rate, CBK Cash Reserve Ratio, CBK Liquidity Ratio, Borrowers' Default Rate (BDR), Maturity Mismatch RiskThe ANOVA (Analysis of Variance) results on table 9 above shows that the F value of 18.904 was statistically significant at 0.009, which was less than 0.05. This depicts a linear relationship among the variables under study and also that the model had a less than 0.05 likelihood of giving a wrong prediction. The above results also show that the independent variables (Inflation Rate,
CBK Cash Reserve Ratio, CBK Liquidity Ratio, Borrowers’ Default Rate and Maturity Mismatch Risk) used were statistically significant in predicting the profitability of commercial banks in Kenya at 95% significance level.
Table 10: Coefficientsa Model Unstandardized Coefficients Standardized Coefficients T Sig. B Std. Error Beta (Constant) Inflation Rate
CBK Cash Reserve Ratio CBK Liquidity Ratio
Borrowers’ Default Rate (BDR) Maturity Mismatch Risk
.360 .196 11.305 .002 -.054 .041 -.674 -1.316 .004 .109 .277 .036 .026 .454 .286 4.512 4.650 .000 .000 -.416 .015 -.016 -.934 .034 -.118 .028 -.037 -.428 .024
a. Dependent Variable: NIM
Testing of Hypothesis
This is utilized in reference of research study to evaluate and analyze the results with the goal being to either accept or reject the null hypothesis. Terms used include test statistic which means that the decision whether to accept or reject the null hypothesis is made based on this value; therefore, if the calculated test statistic value is less than the critical value, we accept the hypothesis, otherwise, we reject the hypothesis (Saunders & Cornett, 2003). Another term is the level of significance, which is the confidence at which a null hypothesis is accepted or rejected, which is sometimes also referred to as test of significance of data. The deciding factor in all the tests was that if the P value observed was less than the set alpha at a confidence level of 0.05, then we reject the null hypothesis and accept the alternative hypothesis, and accept the null hypothesis if the P value observed was greater than the set alpha of 0.05.
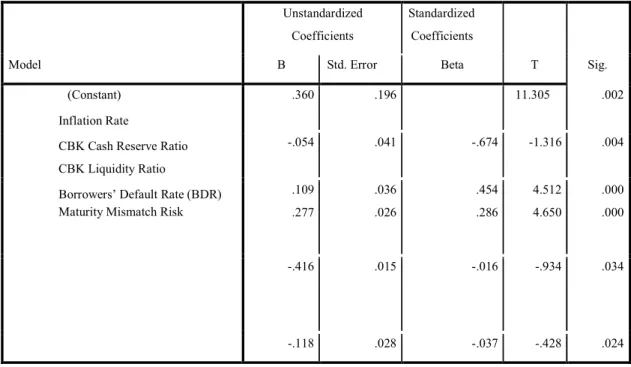
The coefficient results in table 10 above shows that borrower’s default rate (BDR) had a negative (-0.416) effect on the NIM of commercial banks (p = 0.304>0.05). The results depict that the CBK cash reserve ratio had a positive (0.109) and statistically significant (t-test value = 4.512) effect on the NIM of commercial banks. The CBK liquidity ratio had a positive (0.277) but statistically significant effect (t-test value = 4.650) on the NIM of commercial banks. Inflation rate had a negative (-0.054) on the NIM of commercial banks. Mismatch in maturities of bank assets and liabilities had a positive (0.118) on the NIM of commercial banks in Kenya. The generated regression equation was as below:
Y = 0.360 - 0.416X1 + 0.277X2 + 0.109X3 – 0.054X4 - 0.118X5
From the above multiple regression model, with all the independent variables (BDR, CBK Liquidity Ratio, CBK CRR, Inflation Rate and Maturity Mismatch) being held constant, the NIM (profitability of commercial banks in Kenya) would be achieved at a unit of 0.360. The study findings also depicted that when other independent variables are at zero, a unit increase in BDR would result in a decrease in profitability by 0.416, a unit increase in CBK liquidity ratio would result in 0.277 increase in profitability; a unit increase in CBK CRR would result in 0.109 increase in profitability; a unit increase in inflation rates results in a decrease in profitability by 0.054 and a unit increase in maturity mismatch would result in profitability decrease of -0.118.
From H01: Borrower’s Default Rate (BDR) has no effect on commercial bank profitability in Kenya. Coefficient results on table 10 above established a negative but statistically significant effect on profitability of commercial banks with a Beta value = -0.016 (p-value = 0.034 which is less than 0.05). Given that the p-value is
less than 0.05, we reject the null hypothesis and accept the alternative hypothesis. In a study by Mwangi (2014) on the effect of bank interest rates on the NPLs of Kenyan commercial banks and found out that high default rates resulted in increased NPLs which would then reduce the profits realized. These findings were similar to this study. Results from the study findings show that borrowers’ default rate (BDR) had a negative effect on profitability of commercial banks, though it was significant. This means that commercial banks that post higher default rates especially through non-performing loans are more likely to post lower returns or even losses. This is detrimental especially to smaller banks (tier 3 banks) that have limited capital bases that could cover the loan loss provision for bad debts. It is vital that NPLs are always monitored to ensure that the defaulting loans can be covered by the provision and that they do not eat into the profits of the bank.
In H02: CBK Liquidity ratio has no effect on commercial bank profitability in Kenya. According to the coefficient results on table 10 above, the study established that the Beta and pvalues were positive and significant (Beta = 0.286, p = 0.000); we therefore reject the null hypothesis and accept the alternative hypothesis as the p-value of 0.000 is less than 0.05. The ttest p-value of 4.650 depicts that the variable is statistically significant. A study done by Beutler & Bischel (2015) on interest rates and bank lending found out that the Liquidity Ratio maintained by commercial banks highly impacted on the returns realized and that these levels also dictated how capital sufficient a bank was; these findings and conclusions are in line with the findings of this study. The CBK liquidity ratio had positive effect on the profitability (NIM) of commercial banks. The CBK stipulates that a minimum of 27% of all bank assets be maintained in liquid or near liquid form, and could be accessed when needed. This cash is meant to supplement the capital requirements of the bank in emergent situations. From the study findings, tier 1 and tier 2 commercial banks were mostly able to meet and surpass this limit, with a few tier 3 meeting the limit consecutively within the six-year study period
In H03: CBK Cash Reserve Ratio has no effect on commercial bank profitability in Kenya. The coefficient results highlighted on table 10 above indicate that there exists a positive and statistically significant effect on the profitability (NIM) of commercial banks. The Beta value of 0.454 and p-value of 0.000 was significant as it was less than 0.05. We therefore reject the null hypothesis and accept the alternate as the p-value of 0.000 was less than 0.05. The t-test value was 4.512 which is greater than 2 showing that the variable is statistically significant. A study done by Ndung’u (2003) on determinants of profitability among listed commercial banks found out that the cash reserve ratio levels stipulated by CBK contributed largely to the profits among other factors. This is similar to the results from this study. The CBK cash reserve ratio (CRR) had positive effect on profitability that was significant at 0.478. This means that most of the commercial banks are able to meet or exceed the statutory limit stipulated by CBK of 5.25%. Commercial banks are required to maintain a minimum of 5.25% of their reserve cash with CBK for emergency purposes, for example to supplement their ongoing operational costs during difficult times. From this study the Tier 1 banks (BBK, Cooperative Bank of Kenya, KCB) have easily surpassed this limit thus ensuring their stability, with the tier 3 banks struggling to meet the threshold.
According to H04: Inflation Rate has no effect on commercial bank profitability in Kenya, this study sought out to establish whether the Inflation Rate had any influence on the profits realized by Kenyan commercial banks. From the coefficient results on table 10, there was a negative but statistically significant effect (Beta value = -0.674, p = 0.004) between the Inflation Rate and profitability (NIM) of commercial banks. We therefore reject the null hypothesis and accept the alternate as the p-value is less than 0.05. A study done by Maigua & Gekara (2016) on the relationship between the determinants of interest and profitability of Kenyan commercial banks found out that Inflation Rates among other micro economic factors had a negative but significant effect on the profits of banks and that proper monitoring of these factors was vital. This was in line with the findings of this study. The inflation rate had a negative and significant effect on the profitability of commercial banks. This depicted an inverse relationship whereby when one variable, say inflation increases, profitability of commercial banks decreases and vice versa. When inflation rate increases, prices of products and services increase, this results in the cost of living going up and savings of borrowers’ decreasing. This would mean therefore that services provided by financial institutions as banks are minimally consulted and products such as loans suffer, which would impede on the interest income (fee) earned from loans and thus a decline in profits of the commercial banks.
In H05: Maturity Mismatch Risk has no effect on commercial bank profitability of commercial banks in
Kenya, this study sought to determine whether mismatch in the maturities of bank assets and liabilities had any effect on the profits of commercial banks in Kenya. The coefficient results on table 4.13 above established a negative but significant effect on the NIM with Beta value of -0.037 and p-value of 0.024. We therefore reject the null hypothesis and accept the alternative as the p-value of 0.024 is less than 0.05. In a study done by Ng’alawa
commercial banks in Kenya. Craigiey (2011) did a comparison study that assessed the impact of Interest Rate changes in both New Zealand and Australian banks and found out that maturity mismatches brought about by the rampant conversion of short-term liabilities to long term assets which resulted in a reduction in profits. Both studies gave the same findings as presented in this study. The maturity mismatch (MM) had a negative and significant effect on the profitability of commercial banks. This means that banks that show higher disparities or imbalances in the maturity levels of both their assets and liabilities are more likely to post significantly lower profits. Tier 1 (large banks) and tier 2 (mid-sized) commercial banks for instance have managed to strike a comfortable balance between the maturity periods of their assets and liabilities as compared to tier 3 (smaller banks).
In H06: Determinants of lending interest rate volatility have no effect on commercial bank profitability in
Kenya, this study sought to determine the combined effect that determinants of lending interest rate volatility have on the NIM (profitability) of commercial banks in Kenya. The results from the regression analysis on table 4.13 above shows that the determinants of lending interest rate volatility (BDR, Liquidity Ratio, CRR, Maturity Mismatch, and Inflation Rate) have a significant effect (positive or negative) on the NIM (profitability) of commercial banks in Kenya. A unit increase in CBK Liquidity Ratio and Cash Reserve Ratio results in an increase in the profits, whereas a unit increase in BDR, Mismatch Risk and Inflation Rate would decrease the profits accordingly. The p-values of all the independent variables was below 0.05 which implied therefore that we reject the null hypothesis, which stated that the determinants of lending interest rate volatility have no effect on the profitability of commercial banks; and accept the alternate hypothesis that determinants of lending interest rate volatility have an effect on the profitability of commercial banks in Kenya. The t-test values for CBK liquidity ratio and CBK CRR are greater than 2 showing significance of these variables to the study.
Mwangi, (2014) did a study on the effect of interest rates on non-performing loans in Kenyan commercial banks, with findings indicating that there was a negative but significant relationship between interest rates and performance. Khan and Sattar, (2014) did a study on the effect of interest rate changes on the profitability of four commercial banks in Pakistan and found a strong positive correlation between interest rate changes and profitability .
Conclusion
The study established that the profitability of commercial banks is highly dependent on the already discussed determinants of bank lending interest rate volatility. These determinants contribute differently to the profits realized annually and how commercial banks choose to monitor them is crucial to their stability. Higher levels of Borrowers’ Default Rate, Mismatch Maturity and Inflation Rate result in decreased profitability levels; this is because high BDR results in increased numbers of non-performing loans (NPLs), high levels of inflation results in difficult living standards and reduced borrowing culture thus decreased profits, and rampant imbalances in the maturities of bank assets and liabilities results in irregular and almost certain lower profits. CBK reserve requirements (CRR and Liquidity Ratio) are critical determinants in terms of gauging the stability of commercial banks and their ability to lend out while still sustaining normal operations. Banks that fail to meet either thresholds risk not fulfilling their respective capital requirements thereby straining the available deposits to stay afloat as well as keep profitability levels. Less than required capital requirements may result in a commercial bank being de-licenced or de-registered by the CBK. As regards the maturity of bank assets and liabilities, it is vital that commercial banks are able to monitor and know exactly when to convert certain assets and liabilities to mature in the short term or long term and vice versa in order to avoid unnecessary imbalances that result in lost interest income as well as reduced profits.
The CBK uses the central bank rate (CBR) as a tool to regulate how commercial banking institutions are able to offer lending services to the public. The CBR influences the lending rate the banks are likely to charge their clients for credit; which means therefore that when the CBR rises, the lending rate charged to clients would be higher and vice versa. CBK also uses the monetary policy to influence market lending rates, the policy works by controlling the flow of money and credit within the economy and also ensuring that there is constant availability and supply of money as well as controlling inflation rate. Although the government can use fiscal policy to manage the interest rate in the market, it may take quite some time before the effect is felt on the ground (market). Similarly, laws are effective but it takes quite some time before a draft is made law.
Studies done in the past touching on lending interest rate volatility in the Kenyan banking scene are a sure justification to the relevance of this study. For instance, Ndung’u and Ngugi (2005) conducted a study on the impact of lending interest rates on NPLs and realized an inverse relationship between the two. Okoth (2011)
conducted a study on the impact of interest rate volatility on credit borrowing patterns and found out that the former has a huge impact on borrowing. This study sought to determine the effect that borrower’s default rate, CBK liquidity ratio, CBK reserve ratio, Maturity Mismatch and inflation rate had on the profitability realized by commercial banks in Kenya.
Lending interest rates have been erratic in Kenya, for example in 2011, CBK increased its base lending rate from 5% in January to 11% in October, then 16.5% in December, with the counter effect being that commercial banks increased their lending interest rates to between 20% - 25%.
This was meant by CBK to contain the inflation rate that had rose to 19.7% in November, up from 4.51% in January of the same year; this action ended up having adverse effects on both customer and companies’ borrowing and savings plan.
The management of commercial banks in Kenya should look into developing products that are income generating and do not depend on lending rates charged on already existing products. Introduction of certain new technologies have largely impeded the performance of banks as they have lost their competitive edge and allowed the entry into the market by non-bank competitors such as cooperative societies, mobile money transfer providers among others. This has automatically forced commercial banks to focus on maximizing the income generated from noninterest product sources.
.
REFERENCES
(KNBS), K. N. B. of S. (2011). Economic Review. Kenya.
Ballester, L., Ferrer, R., Gonzalez, C., & Soto, G. M. (2009). Determinants of Interest Rate exposure of spanish banking industry. Working Paper, (WP-EC 2009-07), 1–38.
Basel Committee on Banking Supervision (BCBS). (2010). Annual Banking Supervision Report.
Boahene, S. H., & Samuel, A. (2012). Credit Risk and Profitability of Selected banks in Ghana. Research Journal of Finance and Accounting, 3, No.
Brousseau, V., & Durré, A. (2013). Interest Rate Volatility A Consol Rate-Based Measure. Working Paper, (1505), 1–40.
Central Bank of Kenya (CBK). (2015). Kenyan Banking Report. Nairobi, Kenya.
Chirwa, E., & Mlachila, M. (2004). Financial Reforms and Interest Rate Spreads in he Commercial Banking Systems in Malawi. IMF Staff Papers, 51, 96–122.
Craigiey, R. (2011). An Empirical Assessment of Interest Rate Among Australian Banks. International Journal of Business and Social Science, 32(27–11), 1–13.
Davies, M., & Vaught, T. (2011). Interest Rates and Bank Profiability in South Pacific. International Journal of Sciences and Research (IJSR), 1–13.
Flannery, M. (2011). Marke Interest Rates and Commercial Bank Profitability: An Empirical Investigation.
International Journal of Finance, 1085–1101.
Gardner, M., & Mills, D. (2005). Managing Financial Institutions. International Journal of Business and Social Science.
Gichure. (2015). Relationship between Non-Interest Income and Financial Performance of Commercial Banks in Kenya. University of Nairobi.
Hanweck, G. A., & Ryu, L. H. (2005). The Sensitivity of Bank Net Interest Margins and Profitability to Credit, Interest-Rate, and Term-Structure Shocks Across Bank Product Specializations. SSRN Electronic Journal, 1–77. https://doi.org/10.2139/ssrn.886727
Jarnér, M., & Nguyen, T. (2011). Determinants of Interest Rate Exposure. LUND UNIERSITY. Kenya, C. B. of. (2011). Bank Supervision Report. Nairobi, Kenya.
Kenya, C. B. of. (2014). Banking Survey Report. Nairobi, Kenya.
Khan, W., & Sattar, A. (2014). Impact of Interest Rate Changes on Profitability of Commercial Banks in Pakistan.
International Journal of Sciences and Research (IJSR), (SSN-414-12), 1– 12.
Kothari, C. R. (2008). Research Methodology: Methods and Techniques. New Age International.
Mahshid, D., & Naji, M. (2003). Managing Interest Rate Risk. International Journal of Business and Social Science, 1–6.
Maigua, C., & Gekara, M. (2016). Influence of Interest Rate Determinants on Performance of Commercial Banks in Kenya. International Journal of Academic Research in Accounting, Finance and Management Sciences,
6 (2), 121–133.
Mange’eli, M. (2012). Relationship Between Interest Rate Spreads and Financial Performace of Commercial Banks in Kenya. University of Nairobi.
Maynard, K. J. (2005). Liquidity Preference Theory Revisited - to Ditch or to Build on it? Ssrn, (427), 1–34. https://doi.org/10.2139/ssrn.782968
Mbai, A. (2006). Relatioship between Interest Rate Risk and Net Interest Income of Commercial Banks Quoted at the NSE. University of Nairobi.
Mmasi S., B. (2013). An investigation of the relationship between interest rate in Kenya. University of Nairobi. Mugenda, M., & Mugenda, G. (2012). Research Methods: Quantitative and Qualitative Approaches.
Mwangi, A. (2014). The effect of interest rates on non-performing loans in commercial banks in kenya. University of Nairobi.
Nation Media Group, B. D. (2016, August). Capping of Interest Rates for Commercial Banks. Nation Media Group, p. 13.
Ndede, F. S., Matete K., J., & Ambrose, J. (2014). Factors Affecting Pricing of Loanable Funds by Commercial Banks in Kenya. International Journal of Business and Social Science, 5(7), 242–257.
Ndung’u, C. (2003). Determiants of Profits for Quoted Commercial Banks in Kenya. University of Nairobi. Ngalawa, J., & Ngare, P. (2014). Interest Rate Risk Management for Commercial Banks in Kenya.
International Journal of Sciences and Research (IJSR), 11–21.
Saunders, A., & Cornett, M. (2003). Financial Insitutions Management: A Risk Management Approach, 513–516. Saunders, A., & Schumacher, L. (2003). Determinants of Bank Interest Rate Margins. International Journal of
Finance, 813–832.
Tobergte, D. R., & Curtis, S. (2013). No Title No Title. Journal of Chemical Information and Modeling, 53(9), 1689–1699. https://doi.org/10.1017/CBO9781107415324.004