Archived version from NCDOCKS Institutional Repository http://libres.uncg.edu/ir/asu/
Condition Of The Cities: A View From The CAFRs
By: Randy Kinnersley, Dwayne McSwain, and Craig D. Shoulders
Abstract
The “Great Recession” created continuing financial challenges for governments, particularly cities. Many cities
faced lower tax bases—including lower property values, lower taxable incomes and lower taxable sales—and
reduced state financial assistance. Some were required to fund various costs previously borne by states. Such
fiscal stress increases risks in governments on several dimensions, including: entering into an ill-advised agreement
that transfers unreasonably large amounts of future revenues from public facilities to another party in exchange
for current payments that relieve current-year budgetary pressures; inappropriate charges of expenditures to
restricted revenue sources—whether from restricted grants or restricted tax revenues; misapplication of
accounting guidance—perhaps to shield resources from expenditure in the current period. Currently, governments
are finding that implementing the Governmental Accounting Standards Board’s (GASB) new statement on fund
balance classification and fund type definitions can require reclassifying large amounts of fund balance from
special revenue funds or general fund reserves into general fund unassigned fund balance, exposing those
amounts to undesirable expenditure pressures.
Kinnersley, R., McSwain, D., & Shoulders, C. (2011). "Condition of the Cities: A View from the CAFRs."
Journal
of Government Financial Management
, Winter 2011. Vol. 60, No. 4. Copyright (2011 & 2019). Association of
Government Accountants. AGA® and the Journal of Government Financial Management® are registered
trademarks. Republished with permission of author(s). All rights reserved. Publisher version of record available
at: https://www.agacgfm.org/Research-Publications/Journal-of-Government-Financial-Management.aspx
The “Great Recession” created con-tinuing financial challenges for gov-ernments, particularly cities. Many cities faced lower tax bases—includ-ing lower property values, lower taxable incomes and lower taxable sales—and reduced state financial assistance. Some were required to fund various costs previously borne by states. Such fiscal stress increases risks in governments on several dimensions, including:
•Entering into an ill-advised agree-ment that transfers unreasonably large amounts of future revenues from public facilities to another party in exchange for current payments that relieve current-year budgetary pressures.
•Inappropriate charges of expen-ditures to restricted revenue sources—whether from restricted grants or restricted tax revenues. •Misapplication of accounting
guid-ance—perhaps to shield resources from expenditure in the current period. Currently, governments are finding that implementing the Governmental Accounting
Condition
of the Cities
A View from the CAFRs
By: Randy Kinnersley, Ph.D., CGFM, CPA, Dwayne McSwain, Ph.D., CPA, and Craig D. Shoulders, Ph.D.Standards Board’s (GASB) new statement on fund balance classi-fication and fund type definitions can require reclassifying large amounts of fund balance from special revenue funds or general fund reserves into general fund unassigned fund balance, expos-ing those amounts to undesirable expenditure pressures.
Governments need processes and controls in place to protect against these and other risks that are height-ened during times of fiscal stress.
The impact of the recession and the subsequent slow recovery on a large group of cities is evaluated using data from their 2007 and 2010 Comprehensive Annual Financial Reports (CAFRs). The effects on the cities and on the states—reported in this Journal in the Summer 2011—are compared.1 Key financial measures are used to gauge the impact of this challenging economic period on these governments. The 2007 CAFRs reflect where the cities (and states) stood before the major financial col-lapse. Most 2010 fiscal years cover the period after the technical end of the recession.
The Measures Used
The same three primary measures used in the prior article on states are used to measure the cities’ financial position. The two fund-based mea-sures are well-accepted traditional measures. The third measure is based on the unrestricted net assets (UNA) from the government-wide statements. The general fund is the focus of the fund-based measures, and only governmental activities are included in the government-wide measure. Unreserved fund balance of the general fund and unrestricted net assets of the governmental activi-ties are available to meet various future financial and service obliga-tions. Taxes and intergovernmental revenues are the key revenue sources in the general fund and governmen-tal activities of most general purpose governments such as cities and states. Specifically, the measures include: •Fund-Based Measures—Available
unreserved general fund fund balance (hereafter available fund balance)2 presented as the number of months of general fund expen-ditures that could be financed by that fund balance; and available
fund balance as a percentage of general fund revenues.
•Government-wide Measure— Governmental activities adjusted unrestricted net assets (UNA) divided by governmental activities total expenses.3
The ratio of UNA to governmental activities expenses provides a mea-sure of UNA relative to the size of the government, facilitating comparisons across cities and states.
Sample Cities
One hundred city CAFRs were included in the study. The cities consist of two groups—large cities and smaller cities. The large cities include 50 of the largest 55 cities in the country,4 which represent 27 dif-ferent states. The lowest population among large cities exceeds 335,000. The smaller cities include one city per state5 with populations ranging from 42,417 to 258,379.6 The smaller cit-ies include the city in each state that had a population nearest 100,0007 and more than 40,000, and was not a sub-urb of one of the large cities.
Fund-Based Tests
Figures 1 and 2 report results in categories based on the Government Finance Officers Association recom-mendation in 2002 that the equivalent of available (general fund) fund bal-ance should be no less than:
•One to two months of operating expenditures (expenditures test) or •Between 5 percent and 15 percent of operating revenues (revenues test) A city with available fund balance of: •Less than one month of its
general fund operating and intergovernmental expenditures (5 percent of revenues) fails the expenditures (or revenues) test. •One to two months of expendi-tures (5 percent to 15 percent of revenues) meets the expenditures (or revenues) test at the minimum level but may not have adequate available fund balance depend-ing on factors such as its size, the predictability of its revenues and the volatility of its expenditures.
Higher levels seem prudent in today’s environment.
•Over two months of expenditures (15 percent of revenues) meets the expenditures (or revenues) test at the highest level.
Figure 1 summarizes the number of months of expenditures in available fund balance. The news is surpris-ingly good for the cities in 2010 given the severity of the economic climate for the three-year period. Forty-seven cities still have more than two months of expenditures in available fund balance, meeting the expenditures test at the highest level. Twenty-nine additional cities report at least one month of expenditures, the minimum recommended level, in available fund balance. Thus, 76 percent of the selected cities met at least the mini-mum expenditures test. By
compari-son, less than one-third of the states met either expenditures test.
Large cities are more likely than small cities to fail even the minimum expenditures test. Twice as many large cities as small cities (16 versus eight) have available fund balance of less than one month of expenditures. The available fund balance as a per-centage of revenues (revenues test) reported in Figure 2 shows a slightly more positive picture with 85 cities meeting at least the minimum rev-enues test. Eight of the 15 cities that do not meet the minimum revenues test are large cities.
The number of cities reporting more favorable expenditures and revenues test results in 2010 has deteriorated from 2007. Twelve fewer cities (includ-ing seven fewer large cities) met the two months of expenditures test. A similar deterioration is seen in the rev-enues test results reported in Figure 2.
FIGURE 1: Available General Fund Fund Balance Divided by Adjusted Expenditures
MONths Of ExPENDiturEs AvAiLABLE
LArgE CitiEs sMALL CitiEs ALL CitiEs ALL stAtEs
2010 2007 2010 2007 2010 2007 2010 2007
Negative 3 1 1 1 4 2 17 4
Less than 1 month 13 10 7 5 20 15 17 13
1 to 2 months 15 13 14 11 29 24 6 18
More than 2 months 19 26 28 33 47 59 10 15
FIGURE 2: Available General Fund Fund Balance Divided by Adjusted Revenues
PErCENtAgE Of rEvENuEs AvAiLABLE
LArgE CitiEs sMALL CitiEs ALL CitiEs ALL stAtEs
2010 2007 2010 2007 2010 2007 2010 2007
Negative 3 1 1 1 4 2 17 4
Less than 5% 5 6 6 3 11 9 12 6
5% to 15% 22 15 13 11 35 26 13 26
More than 15% 20 28 30 35 50 63 8 14
FIGURE 3: Government-Wide Measure: Adjusted Unrestricted Net Assets Divided by Total Expenses for Governmental Activities
uNrEstriCtED NEt AssEts As A PErCENtAgE Of ExPENsEs
LArgE CitiEs sMALL CitiEs ALL CitiEs ALL stAtEs
2010 2007 2010 2007 2010 2007 2010 2007
Less than -10% 23 15 14 9 37 24 15 10
-10% to 0% 4 3 3 4 7 7 17 6
0% to +10% 7 13 9 7 16 20 8 16
Cities appear much better in 2010 than states in these tests. Only four cities (4 percent) have negative 2010 available fund balance compared to 17 states (34 percent). Similarly, 24 cit-ies (24 percent) fail to meet at least one expenditures test whereas 34 states (68 percent) fail to do so. Finally, 47 cities (47 percent) have at least two months of expenditures available in fund balance compared to 10 states (20 percent).
Government-Wide Test
Figure 3 reports the government-wide, governmental activities unrestricted net assets (UNA) as a percentage of governmental activi-ties expenses. This government-wide financial measure is not nearly as favorable for cities as the fund-based measures—perhaps because govern-ments’ internal decision-making is more closely aligned with financial resource limitations and impacts than with economic resources. Forty-four cities have negative UNA in 2010. Thirty-seven of those cities’ negative UNA exceed 10 percent of expenses. Over 40 percent more cities (44 versus 31) reported negative UNA in 2010 than in 2007. Nine of the 13 cities (nearly 70 percent) that moved from positive UNA to negative UNA between 2007 and 2010 are large cit-ies. Still, 40 cities (40 percent) have positive UNA exceeding 10 percent of governmental activities expenses.
While the differences between cities and states using the government-wide measure are less stark than for the fund-based tests, they remain notable. Forty-four cities (44 percent) have negative UNA compare to 32 states (64 percent). The percentage of cities with positive UNA exceeding 10 percent of expenses in 2010 is twice that of the states (40 percent versus 20 percent).
Expenditure Fund-Based Test
and UNA Government-wide
Test—Cities and their State
One potential strategy for a finan-cially distressed city is to seek addi-tional state financial assistance. On the other hand, a financially dis-tressed state may reduce funding to cities to minimize the potential reductions to state agencies or to other local governments dependent on state assistance. Logically, a finan-cially distressed city is less likely to receive substantial help from a finan-cially distressed state than from one in more sound financial condition. Indeed, a financially distressed state may be more likely to reduce funding or transfer costs—previously covered by the state—to the cities, compound-ing problems for distressed cities.
Figures 4 and 5 summarize the expen-ditures test and the government-wide test for cities and states. As might
be expected, it suggests that a city’s financial health may be affected by the condition of its state’s finances.
A review of Figure 4 reveals that it was unusual for cities (only three) to have fund balance equal to less than one month’s expenditures if they were in states with available fund balance equal to a month or more of expenditures. More than 85 percent of cities that had less than a month of expenditures in available fund balance were in states in the same position. Further, all but three of the cities located in states that had avail-able fund balance of a month or more of expenditures also passed at least the minimum expenditures test. In fact, all of the cities in states in which available fund balance exceeded two months of expenditures passed the minimum expenditures test, and more than half of those cities had more than two months of expendi-tures in available fund balance.
Figure 5 highlights that 19 of the cit-ies (19 percent) with the lowest UNA relative to expenses are located in states also in the lowest category of UNA. Significant increases in future state financial relief for these cities seems unlikely, though there can be exceptions. Cities with negative 2010 UNA that are located in states with negative 2010 UNA include eight of the largest 25 cities: New York City,
FIGURE 4: 2010 Expenditures Test—Cities Grouped by State Results
CitiEs
MONths Of ExPENDiturEs
AvAiLABLE iN fuND BALANCE stAtEs Negative Less than 1 Month Months1 to 2 More than 2 Months
Negative 17 3 10 10 20
Less than 1 month 17 1 7 11 13
1 to 2 months 6 0 3 2 7
More than 2 months 10 0 0 6 7
FIGURE 5: 2010 Government-Wide Test—Cities Grouped by State Results
CitiEs
uNrEstriCtED NEt AssEts As
A PErCENtAgE Of ExPENsEs stAtEs Less than -10% -10% to 0% 0% to +10% More than +10%
Less than -10% 15 19 4 3 14
-10% to 0% 17 7 2 5 12
0% to +10% 8 6 1 4 9
Los Angeles, Philadelphia, Chicago, Jacksonville (FL), San Francisco, Detroit and Baltimore.
Other Financial Analyses
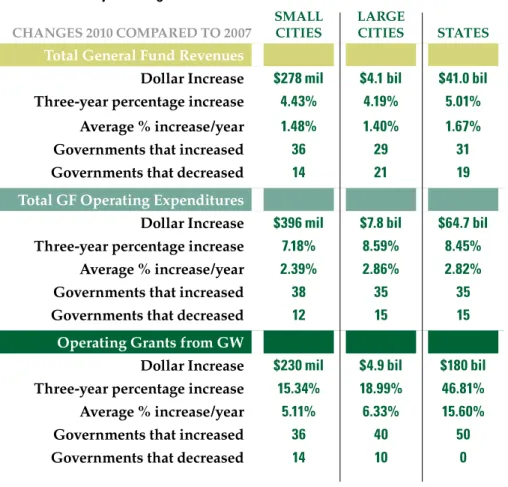
The general fund is the primary operating fund for most cities and is usually a government’s largest gov-ernmental fund. As shown in Figure 6, total general fund revenue for the 50 large cities increased more than $4.1 billion from 2007 to 2010 (4.19 percent over three years for an average of 1.40 percent per year). Total operating expenditures for the large cities dur-ing the same period increased nearly $7.8 billion (8.59 percent for an aver-age increase of 2.86 percent per year).8 The changes for the small cities are similar. Total general fund revenues for the small cities increased by $278 million from 2007 to 2010 (4.43 per-cent three-year increase for an aver-age of 1.48 percent per year). Total operating expenditures for small cities increased by $396 million (7.18 percent over the three years for an average of 2.39 percent per year).
Many governments, including 35 cities and 19 states, experienced declining revenues over the
three-year period. Others had minimal to moderate revenue increases. Over-all, the revenue growth for the time period was not sufficient to keep up with the growth in expenditures. The excess of general fund expen-ditures over revenues for both large cities and small cities is not surpris-ing dursurpris-ing the recessionary period. It is also consistent with the dete-rioration of the financial position of many cities.
The states study reported that operating grant revenues reported in the statement of activities increased dramatically for states during the period—by almost 47 percent or $180 billion. No state had a decrease in this government-wide revenue source. Note in Figure 6 that 24 cities, includ-ing 10 large cities and 14 small cities, had declines in operating grant rev-enues between 2007 and 2010. Simi-larly, while the increase in the states averaged $3.6 billion, the 40 large cities with an increase in operating grant revenue, excluding New York City, had an average increase per city of only
$30 million. The 36 small cities with increases in operating grant revenues averaged an increase of $7.43 million.
Further analysis also showed that nearly half of the cities (28 large cities and 21 small cities) had less than a 20 percent increase in government-wide operating grant revenues, only one state had an increase lower than 20 percent. From an overall standpoint, the dollar increase in operating grants for each of the three groups exceeded the total increase in total governmental activi-ties revenues. For states, it was almost double. While helpful for many cities, clearly this revenue source did not have the same level of positive impact for the cities as for the states.
Conclusion
Cities appear to have weathered the “Great Recession” better than expected and substantially better than state governments. This comparatively better condition was accomplished without the dramatic increase in inter-governmental revenues seen by the states. Indeed, almost a fourth of cities saw declines in this revenue source.
Nonetheless, cities face daunting challenges going forward. In some states, the full effect of declining property values has not yet hit cities because those properties were not reassessed during the study period. The coming reassessments will affect them in the future. Likewise, capital outlay expenditures appar-ently declined in at least 40 percent of the cities. Experience suggests that some likely are deferring main-tenance costs as well.
Intergovernmental revenues are apt to grow more slowly or shrink for more cities as states continue to deal with their own severe and continuing fiscal challenges. All of this points to continuing, and likely increased, chal-lenges for many cities. The majority of cities are in better condition than states, but less than half currently have the preferred level of available fund balance—two months of expendi-tures. Therefore, many cities will need to exercise greater fiscal discipline in the near future to avoid additional ser-vice cuts or financial deterioration.
FIGURE 6: Summary of Changes in Selected Accounts
ChANgEs 2010 COMPArED tO 2007
sMALL CitiEs
LArgE
CitiEs stAtEs
total general fund revenues
Dollar increase $278 mil $4.1 bil $41.0 bil
three-year percentage increase 4.43% 4.19% 5.01%
Average % increase/year 1.48% 1.40% 1.67%
governments that increased 36 29 31
governments that decreased 14 21 19
total gf Operating Expenditures
Dollar increase $396 mil $7.8 bil $64.7 bil
three-year percentage increase 7.18% 8.59% 8.45%
Average % increase/year 2.39% 2.86% 2.82%
governments that increased 38 35 35
governments that decreased 12 15 15
Operating grants from gW
Dollar increase $230 mil $4.9 bil $180 bil
three-year percentage increase 15.34% 18.99% 46.81%
Average % increase/year 5.11% 6.33% 15.60%
governments that increased 36 40 50
Randy Kinnersley, Ph.D., CGFM, CPA, a member AGA’s Nashville Chapter, is an as-sociate professor of accounting at Western Kentucky University. He served as the Nashville Chapter Early Careers Chair for two years.
Dwayne McSwain, Ph.D., CPA, a member of AGA’s Nashville Chapter, is an assistant pro-fessor of account-ing at Appalachian State University in Boone, NC. Craig D. Shoulders, Ph.D., is a professor of accounting and chairman of the Department of Accounting and Information Technology at the University of North Carolina at Pembroke.
The continuing fiscal stress places growing pressure on both cities and states. This scenario makes well-designed and well-implemented con-trols essential. Otherwise, increased budgetary challenges can result in increased risks, such as misuse of restricted resources or financial reporting deficiencies.
End Notes
1. See “State of the States: A View from the CAFRs,” in the Summer 2011 issue of the Journal of Government Financial Management, pp. 26-33.
2. Available General Fund fund balance was calculated as:
a. General Fund unreserved fund balance plus b. General Fund stabilization reserves
(vari-ously labeled in the CAFRs) plus c. Fund balances of stabilization Special
Revenue Funds.
Eight cities had implemented the GASB’s new fund balance classifications in their 2010 CAFRs.
3. Governmental activities adjusted un-restricted net assets is calculated as primary government governmental activities:
a. Unrestricted net assets plus
b. Net assets restricted for stabilization (variously labeled).
4. Washington, DC, the 24th largest city, was not included because it is not part of a state and has unique funding. With this exception, the largest 50 cities whose 2010 CAFRs were available on the internet as of
August 31, 2011 comprised the Large Cities group. Only 4 cities were excluded because their CAFRs were unavailable.
5. The CAFRs for a small city in New Jersey were not available. A second smaller city was selected from the state of New York as a substitute.
6. The 50 Small Cities include: 10 cities under 100,000 population, 26 cities between 100,000 and 150,000, eight cities between 150,000 and 200,000, and six cities over 200,000 in population.
7. With one unavoidable exception, a city was excluded if either its 2007 or 2010 CAFR was not available.
8. The change in operating expenditures is reported in the article. The authors also considered using total expenditures. The percentage changes were similar.