DOES TRANSFORMATION OF MICROFINANCE INSTITUTIONS ACHIEVE DUAL MISSIONS: POVERTY REDUCTION AND FINANCIAL SUSTAINABILITY?
By
KIM, Daehong
THESIS
Submitted to
KDI School of Public Policy and Management in partial fulfillment of the requirements
for the degree of
MASTER OF DEVELOPMENT POLICY
DOES TRANSFORMATION OF MICROFINANCE INSTITUTIONS ACHIEVE DUAL MISSIONS: POVERTY REDUCTION AND FINANCIAL SUSTAINABILITY?
By
KIM, Daehong
THESIS
Submitted to
KDI School of Public Policy and Management in partial fulfillment of the requirements
for the degree of
MASTER OF DEVELOPMENT POLICY
2015
DOES TRANSFORMATION OF MICROFINANCE INSTITUTIONS ACHIEVE DUAL MISSIONS: POVERTY REDUCTION AND FINANCIAL SUSTAINABILITY?
By
KIM, Daehong
THESIS
Submitted to
KDI School of Public Policy and Management in partial fulfillment of the requirements
for the degree of
MASTER OF DEVELOPMENT POLICY
Committee in charge:
Professor Kye Woo LEE, Supervisor Professor Ja Eun SHIN
Professor Jin Soo LEE
ABSTRACT
DOES TRANSFORMATION OF MICROFINANCE INSTITUTIONS ACHIEVE DUAL MISSIONS
: POVERTY REDUCTION AND FINANCIAL SUSTAINABILITY? By
Daehong, KIM
This study aims to assess the impact of institutional transformation of microfinance institutions (MFIs) on poverty alleviation and financial sustainability, using cross-country and panel data sets from the Microfinance Information Exchange (MIX) Market and the World Bank data. The analysis was conducted using pooled OLS with two-stage least squares (2SLS) and random effects regressions. In order to achieve this aim, the analysis was undertaken with respect to two criteria. On one hand, it examines whether the impact of transforming the legal status of MFIs from non-profits to for-profits on poverty alleviation; and on the other hand, from unregulated non-profits to regulated for-profits with regards to the dual missions: poverty reduction and financial sustainability. The results of the analysis suggest that, taking into account endogeneity with loans of MFIs, a country with higher loans from non-profits tends to have larger effects on reducing poverty than that of for-profits. With respect to regulation on MFIs, the net impact of unregulated non-profits on poverty alleviation is still larger than that of regulated for-profits. Especially, only the unregulated for-profits have a significant and positive impact on improving self-sustainability. This evidence implies that since unregulated non-profit MFIs, compared to regulated for-profit MFIs, more effectively reduce poverty with financially stable operation, the institutional transformation of MFIs should be carefully conducted in order to achieve a higher social impact of serving the poorest of the poor at a financially sustainable manner, helping them to overcome poverty.
Keywords: Microfinance Institutions (MFIs), Transformation, Poverty Reduction, Financial Sustainability, Profit Status, Regulation
ACKNOWLEDGEMENT
This paper was supported by The KOICA/WFK Scholarship funded by the Korea International Cooperation Agency (2014-004). I wish to extend my heartfelt gratitude to the following persons who in one way or another have contributed in making this paper possible. First and foremost, I would like to express my deepest appreciation to my thesis advisors, Professor Kye Woo Lee and Professor Ja Eun Shin for their inspiring ideas, keen insight, and constructive comments, all of which have led me to draw meaningful outcome of this study. My special thanks go to Professor Jung Ho Kim (Ajou University), Professor Tae Jong Kim, and staff at Impact Evaluation Lab that gave me opportunities to participate in development research projects, which has equipped me with fundamental research knowledge and skills. I am also greatly thankful to friends at the KDI School and coworkers in Center for International Development at KDI who took their time and effort to review this paper. Moreover, I thank the KDI School Class of 2013 Fall for making my study at the KDI School of Public Policy and Management such a memorable and precious time in my life. Lastly, I am always indebted to my family members who have been the most faithful supporters. Without their love, support and encouragements, completion of master degree would have not been possible.
TABLE OF CONTENTS
LIST OF TABLES ... ii
LIST OF FIGURES ... iii
1. INTRODUCTION ... 1
1.1 Purpose of the Thesis ... 1
1.2 Statement of Problem ... 1
1.3 Importance of Issue ... 4
1.4 Research Questions ... 4
1.5 Organization of the Paper ... 6
2. LITERATURE REVIEW ... 7
2.1 Theoretical Framework of Institutional Transformation of Microfianance Insitutions ... 7
2.2 Studies in Transformation (Commercialization) of Microfinance Institutions ... 10
2.3 Studies in Impact of Microfinance on Poverty Reduction ... 13
3. METHODOLOGY AND DATA ... 15
3.1. Methodology (Model specification) ... 15
3.2. Data Description ... 17
4. RESULTS ... 19
4.1. Trends of Financial Performance of Microfinance Institutions ... 19
4.2. Descriptive Statistics (by region) ... 23
4.3. Regression Results ... 26
5. FURTHER ANALYSIS ON TRANSFORMATION OF MFIs ... 37
6. CONCLUSION AND POLICY RECOMMENDATION ... 45
APPENDICES ... 48
LIST OF TABLES
Table 1. Descriptive Statistics: Non-profits vs. For-profits ... 23 Table 2. Descriptive Statistics by Regions (2002, 2005, 2008, 2010, and 2011) ... 24 Table 3. Pooled OLS Regression Results: Non-profits vs. For-profits
(Dependent Variable: Poverty Headcount Ratio) ... 27 Table 4. Pooled OLS Regression Results: Non-profits vs. For-profits
(Dependent Variable: Poverty Gap) ... 28 Table 5. Pooled OLS Regression Results: Non-profits vs. For-profits
(Dependent Variable: Squared Poverty Gap) ... 29 Table 6. Random Effects Regression Results: Non-profits vs. For-profits
(Dependent Variable: Poverty Headcount Ratio) ... 34 Table 7. Random Effects Regression Results: Non-profits vs. For-profits
(Dependent Variable: Poverty Gap) ... 35 Table 8. Random Effects Regression Results: Non-profits vs. For-profits
(Dependent Variable: Squared Poverty Gap) ... 36 Table 9. Descriptive Statistics: Unregulated non-profits vs. Regulated for-profits ... 38 Table 10. Random Effects Regression Results: Unregulated non-profits vs. Regulated for-profits
(Dependent Variable: Poverty Headcount Ratio) ... 41 Table 11. Random Effects Regression Results: Unregulated non-profits vs. Regulated for-profits
(Dependent Variable: Poverty Gap) ... 42 Table 12. Random Effects Regression Results: Unregulated non-profits vs. Regulated for-profits
(Dependent Variable: Squared Poverty Gap) ... 43 Table 13. Fixed and Random Effects Regression Results: Unregulated non-profits vs. Regulated for-profits
LIST OF FIGURES
Figure 1. The Outreach and Impact of Institutional Transformation on Poverty Line ... 9
Figure 2. Trends of Gross Loan Portfolio – Size of MFIs ... 19
Figure 3. Trends of Number of Active Borrowers - Breadth of Outreach ... 20
1. INTRODUCTION
1.1 Purpose of the Thesis
The primary purpose of this study is to assess and compare the impact of non-profit and for-profit microfinance institutions (MFIs) on poverty reduction and financial sustainability. In particular, this assessment examines which type of institutional nature for MFIs is more effective in delivering financial services to the poor in order to fight poverty.
1.2 Statement of Problem
There has been heated debate on the institutional nature of MFIs in recent years: should MFIs focus mainly on poverty alleviation or be making profit? This debate reflects the question on what should be the priority of MFIs: poverty reduction or financial sustainability.
In the early 1980s, Muhammad Yunus founded the Grameen Bank, the first organized microfinance institution (MFI) and a non-profit entity to provide financial services to low income households that had been conventionally excluded from the formal banking system. Over the past few decades, microfinance markets have grown and have been considered as a crucial instrument for poor entrepreneurs to start and expand their businesses, helping them to generate income, and overcoming poverty. Under such conditions, the United Nations (UN) declared 2005 as the International Year of Microfinance, and in the following year 2006, the Grameen Bank was awarded the Nobel Peace Prize for their efforts in providing microcredit as means of fighting poverty (Grameen Bank, 2014).
However, as microfinance has developed to meet varying demands (e.g. insurance and savings) from clients and investors, it has been challenged for following reasons: (1) providing loans to the low-income clients would cause high operating costs (to reach the poor
clients in rural area); (2) low rate of return on loan (or high loan default rate); and (3) higher dependency on donor’s subsidies, which is closely related to financial self-sufficiency in operating MFIs. According to the Microfinance Information Exchange (MIX) Market database, financial self-sufficiency (in the microfinance context) refers to when “an institution has enough revenue to pay for all administrative costs, loan losses, potential losses and funds”. Indeed, Mersland and Strøm (2010) indicated that “around 41% of MFIs are not financially self-sustainable according to a survey by the Micro Banking Bulletin on the basis of the MIX 2006 benchmark data set of 704 MFIs”. MFIs have been under pressure to change their operating strategies and draw more attention to transformation into for-profits (from non-profits) to be financially self-sustainable and viable (Wagenaar, 2012). According to the MIX Market in 2009, the number of the for-profit MFIs was 490 out of the 1,161 MFIs (roughly 42%), and make up two-thirds of total assets (more than $65 billion worth) (Roberts, 2013). In this respect, some scholars have argued that profit-oriented MFIs would perform better than non-profits in achieving their social and financial missions—poverty reduction and financial self-sustainability—since the institutional transformation of MFIs can bring more deposits, independence from donors, better management, and finally better financial services to the clients (Mersland and Strøm, 2010)
Moreover, in some cases, regulations on MFIs have also been regarded as a countermeasure to preserve financial viability for MFIs. The main objective of imposing regulations in the microfinance sector is to operate safe and sound MFIs by addressing market failures, information asymmetries between depositors, financial intermediaries, and borrowers. For instance, depositors are often exposed to the threat of acerbating the security of their deposits since financial institutions utilize and invest the deposits in risky profit-making business unexplained to the depositors (Yu et al., 2014). Also, in the same manner, it can be observed in lending and deposit tasks that financial institutions hardly identify the
creditworthy clients due to the fact that only the clients know their own capacity and willingness to repay. In this regard, MFIs are more vulnerable to the clients mostly consisting of entrepreneurial poor who may not fulfill their obligations to repay. To avoid such systemic risks, regulatory measures of MFIs should not only monitor MFIs’ activities to improve the safety of depositors, but also remove the risk of having potential defaulters when running MFIs (Ledgewood et al, 2013). The most representative regulation on MFIs is capital adequacy ratio1 measuring whether MFIs have “a sufficient level of capital required to
absorb potential losses while providing financial sustainability” (Ledgerwood, 1998, p.224). This could be a safeguard to sustain the viability of MFIs.
Hence, to secure financial sustainability for MFIs, the transformation into for-profit MFIs or regulation of MFIs seems necessary. Examples of this transformation can be found that El Salvador MFI known as Financiera CALPIA successfully transformed from an NGO into a small, strictly targeted group-oriented formal bank. The bank achieved high return on equity measuring profitability and its institutional stability, and now it has gained attention as a credit worthy institution in the country (Ledgerwood, 1998). Besides, Bolivia MFI, Banco Sol transforming its legal status from a community-based lending program to a for-profit commercial bank has successfully made financial performance by lending loans to around 100,000 borrowers, and approximately 99.5% of them has been repaid (Gonzalez-vega et al. 1997).
The assertions in favor with institutional transformation of MFIs however, are criticized for that if the transformation process proceeds in microfinance industry, the transformed MFIs would target better-off clients in order to achieve the commercial and financial objectives: profitability and financial sustainability, and loss of the original social
mission of lending loans to the low socio-economic class of the society as well as to reduce poverty. This is commonly referred to as ‘mission drift’ (Mersland and Strøm, 2010) in microfinance industry that MFIs shift their main focus from serving the impoverished to fight poverty to making profit as well as achieving financial self-sufficiency.
1.3 Importance of Issue
Even though the practice of ‘mission drift’is the source of heated debate in the field of microfinance, there has been no empirical study evaluating the impact of different nature of microfinance institutions—non-profits and for-profits on the one hand; and unregulated non-profits and regulated for-profits on the other—with regards to the dual missions of poverty reduction and financial sustainability. This study aims to fill such gap and determine which legal status of microfinance institutions (MFIs) has made the most contributions on poverty alleviation by reaching the poor households as well as financial sufficiency.
Such study is necessary and important when effective strategies and plans of MFIs need to be devised for both poverty reduction and financial sustainability by NGOs, government financial agencies, and international development organizations.
1.4 Research Questions
This paper attempts to investigate whether transformation of MFIs achieve the goals of fighting poverty worldwide and financial self-sustainability. First, it tests whether for-profit MFIs reduce poverty more significantly than non-for-profit MFIs do (i.e. for-for-profits target the poorer clients than non-profits). Second, taking into account of regulatory requirement on MFIs, it tests whether a regulated for-profit MFI has a more significant impact on alleviation
of poverty and financial sustainability than an unregulated non-profit MFI. Specific questions are as follows:
1.4.1 Non-profit MFIs vs. For-profit MFIs
Social Mission: Poverty Reduction A. Do non-profit MFIs reduce poverty? B. Do for-profit MFIs reduce poverty?
C. Are for-profits more effective in reducing poverty than non-profits?
1.4.2 Unregulated non-profit MFIs vs. Regulated for-profit MFIs
Dual Missions: Poverty Reduction and Financial Sustainability 1.4.2.1 Poverty reduction
A. Do unregulated non-profit MFIs reduce poverty? B. Do regulated for-profit MFIs reduce poverty?
C. Are regulated for-profits more effective in reducing poverty than unregulated non-profits? 1.4.2.2 Financial sustainability
A. Do unregulated non-profit MFIs achieve financial sustainability? B. Do regulated for-profit MFIs achieve financial sustainability?
1.5 Organization of the Paper
The rest of this paper is organized as follows: The second section reviews various literature in the related area. The third section describes estimation methodology and data used in this study. The fourth section discusses the analysis results of the impact of for-profit MFIs on poverty reduction in comparison with non-profit MFIs. The following section reports on further analysis of the results using profit status and regulation of MFIs. Finally, the conclusion and recommendations are presented in the last section.
2. LITERATURE REVIEW
Most studies on microfinance have focused on estimating social welfare of borrowers such as income, health, education and women empowerment in a particular MFI or region at the micro-level. Some studies have discussed social and financial performance of the transformed MFIs since the trend of the institutional transformation of MFIs has emerged in recent years. With this regards, literature review is divided into three parts: first part is on theoretical framework of institutional transformation of MFIs; second, studies of transformation (commercialization) of MFIs; the final part discusses the studies of poverty reduction in microfinance sector.
2.1 Theoretical Framework of Institutional Transformation of Microfinance Institutions
The concept of the institutional transformation of MFIs has not been generalized yet in related studies. Broadly, it implies “a change in legal status from an unregulated non-profit or non-governmental organization (NGO) into a regulated for-profit institution with enhanced service quality and product offering.”2 This could also be referred to as a process of
transformation from informal to formal MFIs (Srnec et al, 2008). The related literature often uses the term ‘transformation’ and ‘commercialization’ interchangeably. According to the MIX Market data, the term ‘commercialization’ refers to “the move by MFIs to provide services on a financially self-sufficient basis and under prevailing commercial principle and regulation.” Christine (2001), one of the first scholars studying the commercialization in microfinance sector, defines commercialization as consisting of three main features: regulation, competition, and profitability. In this study, the term ‘transformation’ is mainly
2 Srnec, Divisová, and Svobodivá , “The Transformation Process in Microfinance institutions,” Agricultura Tropica et
Subtropica, May 12, 2008. Quoted in UNITUS, “Acceleration model,” Accessed November, 23, 2007, http://www.unitus.com/sections/aboutus/aboutus/_os_goals.asp
used for clarity since it could more clearly reflect on the status change of institutional structure in MFIs.
The assessment of institutional transformation of a MFI on its performance is originally derived from the debate between the welfarist and the institutionalist, referred to as the Microfinance Schism (Morduch, 2000). According to the welfarist, since reaching the poorest of the poor with the view of reducing poverty materially and non-materially is the key objective of the MFIs in spite of the subsidy dependency, the assessment on MFIs should be measured by borrowers’ welfare. On the other hand, the institutionalist insist that the performance of MFIs should be assessed by the expansion of financial services to low income class and operate MFIs at a financially self-sustainable base (Bhatt & Tang, 2001).
Theoretically, the debate is closely linked to the trade-off between depth of outreach and financial sustainability. The term ‘outreach’ as a financial indicator of MFIs is divided into two dimensional approaches: breadth and depth of outreach. While breadth of outreach measures how many borrowers are being served, depth of outreach measures how poor are the borrowers or who is actually being served (Rosenberg, 2009). The major proxy for breadth of outreach is number of active borrowers. For depth of outreach, average loan size is mainly used based on the assumption that the smaller loan size, the deeper outreach or the poorer the borrowers because smaller loan would be lent to poorer clients. Also, the percentage of female borrowers often measures depth of outreach since they are often regarded as relatively poorer than male borrowers (Olivarse-Polanco, 2005).
Thus, not-transformed MFIs would provide smaller loans to worse-off clients and target more female clients (deeper outreach), while transformed MFIs would lend larger loans to better-off clients and the larger number of borrowers (shallower and broader outreach) in order to operate MFIs for financial sustainability. In other words, the original purpose of
microfinance—serving the poorest of the poor so that they overcome poverty—would be abandoned or become tainted towards serving the non-poor clients to achieve better financial performances in terms of operational efficiency, profitability, productivity, and especially sustainability. It seems that the dual missions of serving the destitute and achieving financial sustainability cannot coexist, and the trade-offs are necessarily followed.
Figure 1. The Outreach and Impact of Institutional Transformation on Poverty Line3
Source: Microfinancegateway (2006)
Figure 1 shows how the transformation process of MFIs switch the main target clients from the poor households (deeper outreach) to the non-poor including less poor clients (broader outreach). This analytical framework on transformation should be confirmed and proven by empirical studies. Thus, following sections explore the empirical literature of the transformation as well as poverty reduction in microfinance sector.
3 Srnec, Divisová, and Svobodivá , “The Transformation Process in Microfinance institutions,” Agricultura Tropica et Subtropica, May 12, 2008. Quoted in Microfinancegateway, “Helping to improve Donor Effectiveness in Microfinance,” Accessed April, 23, 2006, http://www.microfinancegateway.org
2.2 Studies in Transformation (Commercialization) of Microfinance Institutions 2.2.1 Profit Status of Microfinance Institutions
A few empirical studies that used the profit status for transformation of MFIs identified the relationship between profit status of MFIs and performance indicators (outreach and financial sustainability). Roberts (2012) observed whether or not for-profit MFIs charge higher interest rate than non-profit MFIs by conducting OLS (Ordinary Least Squares) based on 258 MFIs for 2009 from MIX Market database and Social Performance Reports. A dummy variable was used for the legal profit status of MFIs. It was revealed that even if for-profit MFIs put higher interest rate on MFI clients, it does not necessary lead to for-profitability and thus financial sustainability since the stronger profit-orientation is highly correlated with higher cost in MFIs. The author thus concluded that transformation should be more focused on reducing operating costs to achieve financial self-sufficiency.
Wagenaar (2012) focused more on mission drift using average loan size and a percent of female borrowers as proxies for depth of outreach. The author employed panel data estimation using 1,558 MFIs over 15 years to capture causal relationship between profit status and charter type of MFIs and depth of outreach indicators. Especially, it was specified for the category of MFIs’ profit status: first, MFIs that do not transform; and secondly among transformed MFIs, remaining non-profit as well as becoming for-profit. The charter type was classified into five: NGOs, Banks, Credit Union/Cooperatives, NBFIs (non-banking financial institutions), and others. The results showed that average loan size of transformed for-profit MFIs is significantly larger than that of non-profits, and the for-profit MFIs have a lower proportion of female borrowers. This suggests that outreach of for-profits is shallower than that of non-profits. In case of the charter type, most for-profit MFIs, Banks and NBFIs have higher average loan size and a lower fraction of female borrowers than those of NGOs. These results confirm that mission drift does indeed occur in microfinance sector.
Downey and Conroy (2014) simply compared the mean value of several financial performance indicators such as a percentage of female borrowers, average loan size, profit margin, expenses, operational self-sufficiency, interest rates, and a proportion of risky loans between non-profits and for-profits. The division of the profit status for MFIs was based on funding source—whether or not MFIs are funded by shareholder’s capital. The data of 460 MFIs was from MIX Market. They found evidence that there is significant difference in profit margin, operational self-sufficiency, and expenses between the two different profit statuses of MFIs. Interestingly, the better performance in terms of financial profitability was captured in non-profit MFIs. No evidence was found on the significant difference in outreach measures (a percentage of female borrowers and average loan size). The implication is that non-profit MFIs have higher financial performances (profit margins and operational self-sufficiency)with equal outreach measures.
2.2.2. Regulation and NGOs of Microfinance Institutions
Regulatory status and type of MFIs (NGOs) for the transformation process has been dealt with in recent literature. Olivarse-Polanco (2005) investigated the causal relationship between the institutional type of MFIs and average loan size (depth of outreach). Unregulated NGOs and regulated financial institutions were used as a dummy variable for the type of MFIs. To closely observe the movement of outreach, three measures of loan size were applied in the study: average outstanding loan / GDP per capita; dollar-years of resources from loan / dollar years of resources from income to adjust for time; and average outstanding loan / GDP per capita of the poorest 20% to adjust for inequality of income distribution in a county. The data sets were utilized of 30 Latin America MFIs over 1999 to 2001 from MIX Market data, conducting OLS (Ordinary Least Square). The paper indicates that there is no significant link between the type of MFIs and all three loan measures.
A study by Hartarska and Nadolnyak (2011) using data for 114 MFIs from 62 countries examined the impact of regulation on MFI’s performances, operational self-sufficiency (financial revenue / financial expense + loan Loss Provision + operating expense) and breadth of outreach (number of active borrowers). A dummy variable was taken for regulatory involvement and type of MFIs (NGOs). The researchers revealed that regulated MFIs and NGO MFIs do not show better financial performances in terms of operating MFIs and reaching the larger number of poor clients.
Unlike other studies that used a dummy variable of whether or not MFIs are regulated, Yu, Damji, Vora, and Anand (2014) utilized capital adequacy ratio4 as a proxy for
regulation requirement on MFIs, applying OLS (Ordinary least square), Difference-in- Difference, and IV (Instrumental Variable). They tested first the causal links between regulation on MFIs (capital adequacy ratio) and profitability (return on assets, yields on gross loan portfolio, and write-off ratio), and secondly outreach (a percentage of female borrowers) and profitability (return on assets). The data sets were 2,409 MFIs over the period of 1995 - 2012 and were gathered from MIX Market and World Bank database. The results show that regulation requirement on MFIs increases profitability for MFIs’ operation and decrease the outreach to female borrowers who are relatively poorer clients. Not only that, the more female borrower are served, the less profit the MFIs have. Hence, they concluded that there is trade-off between serving the poor clients and achieving better financial performance (profitability).
Evidence gathered by Abrar and Javaid (2014) also confirmed the trade-off between outreach and financial sustainability. The author employed 382 MFIs in 70 countries for 2003 to 2009 conducing random effects estimation. It was examined the causal relationship between outreach (average loan size) and financial characteristics (operational
sufficiency, repayment risk, reciprocal of productivity). Both the regulatory involvement and legal status (NGO) of MFIs were taken as dummy variables. The results show that average loan size is positively and significantly correlated with those various financial variables leading to transformation (or commercialization). It implies that as MFIs lend larger loans to (better-off) borrowers, MFIs become more financially self-sustainable. Conversely, MFIs lend smaller loans to (worse-off) clients, MFIs get the lower level of financial performance. In particular, regulation on MFIs do strongly effect on increasing average loan size, meaning that regulated MFIs target the better-off households. Thus, the authors concluded that regulation on MFIs results in trade-off between outreach and financial performance.
From the literature above, the three things are clearly identified. First, studies of transformation utilized diverse methodologies and data sets to observe the institutional transformation of MFIs. Second, some studies tried to identify the effect of transformed MFIs on either financial performance measuring profitability and financial self-sufficiency or outreach measures such as average loan size and a proportion of female clients, while other literature utilized both financial sustainability and outreach measures. Third, mixed results were reported and thus the controversy over mission drift of MFIs has been still unresolved and remains in question with the recent growth of microfinance industry.
2.3 Studies in Impact of Microfinance on Poverty Reduction
Most of the studies on microfinance are based upon the micro-level data. Much less empirical studies of poverty reduction have been carried out to examine whether or not the success of microfinance is dependent on the macroeconomic structure using cross-country and macroeconomic variables due to reliability of macro data. Yet, several studies found a significant relationship between financial services to the marginal clients (gross loan
portfolio5) of MFIs and poverty measures (FGT indices6). Imai, Giha, Thapa and Annim
(2010, 2012) used data sets from 2003 and 2007 covering 61 countries by applying Pooled OLS (Ordinary Least Squares) with an IV (Instrumental Variable), and Random effects regression models to check the causal relationship between financial services of MFIs (gross loan portfolio) and poverty (FGT indices). The results indicate that gross loan portfolio is significantly and negatively associated with poverty measures (poverty headcount ratio, poverty gap, and poverty squared gap), which means a rise in financial services to the low income households (gross loan portfolio) has a significant impact on poverty reduction. Kwak and Lee (2013) also utilized Pooled OLS and IV models by using 78 countries through the six regions of the world for 2010. They found out that a country with higher gross loan portfolio from MFIs have a significant impact on poverty reduction.
5 The outstanding principal balance of all of an MFI’s outstanding loans, including current, delinquent, and restructured
loans, but loans that have been written off. (Consultative Group to Assist the Poor (CGAP), 2003, p.6)
6 Foster-Greer-Thorbecke consists of three poverty measures: (i) poverty headcount ratio: the proportion of the population
that is poor, (ii) poverty gap: the extent to which individuals fall below the poverty line, (iii) squared poverty gap: the squares of the poverty gaps relative to poverty line (Poverty Manual, All, JH, 2005, p.69-74)
3. METHODOLOGY AND DATA
3.1. Methodology (Model specification)
The analysis in this study adopts methods used by Imai, Giha, Thapa and Annim (2010, 2012) and Das and Khan (2011). The data sets are from 68 countries MFIs from around the world for 2002, 2005, 2008, 2010, and 2011. Pooled OLS (Ordinary Least Squares) with an Instrumental Variable (IV) and Random effects regressions are applied to estimate the impact of microfinance on poverty reduction on the basis of MFIs’ profit status. The empirical models in this study are of the following forms:
𝑃𝑜𝑣 𝛽 𝛽 𝒏𝑮𝑳𝑷 𝛽 𝐺𝐷𝑃𝑝𝑐 𝛽 𝐷𝑜𝑚𝑐 𝛽 𝑅𝐸𝐺 𝜀 1
𝒏𝑮𝑳𝑷 𝛿 𝛿 𝒏𝑶𝑬𝑹 𝜃 2 where, in the equation (1), Pov represents FGT (Foster-Greer-Thorbecke) indices: (i) poverty headcount ratio, (ii) poverty gap, and (iii) squared poverty gap; nGLP is (i) log of gross loan portfolio and (ii) log of gross loan portfolio per borrower in non-profit MFIs. GDPpc indicates log of GDP per capita (at 2005 constant USD); Domc is domestic credit provided by
financial sector as a share of GDP; REG is the regional dummies (EAP, ECA, MENA SA,
and SSA); the number of countries and time observation denote i=1,ꞏꞏꞏ, N, and t=1,ꞏꞏꞏ,T, respectively; ε and 𝜃 are error terms. The equation (2) tests potential endogeneity of gross loan portfolio and validity of an instrument in MFIs. nOER is operating expense ratio (operating expense/average gross loan portfolio) of non-profit MFIs.
𝑃𝑜𝑣 𝛽 𝛽 𝒑𝑮𝑳𝑷 𝛽 𝐺𝐷𝑃𝑝𝑐 𝛽 𝐷𝑜𝑚𝑐 𝛽 𝑅𝐸𝐺 𝜀 3
𝒑𝑮𝑳𝑷 𝛿 𝛿 𝒑𝑶𝑬𝑹 𝜃 4 nGLP and nOER are replaced by pGLP and pOER in the equation (3) and (4) to observe the impact of for-profit MFIs on poverty reduction.
𝑃𝑜𝑣 𝛽 𝛽 𝒂𝑮𝑳𝑷 𝛽 𝐺𝐷𝑃𝑝𝑐 𝛽 𝐷𝑜𝑚𝑐 𝛽 𝑅𝐸𝐺 𝜀 5 Lastly, equation (5) examines the aggregate effect of MFIs on poverty alleviation by using aggregate gross loan portfolio of MFIs 𝒂𝑮𝑳𝑷 as a substitute for nGLP or pGLP.
Since the main aim of microfinance institutions (MFIs) is to provide financial services to the poor households for overcoming poverty reduction, the study on performance assessment of MFIs should be approached from the welfarist’s perspective centered on reducing poverty (Morduch, 2000). The recent empirical studies on microfinance used average loan size as a major proxy to measure the poverty level of individual clients (depth of outreach). However, Ledgerwood (1999) raises concern that the use of average loan size may lead to biased results because it may not reflect the level of borrowers’ welfare (the level of poverty). In this sense, this study attempts to directly measure poverty reduction with FGT indices (poverty headcount ratio, poverty gap, and poverty squared gap) instead of using average loan size. The average loan size (gross loan portfolio) is utilized as a proxy for financial support from MFIs to the marginal clients. Moreover, aggregate average loan size of MFIs is used to capture the total (volume/size) impact of MFIs on poverty eradication.
Furthermore, the previous studies with regards to poverty reduction did not consider for the institutional transformation of MFIs. Hence, the institutional nature of MFI is applied in the analysis based on the two criteria. On the one hand, it examines whether the impact of transforming the legal status of MFIs from non-profits to for-profits first on poverty alleviation in the next section; and on the other hand, from unregulated non-profits to regulated for-profits with regards to the dual missions of MFIs: poverty reduction and financial sustainability in the fifth section. More specific description on data sets is followed below.
3.2. Data Description
3.2.1.1 Dependent variables
Povcal Net in World Bank reports FGT7(Foster-Greer-Thorbecke) indices: poverty
headcount ratio, poverty gap, and squared poverty gap index over every 38 years from 1981
on the basis of 2005 PPP (Purchasing Power Parity) and USD 1.25/day poverty line. To address the limitation occurred at macro-level studies that cannot capture the activities of the poorest of the poor (Morduch, 1999), this study examines headcount ratio (absolute poverty), poverty gap (depth of poverty), and squared poverty gap (severity of poverty) measuring the different level of poverty (Imai et al., 2012).
3.2.2 Independent variables
With the object of measuring microfinance activities, gross loan portfolio (GLP) (divided by the number of active borrowers: average loan balance per borrower) is mainly used in this study, implying that it measures actual funds disbursed to clients of MFIs. The GLP is adjusted for inflation (at 2005 constant USD) standardizing macro-level data sets for comparison. Based on Microfinance Information Exchange (MIX) Market data reporting the profit status of MFIs, the GLP are generated into two: each GLP of non-profit MFIs and for-profit MFIs. In the equation (1), GDP per capita and domestic credit as share of GDP are also included as a measure of economic growth and financial development given that those variables play a role of reducing poverty. Lastly, regional dummies are utilized to control unobservable regional characteristics (Imai et al., 2012). These data sets are derived from Microfinance Information Exchange (MIX) and World Bank Indicator (WDI).
7 Povcal Net in World Bank reports FGT indices [Headcount Ratio (%), Poverty Gap (%), and Squared Poverty Gap(%)] 8 FGT indices of 2010 are available in the world bank web site (http://iresearch.worldbank.org/PovcalNet/index.htm?1,0)
3.2.3 Instrumental Variable
In the equation (1) and (3), IV (also known as 2SLS) is needed to address the issue of reverse causality. For instance, an increase in gross loan portfolio would improve the poverty level in a country. Conversely, the improvement of poverty in a county would reduce gross loan portfolio due to the fact that people overcoming poverty do not need to borrow loans from MFIs (Kwak and Lee, 2013). Thus, gross loan portfolio is likely to be endogenous in the equation (1) and (3), so that this study uses an instrument, operating expense ratio (operating expense/average gross loan portfolio) which is mainly used to measure operating efficiency when comparing MFIs (Consultative Group to Assist the Poor (CGAP), 2003). This ratio would be negatively related to gross loan portfolio in that an increase in operating expense for MFIs may decrease loans lending to clients. To serve as a valid instrument, the variable must be correlated with the endogenous variable, gross loan portfolio, and at the same time, not be correlated with FGT indices (headcount ratio, poverty gap, and squared poverty gap). In this regard, the validity tests of the IV are conducted and presented in Tables 3 to 5 (Wooldridge, 2010, p.513-540)
4. RESULTS
Through the comparison of performance indicators between non-profit and for-profit MFIs, it can be clarified how the activities of the two different types of MFIs have proceeded in recent years. With this in mind, first the recent trends in financial performance of MFIs are visited on the basis of the profit status over the regions. The next is followed by multivariate regression results from Tables 3 to 8, including descriptive statistics (by regions) in Tables 1 and 2.
4.1 Trends of Financial Performance of Microfinance Institutions
Trends of the important components related to size and outreach to clients in MFIs such as gross loan portfolio, number of active borrowers, and percent of female borrowers are described from Figures 1 to 3 below, showing how these factors of non-profits and for-profits change over the recent years.
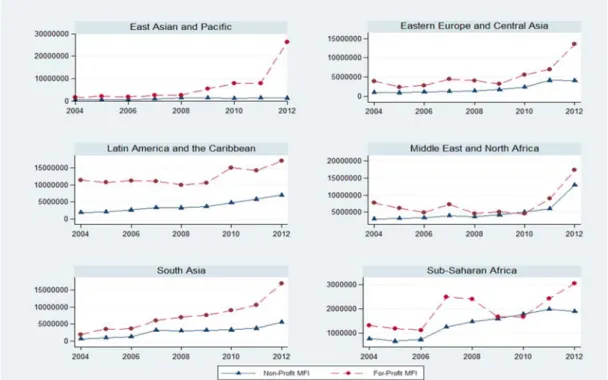
Figure 2. Trends of Gross Loan Portfolio – Size of MFIs
As depicted in Figure 1, in general, gross loan portfolio (GLP) increased over all the six regions from 2004 to 2012 regardless of the profit status in MFIs. This confirms that microfinance markets had grown during the period. Specifically, the for-profits lent larger loans than the non-profits over the last several years except the year 2010 in the Middle East and North Africa (MENA) and Sub-Saharan Africa (SSA). This indicates that, in general, the size of for-profit MFIs was larger than that of non-profit ones. Also, the slope in the for-profit MFIs between 2011 and 2012 had dramatically risen for the regions, meaning that the size of for-profit MFIs had significantly expanded. In this regard, this could imply the active movement of for-profit MFIs to expand the business in the microfinance sector during the period.
Figure 3. Trends of Number of Active Borrowers - Breadth of Outreach
Source: self-compilation from MIX Market data
Number of active borrowers indicates that “the number of individuals who currently have an outstanding loan balance with the MFI or are responsible for repaying any portion of the gross loan portfolio” (Consultative Group to Assist the Poor (CGAP), 2003), basically
measuring the scale (or breadth) of outreach. Unlike the trends of gross loan portfolio above, the Figure 2 shows the mixed results by regions. First of all, for-profit MFIs in the two regions, SA and LAC reached more active borrowers from 2004 to 2012. An interpretation of this is that the better-off clients would have been targeted more in SA and LAC since the profit-oriented MFIs may access the better-off clients to increase profitability through more stable and higher rate of returns on loans. As described in Figure 1, regarding 2011 and 2012, an increase in the number of borrowers was more significant for the for-profit MFIs over the regions except the MENA, and therefore this could confirm the increasing the extent to movement of the profit-oriented MFIs in this sector.
Figure 4. Trends of Percent of Female Active Borrowers - Depth of Outreach (Gender)
Source: self-compilation from MIX Market data
As explained above, since female borrowers in general are regarded as relatively poorer than male ones, the number of female clients in MFIs could be a good proxy for measuring depth of outreach. In Figure 4, non-profit MFIs overall reached more female
borrowers except SA. In case of LAC, more female borrowers were reached by for-profit MFIs only in 2012. As confirmed by findings of microfinance literature (Dacheva and Gotwalt, 2007; Wagenaar 2012;Yu et al., 2014), this can be interpreted that non-profit MFIs reach more female borrowers as well as marginalized clients in the society (deeper outreach).
Overall, gross loan portfolio rose in both non-profits and for-profits from all over the world, and especially the gap of slope in gross loan portfolio between non-profits and for-profits had been wider by the two regions, LAC and SA than by the other regions in 2011 and 2012. This implies that the size of MFIs increased over the period 2004 -2012, and the size of for-profit MFIs was much larger than that of non-profits especially in LAC and SA over the period 2011-2012. Secondly, except MENA, the number of active borrowers in for-profit MFIs was bigger than that of non-profit MFIs in 2012. Also, for-profit MFIs in LAC and SA had continuously reached more borrowers than non-profit from 2004 to 2012. This indicates that broader outreach of the for-profits was observed over all the regions in 2012 and in LAC and SA over 2004 to 2012. Lastly, the proportion of female borrowers to total number of active borrowers was larger in non-profits than for-profits over the world with the exception of LAC and SA during the period 2004 to 2012. As expected, deeper outreach was observed in non-profit MFIs. Thus, in general, it can be concluded that the growing active movement in for-profit MFIs for recent years 2004 to 2012 in the world based on the trends results: larger size of MFIs and broader outreach that may accompany with shallower outreach. In particular, the activities of for-profit MFIs were more intense in these two regions, LAC and SA.
4.2 Descriptive Statistics (by region)
Table 1 presents descriptive statistics of the data, comprising mean, standard deviation, minimum, and maximum of the observations used in this study. Table 2 shows descriptive statistics by regions and profit status of MFIs that can simply compare the level of poverty and capture activities of MFIs over the world in the data sets.
Table 1. Descriptive Statistics: Non-profits vs. For-profits
Variable Obs. Mean Std. Dev. Min Max
Poverty headcount ratio 328 25.54 25.41 0.01 87.83
Poverty gap 320 11.06 14.42 0.01 90.50
Squared poverty gap 312 5.82 8.31 0.01 57.34
Log of GLP
(Non-profits) 325 14.45 1.43 7.45 17.83
Log of GLP per borrower
(Non-profit) 324 6.15 1.25 0.96 9.58
Operating expense ratio
(Non-profit) 308 0.37 0.39 0.05 3.35
Log of GLP
(For-profit) 312 15.84 1.99 9.97 20.66
Log of GLP per borrower
(For-profit) 283 6.81 1.64 2.88 13.02
Operating expense ratio
(For-profit) 285 0.30 0.25 0.02 1.60
Log of GLP
(Aggregate) 335 16.35 1.93 9.78 21.06
Log of GLP per borrower
(Aggregate) 335 6.60 1.46 2.84 12.86
Log of GDP per capita 340 7.11 1.06 4.96 9.11
Table 2. Descriptive Statistics by Regions (2002, 2005, 2008, 2010, and 2011) Regions Poverty headcount (%) Poverty gap (%) Squared poverty gap (%) Gross loan
per borrower ($) No. of MFIs No. of active borrowers Domestic credit
Gross domestic product per
capita Non-profit For-profit Non-profit For-profit Non-profit For-profit
EAP Total No. 25 25 25 20 16 21 20 21 19 25 25 No. of Countries 5 5 5 5 5 5 5 5 5 5 5 Mean. 22.31 5.36 1.84 311.85 4069.78 12.43 15.05 11514.52 13303.3 45.20 1229.42 Std. Dev. 9.00 2.90 1.33 196.53 10242.81 12.87 11.02 11728.56 16304.8 52.76 737.38 ECA Total No. 61 54 48 66 62 68 69 67 68 70 70 No. of Countries 14 14 14 14 14 14 14 14 14 14 14 Mean. 4.28 1.34 0.65 2269.12 13534.83 6.94 6.67 5638.64 9767.3 35.60 2953.098 Std. Dev. 7.62 2.26 2.26 2694.26 57090.40 10.97 5.79 7604.31 11075.9 22.11 1674.41 LAC Total No. 82 82 82 82 69 82 79 82 77 85 85 No. of Countries 17 17 17 17 15 17 17 17 17 17 17 Mean. 10.12 4.45 2.77 917.39 2021.92 12.50 7.25 8130.99 39411.7 48.42 3717.88 Std. Dev. 13.02 6.70 4.41 792.49 2154.17 11.23 10.31 7671.52 69016.5 24.08 2353.06 MENA Total No. 20 19 17 19 14 20 17 20 16 20 20 No. of Countries 4 4 4 4 4 4 4 4 4 4 4 Mean. 2.68 0.55 0.22 756.98 5790.07 5.90 1.53 13630.35 8514.5 53.14 1703.61 Std. Dev. 3.37 0.66 0.23 633.05 7387.24 2.53 0.51 17544.80 8030.5 46.24 729.50 SA Total No. 25 25 25 25 24 25 25 25 25 25 25 No. of Countries 5 5 5 5 5 5 5 5 5 5 5 Mean. 29.43 7.43 2.64 212.34 201.75 24.20 15.08 22423.00 1092103.0 52.30 780.48 Std. Dev. 16.37 5.40 2.26 164.21 87.37 18.77 19.09 28642.16 2287764.0 11.58 400.28 SSA Total No. 115 115 115 112 98 112 102 112 100 110 115 No. of Countries 23 23 23 23 23 23 23 23 23 23 23 Mean. 51.65 24.10 12.54 558.23 1141.06 4.88 5.41 12555.59 24933.4 25.41 767.12 Std. Dev. 20.66 16.24 9.94 704.27 2016.68 3.61 8.18 26163.55 53726.4 34.14 1116.24 Total Total No. 328 320 312 324 283 328 312 327 305 335 340 No. of Countries 68 68 68 68 66 68 68 68 68 68 68 Mean. 25.54 11.06 5.82 967.40 4386.979 9.23 7.34 10782.09 111094.40 38.52 2044.93 Std. Dev. 25.41 14.42 8.31 1514.47 27215.18 11.20 10.15 19115.22 708315.60 32.74 2010.25
Examining the mean value of poverty level (poverty headcount ratio, poverty gap, and squared poverty gap) in Table 2, as expected, SSA experienced the most severe poverty over the world, followed by SA. Also, all levels of poverty in SSA are even worse than the average level of the world poverty, playing a role of big hurdles for the alleviation of poverty. In other words, SSA would be a key region that can improve poverty worldwide through MFIs’ activities. However, the average number of MFIs in SSA had not yet been at the topmost, but at the lowest position. In case of the other regions, MENA as the only region that non-profit MFIs had more borrowers than for-profits (breadth of outreach) shows the lowest poverty state. LAC records the highest GDP per capita, and at the same time the standard deviation is the largest over the world. This may point out that LAC experienced the high level of income inequality.
Like the percentage of female borrower used as a proxy for MFIs’ depth outreach, the size of loan per borrower (gross loan portfolio divided by number of active borrower) is an important indicator that can identify who is being targeted (depth of outreach) by the MFIs. The non-profit MFIs would provide small loans to the poorer (deeper outreach) while the for-profits would target the better-off clients for securing the rate of return with high interest rate (shallower outreach) (Olivares-Polanco, 2005). Among the regions except for SA, average loan per borrowers of for-profit MFIs is larger than that of non-profit MFIs, implying that for-profits mainly provided large loans to the better-off clients.
On the contrary, the average number of active borrowers measuring the breadth of outreach in for-profits MFIs is approximately ten times larger than non-profits in the total sample. In this regard, taking into account the fact that on average, the number of non-profit MFIs is bigger than that of profits, it can be summarized that the smaller number of for-profits reached out to more and better-off clients with larger loans, whereas the larger number
of non-profits provided smaller loans to the less number of clients that would be mostly the worse-off. Therefore, the recent trend of mission drift is indirectly confirmed that the transformation into for-profits may lead the MFIs to target the better-off customers with larger loans.
4.3 Regression Results
Tables 3 to 8 present the regression analysis results testing the hypothesis of the relationship between gross loan portfolio (GLP) and three different poverty indicators (poverty headcount ratio, poverty gap, squared poverty gap) measuring the different level of poverty (incidence, depth, and severity) in the non-profits, for-profits, and aggregate MFIs. Tables 3 to 5 show the pooled OLS results with regional dummies using an instrumental variable, operating expense ratio (operating expense / average gross loan portfolio) as a proxy for operating efficiency of MFIs. The results of random effects regression are presented in Tables 6 to 8.
Table 3. Pooled OLS Regression Results: Non-profits vs. For-profits (Dependent Variable: Poverty Headcount Ratio)
Note 1) Robust standard errors in parentheses 2) *** p<0.01, ** p<0.05, * p<0.1
3) ‘Middle East and North Africa’ (MENA) is excluded to avoid multicollinearity
MFIs
Profit Status Non-profit MFIs For-profit MFIs Aggregate MFIs
Explanatory variables
Log of GLP per borrower Log of GLP per borrower with IV Log of GLP Log of GLP per borrower Log of GLP per borrower with IV Log of GLP Log of GLP per borrower Log of GLP
(1) (2) (3) (4) (5) (6) (7) (8) Log of GLP (Non-Profit) -0.734 (0.566) Log of GLP per borrower (Non-Profit) -2.094*** -10.40*** (0.794) (2.375) Log of GLP (For-Profit) -0.253 (0.413) Log of GLP per borrower (For-Profit) -0.226 -8.878*** (0.621) (3.353) Log of GLP (Aggregate) -0.339 (0.453) Log of GLP per borrower (Aggregate) -0.567 (0.613) Log GDP per capita -11.71*** -11.01*** -7.555*** -11.91*** -11.52*** -8.203*** -11.85*** -11.66*** (1.312) (1.306) (1.576) (1.400) (1.455) (1.986) (1.280) (1.303) Domestic credit -0.01000 -0.0159 -0.0344 -0.00909 -0.0180 0.0204 -0.00741 -0.0114 (0.0198) (0.0206) (0.0306) (0.0261) (0.0263) (0.0424) (0.0210) (0.0203) EAP 14.20*** (1.952) 13.58*** (1.847) (4.724) 8.957* 13.12*** (1.908) 14.47*** (2.045) (6.892) 5.632 14.45*** (1.803) 14.34*** (1.791) ECA 5.200*** (1.800) 6.811*** (1.828) 13.36*** (4.342) 5.163*** (1.899) 5.392*** (1.922) (5.154) 4.382 5.610*** (1.726) 5.692*** (1.713) LAC 14.67*** (1.983) 14.80*** (1.870) 15.15*** (3.720) 14.54*** (2.128) 14.17*** (2.230) (6.434) 3.562 15.00*** (1.928) 14.68*** (1.911) SA 16.90*** (3.005) 15.62*** (2.952) 10.46** (4.749) 16.79*** (3.010) 17.76*** (3.483) (10.52) -5.898 17.27*** (2.969) 16.28*** (3.047) SSA 35.43*** 35.56*** 34.96*** 35.06*** 35.96*** 23.07*** 35.69*** 35.47*** (2.246) (2.182) (3.760) (2.387) (2.699) (7.101) (2.203) (2.259) Constant 100.2*** (11.98) 97.34*** (9.445) 124.3*** (12.39) 95.11*** (11.92) 89.57*** (10.18) 133.7*** (20.7) 95.68*** (11.15) 92.91*** (9.11) Observations 309 308 293 296 267 247 319 319 Adj. R-sq 0.769 0.773 0.687 0.769 0.766 0.611 0.771 0.771 D-W-Hausman test 0.000 0.0009
Weak identification test
Table 4. Pooled OLS Regression Results: Non-profits vs. For-profits (Dependent Variable: Poverty Gap)
Note 1) Robust standard errors in parentheses 2) *** p<0.01, ** p<0.05, * p<0.1
3) ‘Middle East and North Africa’ (MENA) is excluded to avoid multicollinearity
MFIs
Profit Status Non-profit MFIs For-profit MFIs Aggregate MFIs
Explanatory variables
Log of GLP per borrower Log of GLP per borrower with IV Log of GLP Log of GLP per borrower Log of GLP per borrower with IV Log of GLP Log of GLP per borrower Log of GLP
(1) (2) (3) (4) (5) (6) (7) (8) Log of GLP (Non-Profit) -1.160** (0.555) Log of GLP per borrower (Non-Profit) -2.236*** -5.889*** (0.671) (1.542) Log of GLP (For-Profit) -0.735* (0.390) Log of GLP per borrower (For-Profit) -0.491 -4.045** (0.529) (2.010) Log of GLP (Aggregate) -0.812* (0.424) Log of GLP per borrower (Aggregate) -0.656 (0.513) Log GDP per capita -6.120*** -5.490*** -4.087*** -5.994*** -5.786*** -3.796*** -6.064*** -5.963*** (0.926) (0.913) (1.015) (0.998) (1.099) (1.210) (0.902) (0.938) Domestic credit -0.00220 -0.00945 -0.0146 -0.00237 -0.0159 0.00381 0.00545 -0.00486 (0.0135) (0.0146) (0.0198) (0.0184) (0.0195) (0.0254) (0.0145) (0.0147) EAP (1.190) 1.486 (1.187) 1.205 (3.062) -0.618 (1.200) 1.078 (1.414) 2.412* (4.049) -0.961 (1.149) 1.301 (1.146) 1.614 ECA (1.354) 2.263* 4.114*** (1.389) 7.432** (2.938) (1.380) 2.202 (1.345) 1.986 (3.174) 1.697 2.835** (1.261) 2.655** (1.158) LAC 7.430*** (1.330) 7.806*** (1.276) 8.382*** (2.465) 7.614*** (1.425) 6.840*** (1.502) (3.772) 2.246 8.055*** (1.279) 7.481*** (1.205) SA (1.431) 1.130 -0.0125 (1.435) (3.076) -2.067 (1.438) 1.684 (1.863) 1.104 (6.095) -7.815 (1.386) 2.041 (1.462) 0.709 SSA 15.28*** (1.615) 15.71*** (1.580) 15.63*** (2.476) 15.45*** (1.676) 15.90*** (1.825) 10.22** (4.107) 15.81*** (1.553) 15.67*** (1.536) Constant 63.04*** (10.44) 55.25*** (6.908) 67.60*** (8.087) 56.95*** (9.449) 47.65*** (7.558) 60.86*** (12.02) 58.33*** (9.142) 49.36*** (6.672) Observations 301 300 286 288 260 241 311 311 Adj. R-sq 0.607 0.628 0.566 0.602 0.589 0.484 0.606 0.599 D-W-Hausman test 0.0113 0.0331
Weak identification test
Table 5. Pooled OLS Regression Results: Non-profits vs. For-profits (Dependent Variable: Squared Poverty Gap)
Note 1) Robust standard errors in parentheses 2) *** p<0.01, ** p<0.05, * p<0.1
3) ‘Middle East and North Africa’ (MENA) is excluded to avoid multicollinearity
MFIs
Profit Status Non-profit MFIs For-profit MFIs Aggregate MFIs
Explanatory variables
Log of GLP per borrower Log of GLP per borrower with IV Log of GLP Log of GLP per borrower Log of GLP per borrower with IV Log of GLP Log of GLP per borrower Log of GLP
(1) (2) (3) (4) (5) (6) (7) (8) Log of GLP (Non-Profit) -0.844** (0.385) Log of GLP per borrower (Non-Profit) -1.330*** -4.653*** (0.460) (1.074) Log of GLP (For-Profit) -0.396 (0.260) Log of GLP per borrower (For-Profit) 0.0878 -3.302** (0.340) (1.457) Log of GLP (Aggregate) -0.414 (0.284) Log of GLP per borrower (Aggregate) -0.0630 (0.341) Log GDP per capita -3.522*** -3.169*** -1.967*** -3.381*** -3.417*** -1.710** -3.508*** -3.584*** (0.562) (0.559) (0.704) (0.604) (0.652) (0.868) (0.552) (0.581) Domestic credit -0.00457 -0.00875 -0.0135 -0.00644 -0.0160 0.00363 -0.000355 -0.00587 (0.00755) (0.00840) (0.0139) (0.0110) (0.0111) (0.0188) (0.00847) (0.00824) EAP (0.820) -0.215 (0.785) -0.184 (2.146) -1.415 (0.838) -0.456 (0.856) 0.557 (2.944) -2.100 (0.769) -0.286 (0.716) 0.0428 ECA (0.942) 0.866 2.206** (0.940) 5.609** (2.188) (0.921) 0.766 (0.837) 0.422 (2.435) 0.668 (0.825) 1.274 (0.742) 1.009 LAC 4.685*** (0.923) 5.027*** (0.862) 6.007*** (1.800) 4.570*** (0.973) 4.346*** (0.936) (2.726) 0.593 4.988*** (0.868) 4.721*** (0.785) SA (0.899) -0.851 (0.857) -1.380 (2.148) -2.883 (0.841) -0.557 (1.060) -0.228 -8.193* (4.351) (0.789) -0.311 (0.847) -0.640 SSA 7.501*** 7.953*** 8.279*** 7.764*** 8.253*** 3.536 7.932*** 7.973*** (1.021) (0.967) (1.785) (1.044) (1.105) (2.956) (0.952) -3.584*** Constant 38.84*** 32.00*** 43.32*** 32.05*** 25.62*** 39.04*** 32.82*** 27.35*** (7.192) (4.429) (5.548) (6.212) (4.495) (8.691) (6.116) (4.167) Observations 293 292 278 280 254 235 303 303 Adj. R-sq 0.523 0.527 0.404 0.510 0.499 0.183 0.512 0.505 D-W-Hausman test 0.0004 0.0017
Weak identification test
Tables 3 to 5 describe the pooled OLS results with regional dummies for each poverty measures: poverty headcount ratio, poverty gap, and squared poverty gap. When the regional dummies are not controlled for, GDP per capita may be overestimated because the income level in a country or each region may be a major determinant of poverty level, and thus, the omitted variable bias occurs in the estimation models. Also, as explained earlier, an instrument, operating expense ratio for the equations using loan per borrower is utilized to address the potential reverse causality problem in the column (3) and (6) of Tables 3, 4, and 5 with the validity test results. Durbin-Wu-Hausman tests for endogeneity suggest that there is endogeneity in the equations that loan per borrower is indeed endogenous, and then an IV is necessary. The weak identification test to check whether there is low correlation between loan per borrower and operation expense ratio indicates that the IV is strong enough based on F-statistics results that if F > 10, an IV is strong. To support this, correlation matrix and first-stage regression results are given in Appendices 2 and 3. The correlation matrix presents that all explanatory variables are significantly correlated with poverty variables such as poverty headcount ratio, poverty gap, and squared poverty gap. An instrument is also highly and negatively correlated with the endogenous variable (Log of GLP per borrower). There is no need to use the Sargan over-identification test because the one instrument for loan per borrower is used (Wooldridge 2010, p.513-540).
In the columns (1) and (3) of Table 3, log9 of GLP in the non-profit and for-profit
MFIs are negatively associated with poverty headcount ratio (incidence of poverty), but not significant. In case of log of GLP per borrower in the column (2) and (5), only non-profit MFIs’ loan is negative and significant at 1% level while for-non-profit MFIs’ loan is insignificant. However, controlling for the endogeneity issue by using an IV, it was found
9 This is called the semi-elasticity of the dependent variable (poverty measures) with respect to the independent variable
out that log of loan per borrower of the both types of MFIs are negative and significant at 1% level, implying that log of loan per borrower reduces poverty. That is, when loan per borrower of non-profit MFIs increase by 1%, poverty (headcount ratio, percentage term) is reduced by 0.104%. A rise of 1% in loan per borrower of for-profit MFIs alleviates poverty by 0.089%. Yet, log of GLP and GLP per borrower in aggregate MFIs are insignificant. Log of GDP per capita is, as expected, negative and significant at 1 % level in all the estimations. Conversely, the coefficients of domestic credit measuring financial development in a country are all insignificant. Regional dummies turned out that all regions are positive and significant. This indicates that all regions (EAP, ECA, LAC, SA, and SSA) over MENA have higher poverty headcount ratio. These results are consistent with the descriptive statistics by regions of table 2 that MENA has the lowest poverty level in the world.
Table 4 reveals the result of the use of poverty gap (depth of poverty) as a dependent variable in the pooled OLS. Log of GLP in the non-profits and for-profits in the column (1) and (4) are negative and significant at each 5% and 10% level. For the log of GLP per borrower, non-profits are solely negative at 1% statistical significance. Using an IV in columns (3) and (6), it was found out that log of GLP per borrower is negatively and significantly associated with poverty at 1% and 5% level in each non-profits and for-profits. Log of GLP in aggregate MFIs is negative and significant at 10% level whereas log of GLP per borrower is negative, but not significant. Like the Table 3, log of GDP per capita is negative at 1% statistical significance while domestic credit is insignificant in the all estimations. Also, in case of regional dummies that are statistically significant, the results are consistent with the mean value of poverty level in descriptive statistics by regions in Table 2. Specifically, in columns (3) of table 4, the coefficient estimate of regional dummies where are positive and statistically significant are SSA (0.156), LAC
(0.0838), and ECA (0.0743). In Table 3, among those three regions, SSA has the highest poverty gap (0.0241), LAC is the second (0.0445), and ECA is the lowest (0.0134).
Table 5 observes the results replacing poverty gap in Table 4 with squared poverty gap (severity of poverty). Log of GLP and GLP per borrower are only statistically significant in profit MFIs with negative sign. Yet, the inclusion of the IV for non-profits and for-non-profits where non-non-profits (0.0465) has a slightly lager impact on poverty reduction than that of for-profits (0.033) shows the consistent results with Tables 3 and 4. An interpretation is that a 1% increase in loan per borrower of non-profit MFIs improves poverty severity in a county by 0.0465%, and at the same time when for-profit MFIs lend more loans by 1%, the poverty is alleviated by 0.033%. In all the equations of Table 5, not only log of GDP per capita but also domestic credits turned out the same results of Tables 3 and 4 that log of GDP per capita is negative and significant, on the other hand, domestic credits is insignificant. Besides, the same results in regional dummies of Tables 3 and 4 are observed in the Table 5 that the LAC and SSA that have significant values actually experience the severer poverty than MENA. Unexpectedly, however, log of GLP per borrower with an IV in SA turned out that it is negative and significant, which implies that SA has lower poverty level than MENA. This is inconsistent with descriptive statistics results by regions in Table 2. Therefore, this result may be biased, and needs to be tested with advanced regression techniques.
In sum, log of GLP per borrower with an IV are negatively and significantly associated with all poverty measures (poverty headcount ratio, poverty gap, and squared poverty gap) in the two different nature of MFIs. This implies that MFIs reduce poverty in all different level. In other words, not only non-profits but also for-profits reach out to the poorest of the poor, and thus reduce poverty. In particular, non-profit MFIs have a slightly lager impact on poverty reduction than that of for-profit, meaning that non-profit MFIs
may reach out to the poorer households or lend more loans to them for fighting poverty than for-profit MFIs.
However, the results of pooled OLS regressions may be biased since the time-constant or time-varying unobserved factors are not controlled in the models, which may cause serial correlation between explanatory variables and error terms (omitted variable bias). To eliminate the unobserved effects on the models, fixed effects (FE) and random effects (RE) estimations are applied in this analysis; fixed effects control for time-constant variables and random effects controls for time-varying variables. The decision on which one to use can be made by the Hausman test (1978). Basically, it tests the null hypothesis that there is no systematic difference between the two models (i.e. Test: H0: difference in
coefficients not systematic.) The test results are given in Tables 6 to 8, indicating that since the null hypothesis is not rejected, random effects models would be more appropriate to be used in our models except for the one model in column (3) of Table 6 that rejects the null hypothesis. This is because standard error of the random effects is less than that of the fixed effects, implying that random effect estimate would be more efficient.
Based on this, Tables 6 through 8 report the results of the random effects regressions using poverty headcount ratio, poverty gap and squared poverty gap, respectively in the same manner that the pooled OLS results are described in Table 3 to 5.
Table 6. Random Effects Regression Results: Non-profits vs. For-profits (Dependent variable: Poverty Headcount Ratio)
Note 1) Robust standard errors in parentheses ( ) 2) *** p<0.01, ** p<0.05, * p<0.1 3) P-values in parentheses [ ]
4) Hausman test: Random effects should be used in the analysis
In Table 6, the effect of loan per borrower on poverty alleviation is significantly observed in only non-profit MFIs at 10% level. In the column (3) that is the most appropriate to use fixed effects, the log of GLP in for-profit MFIs is even positively associated with poverty headcount ratio at 5 % statistical significance. This implies that for-profit MFIs even exacerbate poverty level. As examined in the pooled OLS results, the aggregate MFIs do not have any significant impact on reducing poverty.
MFIs
Profit Status Non-profit MFIs For-profit MFIs Aggregate MFIs Explanatory
variables
Log of GLP per borrower Log of GLP GLP (FE)Log of Log of GLP per borrowerLog of GLP Log of GLP per borrower Log of GLP
(1) (2) (3) (4) (5) (6) (7) Log of GLP (Non-profit) -0.663 (0.459) Log of GLP per borrower (Non-profit) -1.111* (0.598) Log of GLP (For-profit) 0.972** 0.398 (0.481) (0.414) Log of GLP per borrower (For-profit) 0.0844 (0.531) Log of GLP (Aggregate) -0.272 (0.360) -0.383 Log of GLP per borrower (Aggregate) (0.513) Log GDP per capita -18.69*** -18.18*** -22.55*** -19.34*** -19.10*** -19.24*** -19.12*** (1.726) (1.754) (3.804) (1.712) (1.889) (1.725) (1.767) Domestic credit 0.0259 0.0206 0.000740 0.00424 0.00524 0.0294 0.0273 (0.0434) (0.0431) (0.0555) (0.0431) (0.0463) (0.0425) (0.0421) Constant 166.2*** (11.80) 160.1*** (11.24) 169.7***(23.69) 155.7***(11.60) 159.5*** (11.93) 165.0*** (11.16) 162.3*** (11.17) Observations 309 308 296 296 267 319 319 Number of countries 68 68 68 68 65 68 68 Hausman RE, FE Test (χ2 ) p-values [0.8404] [0.3283] [0.0477] [0.0631] [0.7160] [0.3259]