The University of Maine The University of Maine
DigitalCommons@UMaine
DigitalCommons@UMaine
Electronic Theses and Dissertations Fogler Library
Spring 5-10-2019
An Economic Analysis of Student Loan Default
An Economic Analysis of Student Loan Default
Arianna CastonguayUniversity of Maine, castonguayah@gmail.com
Follow this and additional works at: https://digitalcommons.library.umaine.edu/etd
Part of the Econometrics Commons, Education Economics Commons, Labor Economics Commons, and the Other Education Commons
Recommended Citation Recommended Citation
Castonguay, Arianna, "An Economic Analysis of Student Loan Default" (2019). Electronic Theses and Dissertations. 2965.
https://digitalcommons.library.umaine.edu/etd/2965
This Open-Access Thesis is brought to you for free and open access by DigitalCommons@UMaine. It has been accepted for inclusion in Electronic Theses and Dissertations by an authorized administrator of
AN ECONOMIC ANALYSIS OF STUDENT LOAN DEFAULT
By
Arianna H. Castonguay B.S. University of Maine, 2017
A THESIS
Submitted in Partial Fulfillment of the Requirements for the Degree of
Master of Science (in Economics)
The Graduate School The University of Maine
May 2019
Advisory Committee:
Philip Trostel, Professor of Economics, Advisor Angela Daley, Assistant Professor of Economics Elizabeth Allan, Professor of Higher Education
AN ECONOMIC ANALYSIS OF STUDENT LOAN DEFAULT
By Arianna H. Castonguay Thesis Advisor: Dr. Philip Trostel
An Abstract of the Thesis Presented In Partial Fulfillment of the Requirements for the
Degree of Master of Science (in Economics)
May 2019
Cumulative student loan debt in the United States has now surpassed $1.5 trillion. Moreover, since the turn of the century, cohort default rates of these loans have steadily risen across all types of institutions. The latest data from the U.S. Department of Education shows 10.8 percent of borrowers who entered repayment in fiscal year 2015 have defaulted within three years. In turn, the first chapter of this paper summarizes student loan policies as well as trends in debt and default. Furthermore, it highlights the consequences of high student debt and default for individual borrowers and the economy. Results show evidence to support significant decreases in purchasing homes, having children, and getting married as results of high student loan debt burdens. Other significant findings include many individuals reporting working in jobs outside their fields of study, as well as working more than desired. Continuing, this paper evaluates higher education-related policies and how such policies have impacted default rates and debt in recent years. The general conclusion is that such policies have done little to decrease student loan debt and default.
The second chapter consists of a micro-level Probit regression analysis of student loan default, using institutional and individual level characteristics as explanatory variables. The goal is to highlight which factors, if any, are more related to high likelihood of defaulting on student
loan payments. Data from the Beginning Postsecondary Students Longitudinal Survey is used for the analysis. Results are mostly consistent with previous literature. Degree completion and/or the level of degree completion has the greatest impact on repayment behavior, although there are other factors also associated with default. Furthermore, institutional characteristics have little bearing in predicting default once individual level characteristics are added to the model.
DEDICATION
TABLE OF CONTENTS
DEDICATION………ii
LIST OF TABLES………...viii
LIST OF FIGURES………....ix
1. A HISTORY OF STUDENT LOANS………...1
Introduction………..1
Background: Why College is Important………..2
Earnings………...3
Other Private Benefits………..4
Background: The Structure of Federal Student Loan Programs………..5
Types of Federal Loans………6
Direct Subsidized Loans………..6
Direct Unsubsidized Loans………..6
Graduate PLUS Loans……….7
Repayment of Federal Loans………...7
Debt Burdens, Delinquency, Default, and Their Consequences………..9
Revoking of Professional Licenses………10
Postgraduate Plans……….10
Delaying of Major Purchases and Life Milestones………11
Current and Past Student Loan Policies and Regulations………..12
Trends in Repayment and Default……….19
Analysis of National Default Data……….25
Factors Contributing to Default……….26
Changes in Default Over Time………..27
Student Loan Debt Effects on Other Economic Markets………...29
Purchasing a Home………30
Implications………31
Birth Rates……….31
Personal Consumption………...32
Other Consequences of Education Costs………...33
Policy Recommendations………...34
Use Credit Scores to Target Riskiest Borrowers for Repayment Assistance……34
Allow Institutions to Set Loan Limits for Certain Borrowers………...35
Strengthen Income-Drive Repayment Options………..35
Incorporate Entrance and Exit Counseling into the Department of Education’s Financial Awareness Counseling Tool(FACT)………36
Implement a “Variable-Fixed” Interest Rate System Based on Market Rates…..37
Create a Universal Loan Portal………..37
Conclusion……….38
2. WHAT AFFECTS STUDENT LOAN DEFAULT? ……….….40
Introduction………40
Literature Review………...42
Background Characteristics of Borrowers……….…44
Age……….…45
Gender………....45
Ethnicity……….45
Family Background and Income………....46
Academic Preparedness……….46
College Experience Variables………47
Major/Field of Study………..47
Attendance……….47
Student Employment………..48
Exit Counseling………..48
Other Experience Variables………...48
College Success Variables……….49
Graduation……….49
Grade Point Average……….49
Continuous Enrollment………..50
Credit Hours Earned/Failed………...50
Post-College Variables……….……..50
Unemployment……….………..50
Income………51
Personal and Family Arrangements………...51
Knowledge of Repayment Obligations………..52
Debt and Repayment-related Variables……….52
Cumulative Educational Debt………52
Perceptions of Debt………53
Loan Servicing………...53
Data and Methodology………...54
Descriptive Statistics………..54 Conceptual Framework………..57 Model #1………57 Variable Specification………58 Model #2………61 Results………61 Discussion………..64 Model #1………64 Model #2………67 Limitations……….68
Conclusions and Future Research………..69
REFERENCES………..71
APPENDICIES………..78
Appendix A: Education Cost One-Way T-Test Results………78
Appendix B: Income OLS Regression for Imputation………..80
Appendix C: Beginning Postsecondary Students Longitudinal Survey: Variable Names and Descriptions………...……….81
Appendix E: Stata Code (Do-Files) for Analysis………..85 Appendix F: Marginal Effects of Model #1 and Model #2 with Full Set of
Observations………..87
Appendix G: Marginal Effects of Model #1 Highlighting Degree Completion……...….89
LIST OF TABLES
Table 1. Federal loan repayment plans………..7
Table 2. Average federal loan balance, number of borrowers, and total balance by
repayment status, second quarter 2018………..21
Table 3. Federal student loan five-year repayment rate by completion status:
Borrowers entering repayment in 2009-10 and 2010-11………...………22 Table 4. Average three-year cohort default rates, 2015………...27
Table 5. Descriptive statistics for the sample………..55
Table 6. Regression results………..62
Table 7. Variable descriptions……….79
Table 8. T-test results………...79
Table 9. Income OLS regression results………..80
Table 10. Variable descriptions……….81
Table 11. Regression results………..87
LIST OF FIGURES
Figure 1. Average Published Tuition and Fees in 2018 Dollars by Sector, 1988-89
to 2018-19………..………16
Figure 2. Total Federal and Nonfederal Loans in 2017 Dollars………18 Figure 3. Repayment Status of Federal Education Loan Portfolio, Fourth Quarter
FY16 - FY18………..20
Figure 4. National Default Rates, 1987 to 2015………23
Figure 5. Cohort Default Rates of Public Institutions, by Level, 2001-2011………24 Figure 6. Cohort Default Rates of Private Nonprofit Institutions, by Level, 2001-2011…..24 Figure 7. Cohort Default Rates of Private For-profit Institutions, by Level, 2001-2011…..25 Figure 8. National Default Rates, 1987 to 2015, by HEA Reauthorization………..28 Figure 9. National Default Rates Compared to New and Existing U.S. House Sales,
1987 to 2015...30 Figure 10. National Default Rates and U.S. Birth Rates, 1987 to 2015………..32 Figure 11. National Default Rates and Change in Annual Personal Consumption,
CHAPTER 1
A HISTORY OF STUDENT LOANS Introduction
With cumulative student loan debt levels passing $1.5 trillion in the United States, financing higher education has become a popular yet contentious topic amongst policymakers, educators, administrators, parents, and students alike. While tuition and fees rise, federal financial aid has stagnated, turning more students toward loans to make up the difference. In turn, student financial aid recipients who default on these loans are receiving a great deal of attention from both the government and the public.
Since the turn of the century, cohort default rates have steadily risen across all types of institutions. Data released by the U.S. Department of Education shows 10.8 percent of borrowers who entered repayment in fiscal year 2015 defaulted within three years (Official Cohort Default Rates, 2018). Although this is down from 11.5 percent the year before, current default rates are still significantly higher than they were twenty years ago.
Increasing reliance on loans for financing higher education likely correlates to rising default. Since fiscal year 2000, total federal loans dispersed have increased from $33.7 billion to $57.3 billion (in 2016 dollars) (“Trends in Student Aid,” 2017). This is mirrored with rising tuition. The average tuition, fees, room and board for full-time undergraduate students at all institutions was $14,124 per year in 2000 and $22,432 in 2016 (in 2016 dollars) (Digest of Education Statistics, 2016). Federal grant aid has increased from an average of $3,639 per year in 2000-01 to $4,305 in 2016-17 (Title IV Program Volume Reports, 2017). Although
measurable, this increase does not compensate the tuition hikes. In fact, the percentage of average public four-year in-state published tuition and fees covered by the maximum Pell Grant
(a major source of grant aid for many students) declined from 92 percent in 1998-99 to 60 percent in 2018-19 (“Trends in College Pricing,” 2018).
The combination of higher prices (tuition) and less subsidies (federal and state grant aid) for postsecondary education has led to more students taking out loans1 and those students require
higher amounts2(“Trends in Student Aid,” 2017).
All things considered, rising student loan debt is unsurprising. That being said, rising debt and rising default have become major issues for policymakers to address. Burdensome student debt likely impacts individuals’ job market decisions, housing decisions, and familial choices, all of which have larger multiplicative effects on economic markets.
For this reason, the goal of this paper is to evaluate higher education-related policies to determine how such policies have impacted debt levels and default rates over time. Such an analysis will allow for the isolation of specific policy changes and their impacts on the student loan market. Furthermore, this paper will examine economic and labor market consequences of student loan debt levels and default rates as they are today.
Background: Why College is Important
For students who are at risk of having unmanageable student loan debt, is higher education still worth the investment? In short, yes.
Higher education has long been considered as a gateway to the middle class. It is
common knowledge that college graduates, on average, benefit from their degrees monetarily, as demonstrated in dozens of reports. Even if monetary advantages were the only benefits of higher
1 In 2001-02, there were 5.35 million borrowers of Subsidized and unsubsidized federal loans. By 2016-17, there
were 8.2 million borrowers.
2 In 2016-17, undergraduates taking subsidized and unsubsidized Direct Loans borrowed an average of $6,590—
education, it makes financial sense to invest in education for most high school graduates. Often, however, there are several other non-monetary effects of higher education that tend to be
overlooked when determining an individual’s optimal investment in education. The goal of this section is to demonstrate the full scope of benefits that arise from increased education.
Earnings
Mincer (1974) developed what would be aptly named the Mincer equation, which demonstrates the relationship between schooling, work experience, and earnings. The most widely used variation of this equation is as follows:
𝑙𝑛[𝑌(𝑠, 𝑥)] = 𝛼 + 𝜌𝑠𝑠 + 𝛽0𝑥 + 𝛽1𝑥2+ 𝜀
where Y(s,x) is the wage or earnings at schooling level s and work experience x, 𝜌𝑠 is the rate of
return to schooling (assumed to be the same for each additional year of schooling) and 𝜀 is a mean zero residual with E(𝜀|s,x). Over time, several economists used variations of this equation to estimate the return schooling. Trostel (2015) quantifies the earnings differential with respect to schooling in terms on dollars earned yearly. In the year 2012, the average annual earnings for high school graduates is $24,000, which is substantially higher than the average of $14,000 a year for those without a high-school diploma or GED. The difference in earnings from college attendance is often referred to as the college earnings premium. Trostel calculates this to be 134 percent (an additional $32,000 in earnings annually) for individuals with a bachelor’s degree over just high-school completion. The earnings premium for graduate degrees (master’s, professional and doctorates) is 46 percent ($26,000), relative to average earnings of those with bachelor’s degrees as their highest education credential.
Other Private Benefits
Considering monetary benefits alone, a simple benefit-cost analysis of higher education provides evidence of a worth-while investment. There are non-monetary benefits of higher education as well, further increasing the payoff of investment in higher education. Health
benefits include, the likelihood of having health insurance is 47 percent greater with a bachelor's degree than a high school diploma (Trostel, 2015). Daily smoking rates and alcohol consumption decrease with education, while healthy lifestyle choices increase with education (Oreopoulos & Salvanes, 2011). Life expectancy is greater for those with more education. Retirement security grows with education as well. Having a retirement plan at all increases with education, as does the amount saved in retirement accounts (Trostel, 2015). Job safety and security benefits include: the incidence of workers’ compensation decreases with more education, as does the rate of unemployment and the likelihood of being out of the labor force (Oreopoulos & Salvanes, 2011; Trostel, 2015). Other private benefits include financial literacy increases with education,
marriage rates increases, and reported happiness levels increases. Divorce rates decrease with more education. Incarceration rates decrease dramatically with more education, with the highest rate of incarcerated individuals being those without a high school diploma (Oreopoulos & Salvanes, 2011; Trostel, 2015). There are also fiscal externalities; higher incomes correlate with higher tax revenue for the government to run socially beneficial programs. More education is correlated with more volunteerism, employment at a non-profit organizations, and charitable contributions (when controlling for income). Finally, more education is correlated with higher political participation and community involvement (Oreopoulos & Salvanes, 2011; Trostel, 2015).
Ultimately, if the discounted future value outweighs the cost, including the cost of loans, the student should enroll in college and borrow if necessary. Because higher education is costly, it often results in low and middle-income students facing the decision to take out student loans to finance their degrees, attend college part time while working full time, delay college entry while saving money for college, or not attend at all. Still, there is overwhelming evidence showing investment in higher education is worth it and is profitable, especially over a lifetime.
Background: The Structure of Federal Student Loan Programs
Part of understanding student loan default is understanding student loans themselves, and the repayment options borrowers face. Loans for financing higher education are traditionally federally backed, although there are several companies that specialize in the lending of private loans for postsecondary education.
To qualify for federal student loans, independent students and dependent students’ parents complete the Free Application for Federal Student Aid (FAFSA), administered through the U.S. Department of Education. The financial information entered into this application is then used to determine a student’s eligibility for federal and state grant and loan aid. Students
demonstrating financial need may be eligible for Direct Subsidized Loans or Perkins Loans (not administered after September 30, 2017) from the federal government. Additionally, all students who fill out the FAFSA qualify for additional Direct Unsubsidized Loans, and if a graduate student, Direct Graduate Loans, and Graduate PLUS Loans (“Loans,” 2018).
Upon accepting any federal student loan, first time borrowers must complete entrance counseling to ensure they understand the responsibilities and obligations they are agreeing to. Additionally, all borrowers sign a Master Promissory Note, legally binding them to the terms and
conditions of repayment. Similarly, exit counseling is required each time borrowers drop below half-time enrollment, graduate, or leave school (“Student Loans,” 2018).
If students do not fill out the FAFSA, or the federal loans provided are not enough to meet their financial need, some students turn to private loan servicers to make up the difference. Private loan terms, such as the amount you can borrow and forms of repayment, vary by lender. Often, they require a co-signer and credit check, and may require repayment while still in school.
Types of Federal Loans
The U.S. Department of Education offers low-interest loans for eligible students to help cover the cost of higher education. Depending on financial need, and whether the borrower is an undergraduate or graduate student, they may be eligible for several different types of loans (“Loans,” 2018).
Direct Subsidized Loans. Direct Subsidized Loans, sometimes known as Stafford Loans or Direct Stafford Loans, are only available to undergraduate students who demonstrate financial need who are enrolled at least half-time. As of the 2018-19 academic year, interest rates for such loans is 5.05%. Terms unique to Direct Subsidized Loans is that the U.S. Department of
Education pays the interest on these loans while borrowers are in school, during the six month grace period after graduation, and during a period of deferment.
Direct Unsubsidized Loans. Direct Unsubsidized Loans are available to undergraduate and graduate students regardless of financial need. Unlike Direct Subsidized Loans however, borrowers of Direct Unsubsidized Loans are responsible for paying the interest accrued during all periods. The interest rate for Direct Unsubsidized Loans for undergraduates 5.05% for loans dispersed between July 1, 2018 and July 1, 2019. The interest rate for graduate students is 6.6%.
Graduate PLUS Loans. Graduate PLUS Loans are for all graduate or professional students enrolled at least half-time. For Direct PLUS Loans first dispersed on or after July 1, 2018, and before July 1, 2019, the interest rate is 7.6%.
The school in which students attend determine individual loan amount eligibility. However, there are federal limits on the amount of subsidized and unsubsidized loans one can receive during each academic year. There are also aggregate loan limits for both undergraduate and graduate study. These limits depend on what year in school the borrower is, and whether he or she is a dependent or independent student.
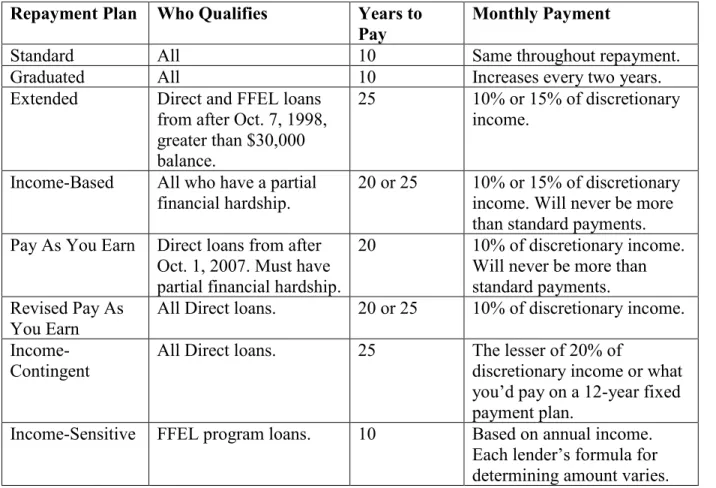
Repayment of Federal Loans
Table 1 - Federal loan repayment plans
Repayment Plan Who Qualifies Years to
Pay Monthly Payment
Standard All 10 Same throughout repayment.
Graduated All 10 Increases every two years.
Extended Direct and FFEL loans
from after Oct. 7, 1998, greater than $30,000 balance.
25 10% or 15% of discretionary
income. Income-Based All who have a partial
financial hardship.
20 or 25 10% or 15% of discretionary income. Will never be more than standard payments. Pay As You Earn Direct loans from after
Oct. 1, 2007. Must have partial financial hardship.
20 10% of discretionary income.
Will never be more than standard payments. Revised Pay As
You Earn
All Direct loans. 20 or 25 10% of discretionary income.
Income-Contingent
All Direct loans. 25 The lesser of 20% of
discretionary income or what you’d pay on a 12-year fixed payment plan.
Income-Sensitive FFEL program loans. 10 Based on annual income.
Each lender’s formula for determining amount varies.
Presently, the Standard Repayment Plan functions as the default option for the repayment of student loans. Below is a table detailing the various repayment plans.
In addition to the above repayment plans, there are also debt consolidation loans for students who would like to simplify loan repayment. Consolidation can be helpful for students who have federal loans with different loan providers. They allow any variable loan rate plans to become fixed rate plans and can lower monthly payments for borrowers in some cases.
Consolidation is not for everyone, however. Because consolidation usually increases the period of time to repay loans, borrowers might make more payments and pay more in interest than would be the case if they don’t consolidate. Consolidation may also lead to loss of certain borrower benefits—such as interest rate discounts, principal rebates, or some
loan cancellation benefits—that are associated with their current loans. If borrowers are paying current loans under an income-driven repayment plan, or if they have made qualifying payments toward Public Service Loan Forgiveness, consolidating current loans will cause the loss of credit for any payments made toward income-driven repayment plan forgiveness or Public Service
Loan Forgiveness (“Loan Consolidation,” 2018).
Under certain circumstances, borrowers can receive a deferment or forbearance that allows a temporary reprieve from making payments on federal student loans or a temporary reduction in the dollar amount of payments. Stopping or reducing payments may help
avoid default. The main difference between the two is that during deferment, borrowers are not responsible for paying for the interest that accrues during the time in which you are deferring. Not all loans qualify for deferment. Students must apply for deferment or forbearance with their Source: U.S. Department of Education, Federal Student Aid Office
loan service provider and must meet specific qualification criteria (“Deferment and Forbearance,” 2018).
Debt Burdens, Delinquency, Default, and Their Consequences
Consequences of not paying student loans payments include delinquency and default. A loan becomes delinquent the first day in which a payment is missed and will remain so until the past due amount is paid and the borrower has resumed up-to-date payments. A delinquency of 90-days or more will be reported to the three major national credit bureaus, which will lower the borrower’s credit score and negatively affect future finances (“Understanding Delinquency and Default,” 2018).
If loans continue to be delinquent, the loan may go into default. The point when a loan is considered to be in default varies depending on the type of loan received. Loans made under the William D. Ford Federal Direct Loan Program or the Federal Family Education Loan Program are considered defaulted after failing to make scheduled payments for at least 270 days.
Borrowers who go into default may face severe consequences such as acceleration of the loan (having the entire balance due at once), seizing of tax return funds or garnished wages as form of repayment, or even judicial action. Any judicial action taken towards a defaulted borrower may come with court costs, attorney’s fees, and other costs associated with the
collection process, all of which the borrower may be liable for. Additional consequences include loss of eligibility of additional federal financial aid, and the borrower is no longer eligible for deferment or forbearance of any kind. Borrowers lose the ability to choose a repayment plan when they default. Some schools will even choose to withhold a borrower’s academic transcript until the defaulted loan is satisfied (“Understanding Delinquency and Default,” 2018).
Negative impacts on a borrower’s credit score can be very severe, and it may take several years to reestablish a good credit record. A poor credit history is indicative of a risky borrower, and therefore credit servicers are more likely to deny credit, or subject the borrower to higher interest rates. This holds true for credit cards, home and auto loans, and other minor forms of consumer credit. It does not stop there, however. A poor credit score/history may generate trouble signing up for utilities, getting homeowner’s insurance, getting a cell phone plan, and/or getting approval to rent an apartment or office space.
Revoking of Professional Licenses
Some 15 states allow for government agencies to seize state-issued professional licensed from borrowers who default on their loans. This is down from 19 states one year ago. Borrowers subject to the potential seizure of their licenses include firefighters, nurses, teachers, lawyers, massage therapists, barbers, psychologists, and real estate brokers. Obviously, without the legal means to practice a profession, it is difficult to make enough money to come back from default. Moreover, if borrowers settle the payments on their loans eventually, they are still subject to large fees to get their licenses back. Borrowers in South Dakota face potential loss of driver’s licenses if they default on their loans, as well as denial of hunting, fishing, and camping permits (Silver-Greenberg et al., 2017).
Postgraduate Plans
Recent studies have focused on how educational debt affects borrowers’ choice of first jobs and/or decisions about enrolling in graduate or first professional schooling. That is, students who feel more constrained by their educational debt are more likely to consider their debt when choosing a first job (Minicozzi, 2005; Rothstein & Rouse, 2011). Such considerations lead some graduates to seek higher paying initial jobs, which often have the lowest rates of upward mobility
(Minicozzi, 2005). Similarly, students with debt levels greater than $10,000 are less likely to take jobs in traditionally low-paying sectors, such as government, public service, nonprofits, and education (Rothstein & Rouse, 2011). Furthermore, in the long run, graduates who work outside their major-related field report lower average earnings than their counterparts who work within their field of study (Thomas, 2000).
Educational debt may or may not be related to the entrance of graduate or first professional schooling. Several studies conclude there is no significant correlation between students’ undergraduate debt and their decision to enter graduate or first professional schooling (Baum & Saunders, 1998; Baum & Schwartz, 1988; Millett, 2003; Nettles, 1989; Weiler, 1994). On the other hand, a handful of researchers find there to be a significant negative influence debt burdens have on students’ transition into graduate school (Fox, 1992; Tsapogas & Cahalan, 1996; Wilder & Baydar, 1991). Murphy (1994) and Sanford (1980) find positive correlations between debt and the transition into graduate school.
Delaying of Major Purchases and Life Milestones
High monthly loan payments makes saving difficult for many borrowers. The 2014 Gallup-Perdue Report highlights how student debt burdens affect large purchases (“The 2014 Gallup-Perdue Index Report,” 2014). The study finds 36 percent of all graduates with student loans report delaying buying a home, which is a significant concern for the U.S. economy (Deep & Domanski, 2002). The Federal Reserve reports a 1 to 2 percentage point drop in
homeownership with every 10 percent increase in student debt during the first five years after exiting school (Mezza et al., 2016). Moreover, according to the National Association of Realtors, more than 70 percent of people ages 22 to 35 blame their student loans for why they have not bought a house yet (“Student Loan Debt and Housing,” 2017). More than 80 percent of
respondents say this is because they cannot save for a down payment because of student debt. Over 50 percent reported having too high of debt-to-income ratios and therefore unable to qualify for a mortgage. About one-third of borrowers with student loan debt between $30,000 and $50,000 and more than $70,000 expect to be delayed eight years or more from purchasing a home. This study also finds 72 percent of this cohort do not take vacations because of student loan debt; 65 percent postpone purchasing a car.
Some 40 percent of borrowers of greater than $25,000 responded that they believe their student debt impacts their ability to start a small business. Some borrowers also report delaying moving out of their parents’ house, having children, and getting married, as well as renting solo, purchasing entertainment, purchasing clothes, living closer to school/work, and owning a pet (“Student Loan Debt and Housing,” 2017).
Student debt burdens also have affected retirement saving amongst the youngest borrowers. The National Association of Realtors reports 61 percent of student loan borrowers have been unable to make contributions to a retirement account at one point or more. Thirty-two percent reported they did, but in reduced amounts.
Current and Past Student Loan Policies and Regulations
Understanding past and present rules and regulations regarding student loans and default is vital to analyze the effectiveness of such policies. The Higher Education Act of 1965 (HEA; P.L. 89-329) marked the beginning of such policies. It was first signed into law by President Lyndon B. Johnson on November 8, 1965 to enhance the resources of colleges and universities, and to provide financial assistance to lower- and middle-income families to attend such schools (McCants, 2003).
Title IV of the Higher Education Act of 1965 authorized Federal Student Aid programs including loans, grants, and work-study programs. Notably, this act established the Federal Family Education Loan Program (FFEL) which became the forefront for higher education loans from then on (“Federal Family Education Loan Program,” 2014). It was a system of private student loans that were subsidized and guaranteed by the United States federal government. That is, commercial lenders used their private capital to finance loans under the program and the federal government subsidized them to maintain low interest rates. These loans were also guaranteed by the federal government, protecting the private companies from financial loss if a borrower defaulted.
The Higher Education Act of 1965 has since been reauthorized in 1968, 1972, 1976, 1980, 1986, 1992, 1998, and 2008. Some years changed very little regarding student loans. Other years led to substantial changes in the way we view student loans. The 1986 HEA
Reauthorization and the Budget Reconciliation Acts of 1988 and 1990 raised loan limits and interest rates, as well as added restrictions on students, lenders, and institutions in attempts to address the alarming increase in defaults (Hannah, 1996). Furthermore, student loans replaced grants as the dominant form of federal aid; the gap between grant aid and loans continued to widen (Schenet, 1992).
The 1992 Reauthorization of the HEA led to another significant shift into loan-based financing of higher education (Hannah, 1996). The Student Loan Reform Act of 1993, as part of the Omnibus Reconciliation Act of 1993 (P.L. 103-213), would phase in direct lending, in addition to the government backed private loans. This became known as the William D. Ford Federal Direct Loan Program (“A History of Direct Loans”). Colleges and universities then had a choice of which loan program to use. Most institutions continued using private guaranteed loans
until 2008 when credit market disruptions threatened the ability of many private lenders to make loans under the program (“Student Loan History”).
The 1998 HEA Reauthorization discussions focused a great deal on growing student loan default rates (Gross et al., 2010). Research at the time highlighted certain types of schools for having particularly high default rates. In response, the new policy eliminated Pell grant eligibility for high-default schools (rates higher than 25 percent for three years in a row), as well as
required schools to post a surety when appealing this loss of eligibility (“Reauthorization of 1998 Higher Education Act,” 2005). Historically Black Colleges and Universities (HBCUs), as well as Tribally Controlled Colleges and Universities (TCCUs) were exempt from these rules until 2004. Additionally, the definition of default was changed from 180 days to 270 days of continuous delinquency (Burd, 1998). This policy also prohibited the consolidation of any defaulted loans.
The 2008 HEA Reauthorization, also known as the Higher Education Opportunity Act (HEA; P.L. 110-315), changed the default calculation window to three years instead of two, allowing for more detailed analysis of changes over time. The maximum Pell grant award
increased slightly, and interest rates on subsidized loans were reduced. This bill also capped loan repayment at 15 percent of an individual’s discretionary income, and allowed for loan
forgiveness for public servants in the Direct Loan Program.
President Barack Obama proposed the elimination of the FFEL program in 2010. The Student Aid and Fiscal Responsibility Act, a rider bill to the Health Care and Education Reconciliation Act of 2010 (P.L. 111-152), terminated the FFEL program. The Federal Direct Loan Program provides all federal student loans now.
The Higher Education Act of 1965 has not since been reauthorized. However, there is a current bill proposed titled the Promoting Real Opportunity, Success, and Prosperity through
Education Reform (PROSPER) Act which intends to extend the HEA once more (“Promoting Real Opportunity,” 2017). The most relevant part of this bill is the movement towards a new Federal ONE Loan Program. This program would consolidate the six current loans available into one unsubsidized loan for undergraduates, one for graduates, and one for parents. The bill also allows financial aid administrators to set individual lower loan limits for certain categories of borrowers to encourage responsible lending. Institutions are required to disburse loans to students on a weekly or monthly basis. The bill eliminates fees borrowers pay for each loan disbursed and maintains the market-driven interest rates set in current law. With regards to repayment, the PROSPER Act consolidates to one standard 10-year repayment plan and one income-driven repayment (IDR) plan. Furthermore, the PROSPER Act will create a program-level loan repayment rate tied to program eligibility. This replaces the current policy of using institutional-level cohort default rates, which means federal student aid will be targeted towards programs whose graduates have the ability to repay their student loans (PSOSPER Act Bill Summary, 2017).
Trends in Student Aid
Student aid catches a lot of attention due to its inherently large numbers, especially the $1.5 trillion in U.S. student debt. Measuring levels of aggregate student aid can be difficult however, due to consistently changing enrollment levels. Total spending grew significantly when enrollment spiked during the Great Recession between 2008-09 and 2010-11. Specifically, during that time Pell Grant expenditures nearly doubled from $20.4 billion (in 2017 dollars) to $40.1 billion (Federal Pell Grant Program, 2018). When enrollment levels declined and financial circumstances of students became more stable as the economy recovered, total expenditures declined once more.
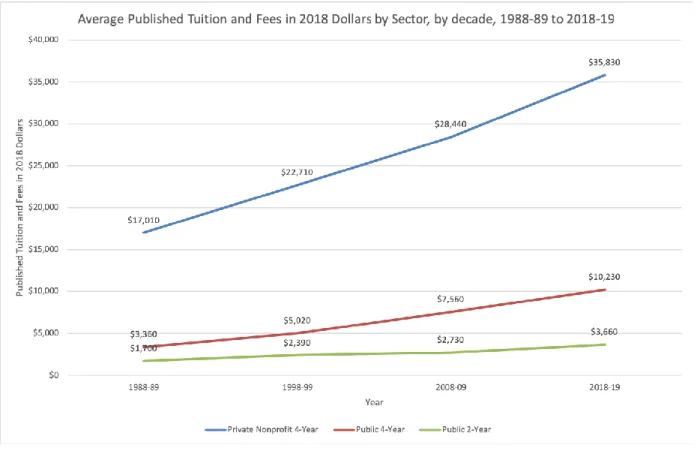
Moreover, evaluating trends in student aid should be done concurrently with evaluation of trends in college pricing. Between 2008-09 and 2018-19, published in-state tuition and fees for public 4-year institutions climbed 3.1 percent beyond the inflation rate, 2.3 percent for
private nonprofit 4-year institutions, and 3.0 percent for public 2-year institutions (Annual Survey of Colleges, 2018). Figure 1 shows an upward trend of the average inflation-adjusted published tuition and fee rates by sector, by decade, from 1988-89 to 2018-19. There have been consistent and significant increases in published prices across all institution types over the past thirty years, so it is unsurprising aggregate student aid expenditures have risen.
Figure 1 - Average Published Tuition and Fees in 2018 Dollars by Sector, 1988-89 to 2018-19 by decade
Source: College Board, Annual Survey of Colleges, 2018-19
Federal aid comes in many forms aside from loans. In 2017-18, 12.0 million people received some form of Federal Education Tax Benefits, with an average aid of $1,390 (“Trends
in Student Aid,” 2018). There were 7.0 million people received a Federal Pell Grant, with an average of $4,010. Federal Supplemental Educational Opportunity Grants (FSEOG) were given to 1.4 million recipients ($530 average aid). An estimated 601,000 students received Federal Work-Study (FWS) funding, which allows students to receive compensation from work on campus (“Annual Federal Program Data Books,” 2018). This is down from 698,000 in 2007-08. In 2017, Congress passed legislation increasing the generosity of education benefits for veterans. Since then, an estimated 767,000 veteran students received an average of $15,310 in Post-9/11 GI Bill Veterans Benefits (Office of Budget and Finance, 2018).
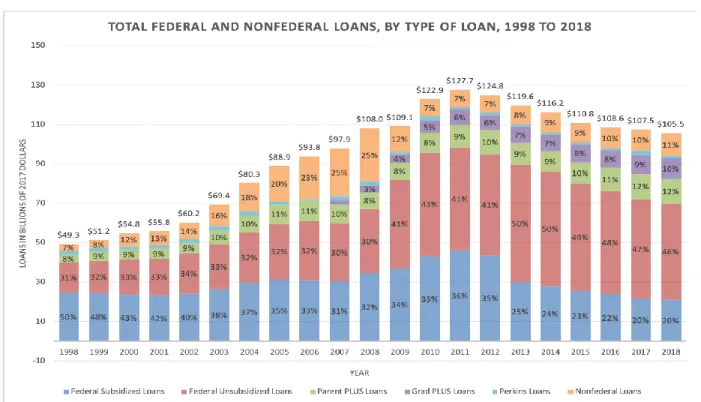
Annual parent and student borrowing for higher education has decreased in real terms consistently since 2011 but are still measurably higher than twenty years ago. Total borrowing each year rose from $49.3 billion (in 2017 dollars) in 1997-98 to $127.7 billion in 2010-11, and then down to $105.5 billion in 2017-18. The recent decline is largely attributed to the decrease in enrollment and financial need after the Great Recession. Over that time there was a real change in students’ borrowing behavior as well. This can be seen in Figure 2. In 1997-98, 61 percent of Stafford loans were subsidized. By 2007-08, the percentage had declined to 52 percent. In 2017-18, only 30 percent of Stafford loans are subsidized. In general, however, student borrowing from the Direct Loan Program declined 22 percent between 2012-13 and 2017-18. In the same time, both Parent PLUS and Grad PLUS loans increased 22 and 27 percent respectively (“Trends in Student Aid,” 2018).
Figure 2 - Total Federal and Nonfederal Loans in 2017 Dollars
Source: U.S. Department of Education, Federal Student Aid Data Center, Cumulative Student Loan Debt (2017 dollars) in billions, 1998 to 2015
In 2017-18, there were 7.9 million recipients of Direct Subsidized and/or Unsubsidized Loans, totaling $55.5 billion for undergraduate students and $37.6 billion for graduate students (averaging $6,570 for each undergraduate and $18,860 for each graduate student). Fewer than 290,000 students received aid through the Perkins Loan Program in 2017-18. However, the share of these federal education loans going to graduate students (who constitute about 14 percent of postsecondary students) is 40 percent ($37.6 billion out of $93.1 billion) in 2017-18. The aggregate federal student loan limit for dependent undergraduate students is $31,000. Independent students can borrow an additional $26,500 over a lifetime. Graduate and professional students can borrow up to a lifetime total of $138,500 in subsidized and
unsubsidized loans (including undergraduate loans). Additionally, they can borrow up to the full cost of attendance through the Grad PLUS program each year.
The number of parents borrowing Parent PLUS Loans in 2017-18 was only 12 percent (779,000) of the number of undergraduates borrowing Direct Loans, but the average parent loan amount was 2.5 times as much ($16,450) as the average undergraduate student loan. The Parent PLUS program allows borrowing to cover entire student budgets less other aid, and can be used for an unlimited number of years of enrollment. Parents may also borrow through home equity loans, credit cards, or other sources of credit, not reflected in traditional student loan data.
Only 6 percent of undergraduate students took out private loans in 2015-16, but 16 percent had borrowed private loans at some point during their undergraduate study. According to the National Postsecondary Student Aid Study, the average amount borrowed was $21,300. Such loans do not carry borrower protections included in the federal student loan programs. They often also have higher interest rates.
Cumulatively, the average student debt burden among those who borrowed for public and private nonprofit institutions was $28,500 in 2016-17 ($26,900 for public four-year institutions, and $32,600 for private nonprofit four-year institutions) (“Trends in Student Aid,” 2018). About 58 percent of graduates from public four-year institutions graduated with some kind of debt in 2016-17, and 61 percent of graduates of private nonprofit four-year institutions did. Students at for-profit institutions generally borrow more and accumulate higher average levels of debt than their nonprofit counterparts.
Trends in Repayment and Default
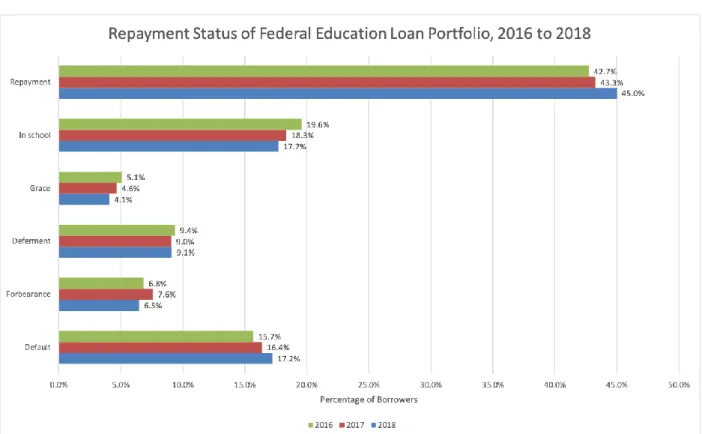
Status of outstanding federal student loans can include: in repayment, in school,
deferment, forbearance, grace period, or default. Figure 3 shows repayment status of the Federal Education Loan Portfolio, for the fourth quarter of the 2016, 2017, and 2018 fiscal years. Of the 45 percent in repayment, participation in Income-Driven Repayment (IDR) was 29 percent in
March 2018, which limits payments to an affordable percentage of an affordable percentage of their discretionary incomes. These borrowers tend to have higher average balances, however. About 47 percent of borrowers used a standard repayment plan, for a term of 10 years or less. Ten percent of borrowers used a standard repayment plan, for a term of 10 years or more, and 14 percent of borrowers participated in a graduated repayment plan (Federal Student Loan
Portfolio, 2018). Figure 3 details information regarding repayment status of borrowers, for the fourth quarter of 2016 through 2018. Table 2 displays information for 2018.
Figure 3 - Repayment Status of Federal Education Loan Portfolio, Fourth Quarter FY16-FY18
Source: U.S. Department of Education, Federal Student Aid Data Center, Federal Student Loan Portfolio
Table 2 - Average federal loan balance, number of borrowers, and total balance by repayment status, second quarter 2018
Average Balance Number of Borrowers (in
millions) Total Balance (in billions)
Repayment $34,600 18.6 $643.0 In-school $19,800 7.2 $142.5 Deferment $33,200 3.8 $126.3 Forbearance $42,600 2.8 $119.3 Grace period $19,300 1.3 $25.1 Default $18,600 7.0 $130.3
Source: U.S. Department of Education, Federal Student Aid Data Center, Federal Student Loan Portfolio
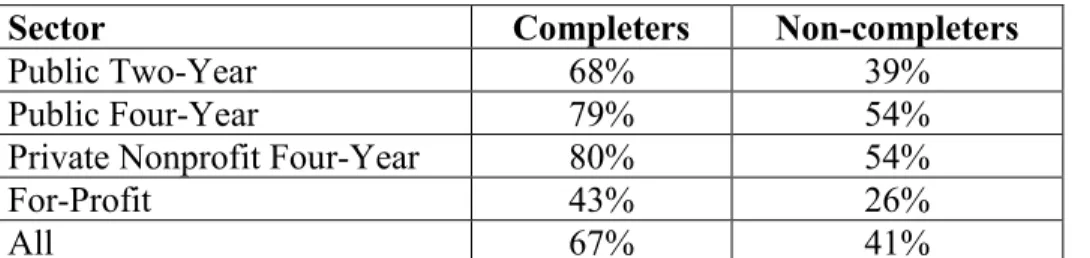
Repayment heavily relies on completion (earning a degree) and also varies by sector. For borrowers entering repayment in 2009-10 and 2010-11, 67 percent of federal student loan borrowers who graduated were in repayment within five years of graduation, while only 41 percent of non-completers were in repayment (Federal Student Loan Portfolio, 2018). Completers had higher repayment rates across all sectors. However, completers from the for-profit sector had lower repayment rates than non-completers in four-year public and nonfor-profit private sectors. Table 3 shows the rate of repayment by completion status and sector, for borrowers entering repayment in 2009-10 and 2010-11. It is important to note, however, some borrowers enrolled in Income-Driven Repayment plans pay nothing but are still considered in good standing. For others, the payment is so small it does not cover interest owed, leading to an increase in the balance owed. Borrowers in deferment or forbearance are also considered to be in good standing without actively repaying.
Table 3 - Federal student loan five-year repayment rate by completion status: Borrowers entering repayment in 2009-10 and 2010-11
Sector Completers Non-completers
Public Two-Year 68% 39%
Public Four-Year 79% 54%
Private Nonprofit Four-Year 80% 54%
For-Profit 43% 26%
All 67% 41%
Source: U.S. Department of Education, Federal Student Aid Data Center, Federal Student Loan Portfolio
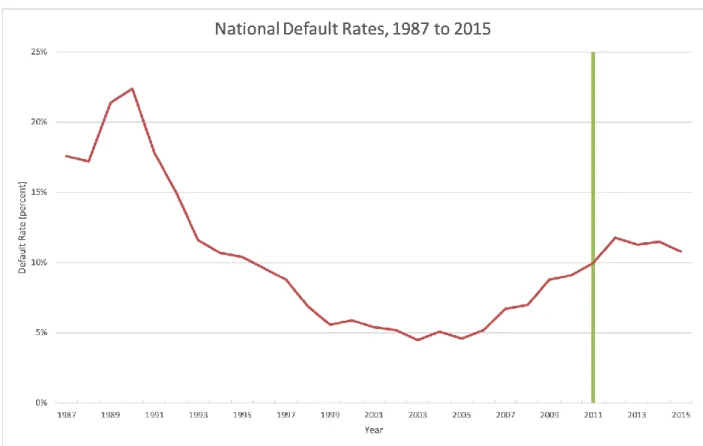
Borrowers in delinquency or default are in bad standing. Unsurprisingly, there is a positive correlation between debt amounts and default rates. This correlation is significantly present among the years the total debt burdens were the greatest. Figure 4 shows the national default rates over time. U.S. Department of Education officials attributed the steep decline in default during the early 1990s was due to an improving economy, better management of the federal loan program, as well as President Clinton’s push to cut default and increase collections (“Default Rate For Student Loans Drop,” 1998). In the early 1990s, lawmakers also made it easier to garnish wages for delinquent borrowers and prevent defaulted borrowers from taking out new loans (Perlstein, 1998). The marker at year 2011 denotes the change in measurement of default from two years to three years. Considering this change in measurement, an upward trend in default since 2005 is still visible.
Figure 4 - National Default Rates, 1987 to 2015
Source: U.S. Department of Education, Federal Student Aid Data Center, National Cohort Default Rate, 1987 to 2015
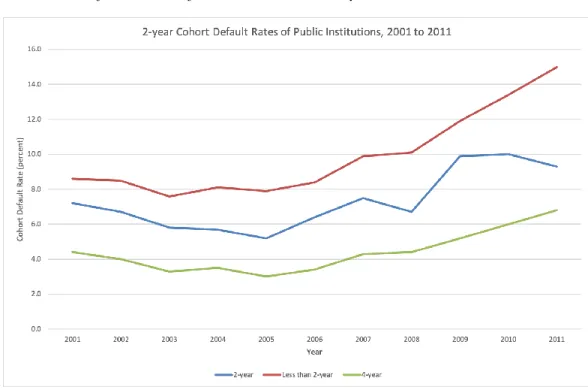
Default rates vary heavily between less than two-year, two-year, and four-year
institutions, as well as public, private nonprofit, and private for-profit institutions. Figures 5, 6, and 7 provide visual representations of the discrepancies. Highest rates are amongst less than two-year and two-year institutions, and for-profit institutions. In 2015, the total default rate for all public institutions was 10.3 percent. For private nonprofit institutions, the default rate was 7.1 percent and for private for-profit institutions, the default rate was 15.6 percent.
Figure 5 - Cohort Default Rates of Public Institutions, by Level, 2001 to 2011
Source: U.S. Department of Education, Federal Student Aid Data Center, 2-year Cohort Default Rate 2009 to 2015
Figure 6 - Cohort Default Rates of Private Nonprofit Institutions, by Level, 2001 to 2011
Source: U.S. Department of Education, Federal Student Aid Data Center, 2-year Cohort Default Rate 2009 to 2015
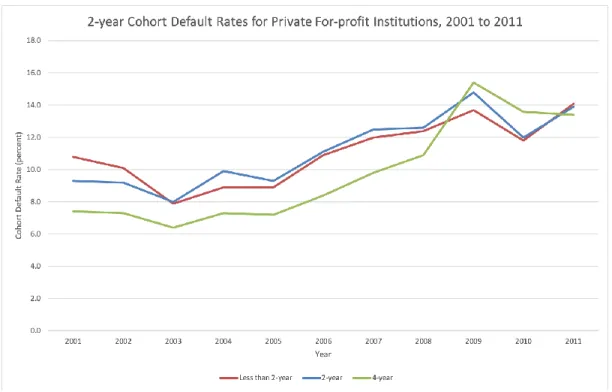
Figure 7 - Cohort Default Rates of Private For-profit Institutions, by Level, 2001 to 2011
Source: U.S. Department of Education, Federal Student Aid Data Center, 2-year Cohort Default Rate 2009 to 2015
Notice default rates at proprietary schools have fallen since 2009. At that time, rates were particularly high due to the economic recession and the peak in popularity of for-profit
institutions. Enrollment levels at private for-profit institutions peaked around 2009-10 and have since declined to levels similar to pre-recessionary time (“Digestion of Education Statistics,” 2017). Moreover, enrollment across all sectors increased during the Great Recession, but for-profit institutions saw the biggest decline in enrollment after the economy recovered.
Analysis of National Default Data
To provide more insight regarding national default rates over time and how policy has affected them, aggregated data will be examined and investigated to highlight potential trends. This analysis will be three-fold. Firstly, it will summarize the leading factors affecting default, as mentioned by the HEA. These specifically include institutional sector and minority serving
classifications. Secondly, it will evaluate which policies, if any, made impactful changes in cohort default rates. Lastly, it will measure how student loan debt levels and default influence large purchases and lifetime milestones, as to measure how the student loan market effects the economy as a whole. This will primarily be done by comparing student loan debt to house sales, birth rates, and consumption.
Factors Contributing to Default
As mentioned before, the HEA targets specific types of institutions as being more prone to higher default rates. Identifying such factors allows for policy adaptation to focus on particular problem areas. Data from the Federal Student Aid Data Center provides three-year cohort default rates by institution from 2009 to 2015. This data is merged with other identifying institutional characteristics from the National Center for Education Statistics Integrated Postsecondary Education Data System.
Variables that will be assessed explicitly include institutional sector, and whether or not the institution in question is considered a Historically Black College or University (HBCU). Data regarding other forms of minority serving institutions is not available in these datasets. HBCUs have significantly higher cohort default rates across all public and private nonprofit four- and two-year institutions. There are no less than two-year HBCUs or for-profit HBCUs. The average default rate for an HBCU in this sample is 18.0 percent, while it is 11.3 percent for all other institutions.
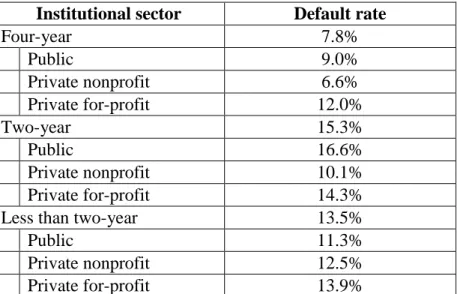
Public two-year institutions have the highest average default rate at 16.6 percent. Generally two-year and less than two-year institutions have particularly high default rates. For-profit institutions of all levels have high default rates, with the average rate being 13.7 percent. Table 4 details average three-year cohort default rates from 2015, by institution sector.
Table 4 - Average three-year cohort default rates, 2015
Institutional sector Default rate
Four-year 7.8% Public 9.0% Private nonprofit 6.6% Private for-profit 12.0% Two-year 15.3% Public 16.6% Private nonprofit 10.1% Private for-profit 14.3%
Less than two-year 13.5%
Public 11.3%
Private nonprofit 12.5%
Private for-profit 13.9%
Sources: U.S. Department of Education, Federal Student Aid Data Center, Three-year Cohort Default Rates by Institution; National Center for Education Statistics, Integrated Postsecondary Education Data System
Changes in Default Rates Over Time
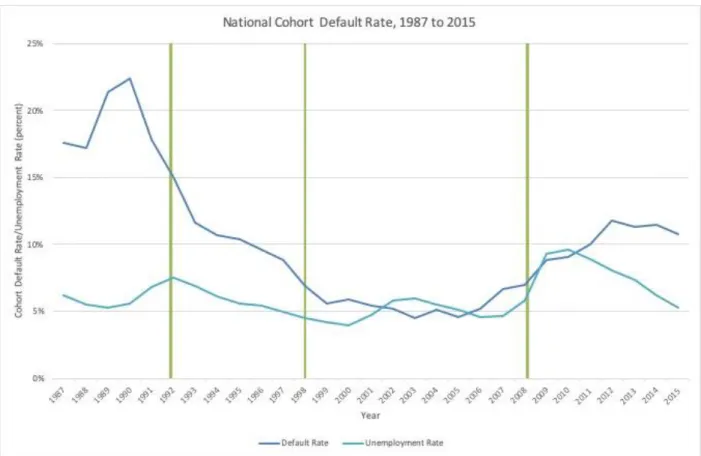
Comparing national default rates before and after each policy changes is easiest done visually, due to the nature of the limited data. The Federal Student Aid Data Center only tracks aggregated default rates long enough to be able to compare them to policy changes. Figure 8 shows national cohort default rates from 1987 to 2015, with markers denoting HEA
reauthorizations in 1992, 1998, and 2008. Additionally, due to the nature of the data, default rates before the 1986 reauthorization of the Higher Education Act is not represented. The national unemployment rate is overlaid on the same graph as a proxy for economic conditions. Negative economic conditions are heavily influential in increasing default rates, especially when people lose their jobs and their incomes decrease.
Figure 8 - National Default Rates, 1987 to 2015, by HEA Reauthorization
Sources: U.S. Department of Education, Federal Student Aid Data Center, National Cohort Default Rate; U.S. Department of Labor, Bureau of Labor Statistics, National Unemployment Rate, 1987 to 2015
The marker at year 1992 denotes the phasing in of direct lending into the federal student loan program, but did nothing to directly affect default. As mentioned before, during that time, President Clinton and Congress made it easier to garnish wages to collect payments from defaulters and the federal loan program was better managed in general. Moving forward, however, 1998 marked a significant change in student loan default policy. When individual institutions began accepting responsibility for their former students defaulting on loans, the goal was to eliminate these so-called high-risk institutions from the default equation. Evidence shows following the 1998 reauthorization, national default rates decreasing slightly, but stagnating for the most part. Evidence of the effectiveness of this policy may be seen best in the early 2000s
when economic conditions declined temporarily and unemployment rose. This may also have been related to the change in definition of default. Prior to 1998, loans were considered in default after 180 days of delinquency. When this changes to 270 days, borrowers had significantly more time to make payments before loans defaulted. This can be deceiving, because many borrowers were still more than 180 days delinquent but had not technically defaulted yet.
Little policy was able to prevent increasing national default at the start of the 2008 recession. In fact, notice default rates began to rise roughly a year before the recession officially began. Furthermore, even when economic conditions improved and unemployment decreased, default rates continued to rise. A caveat to this is the policy changes brought about by the 2008 HEA Reauthorization. At this point, the calculation time for default was changed from two to three years, allowing for borrowers who defaulted between year two and three to enter the calculations. All things held constant, mathematically it would make sense that default rates would rise. It is impossible to isolate its specific effect, however, because there were other policy changes happening concurrently. Pell grant awards increased in 2008, decreasing dependency on loans for some. Interest rates were also reduced, meaning students at the time would have less interest burden upon repayment. These borrowers would enter repayment roughly between 2010 and 2014, the latter half of this time showing a slight decrease in default rates. Capping loan repayment at 15 percent of an individual’s discretionary income logically would decrease default rates as well. Again, however, it is difficult to attribute changes to one specific policy.
Student Loan Debt Effects on Other Economic Markets
As discussed before, high student debt burdens and default deter some borrowers from having children and making major life purchases, like homes.
Purchasing a Home. High levels of debt in general make it difficult to borrow more money for
purchasing a home, and student loans tend to be the biggest share of debt to many borrowers. How student loan debt and default affect house sales in the United States is somewhat
ambiguous, because there are many other factors affecting house sales, including economic conditions and interest rates. Figure 9 compares national default rates with new and existing house sales in U.S. from 1987 to 2015. Unsurprisingly, they appear to have countercyclical effects.
The 2012 cohort of the Baccalaureate and Beyond Longitudinal Study from the National Center for Education Statistics asks respondents if they delayed buying a home as a result of financial costs for undergraduate and graduate education. This survey is comprised of roughly 19,000 participants. The 2012 follow-up surveyed individuals four years after completing a Figure 9 - National Default Rates compared to New and Existing U.S. House Sales, 1987 to 2015
Sources: U.S. Department of Education, Federal Student Aid Data Center, National Cohort Default Rate; U.S. Census Bureau, New Residential Sales Historic Data, Houses Sold, 1987 to 2015
bachelor’s degree. A one-sample t-test shows evidence (p-value ≈ 0.000) that the average response is statistically different from zero. In this sample, nearly 38 percent of respondents reported delaying buying a home. Results of all t-tests can be found in Appendix A, alongside a description of the data used to calculate them.
Implications. Lower residential house sales significantly impacts the entire economy, as made apparent during the housing crisis of 2008. According to the U.S. Bureau of Economic Analysis, residential investment averages 3-6 percent of GDP. This, however, only includes newly built homes. Even still, the National Association of Home Builders (NAHB) claims the construction of the average new home creates worker income equal to 2.97 new jobs for a year. Furthermore, the value of the U.S. housing market was $31.8 trillion in 2017, according to a Zillow Report, which is roughly 1.5 times greater than the gross domestic product (“Consumer Housing Trends,” 2017). Therefore, because of the size and importance of the housing market, there is a multiplicative negative effect on the entire U.S. economy when student loan borrowers are unable to purchase homes because of their debt.
Birth Rates. The relationship between birth rates and default is less apparent because birth rates
have been declining in recent decades consistently. Figure 10 provides a visual representation of national default rates as they are compared to birth rates. Most notably, there is a particular dip in birth rates starting in 2008 when the U.S. economy was in the Great Recession.
Just under 29 percent of respondents in the 2012 Baccalaureate and Beyond Longitudinal Study reported delaying having children due to incurred financial costs from undergraduate and graduate education. A one-sample t-test shows evidence (p-value ≈ 0.000) that the average response is statistically different from zero.
Figure 10 - National Default Rates and U.S. Birth Rates, 1987 to 2015
Sources: U.S. Department of Education, Federal Student Aid Data Center, National Cohort Default Rate; Centers for Disease Control and Prevention, U.S. Birth Rates (per 1,000 births), 1987 to 2015
Personal Consumption. Although student loan debt is a major source of financial strain for
many individuals, the Federal Reserve reports it likely has little impact on personal consumption across the nation (Fieveson et al., 2018). Not only are there several other factors contributing to consumption making it difficult to parse out the effects of student loans, but also education itself is generally associated with a positive effect on consumption growth. If anything, individuals who receive little value from their higher education are those least likely to add to consumption. Figure 11 provides a visual representation of national default rates as they are compared to annual change in personal consumption in the United States. There is some, but little, visual evidence to see how student loan default is impacting personal consumption.
Figure 11 - National Default Rates and Change in Annual Personal Consumption, 1987 to 2015
Sources: U.S. Department of Education, Federal Student Aid Data Center, National Cohort Default Rate; U.S. Bureau of Economic Analysis, Personal Income and Outlays, Personal Consumption Expenditures [PCE], retrieved from FRED, Federal Reserve Bank of St. Louis, 1987 to 2015
Other Consequences of Education Costs. The 2012 Baccalaureate and Beyond Longitudinal
Study asks other questions regarding the consequences of educational costs as well. Among respondents, roughly 29 percent reported accepting a job instead of enrolling in future education. Thirty-eight percent reported taking jobs outside their field of study as a result of financial costs from undergraduate and graduate education costs. Nearly 22 percent of respondents reported delaying marriage and 33 percent reported having worked more hours than desired due to the educational costs incurred. Results from t-tests show these averages are statistically different from zero (p-value ≈ 0.000 in all cases).
Policy Recommendations
Upon review of past and current student loan policies and their effectiveness, it is not immediately obvious why default rates have varied in the ways they have. Changes in student tuition, aid, and enrollment levels all affect debt levels, which in turn relate to default. Natural economic fluctuations are also likely associated to default. And of course, federal policies surrounding debt and default probably played some kind of role. Still today, student loan debt and default is contentious topic amongst students, parents, educators, and lawmakers alike. According to a report from the Urban Institute, upwards of 40 percent of borrowers may default on student loans by 2023 (Blagg, 2018). A report from The Brookings Institution predicts similar increases (Scott-Clayton, 2018). Student loan default is still a problem despite attempts to lessen it. The goal of this section, therefore, is to highlight potential policy recommendations and avenues for reducing defaults and the consequences of default.
Use Credit Scores to Target Riskiest Borrowers for Repayment Assistance
Federally backed student loans are not subject to an underwriting process (credit check) because these tend to exclude low-income borrowers, who generally benefit the most from loans for higher education. However, a report from the Urban Institute recommendations using credit scores to target the riskiest borrowers, not to eliminate them, but to provide them with additional loan counseling services in order to reduce default (Blagg, 2018). They also recommend using credit scores to develop new reimbursement incentives for student loan servicers. For example, servicers could receive bonuses for ensuring their high-risk borrowers are consistently enrolled in an income-driven repayment plan. Similarly, servicers could be awarded bonuses for keeping their high-risk borrowers out of default.
Allow Institutions to Set Loan Limits for Certain Borrowers
Current federal law limits annual loan amounts for the Direct Loan Program based on the academic year of the borrower and his or her enrollment status. Such policies can lead many student borrowers to take out more debt than necessary, thus increasing the likelihood of future financial struggle. This is particularly true for students enrolled in community colleges who receive Pell Grants. Often, the grants awarded is enough to cover tuition entirely, and yet some students are still offered large sums of student loans. Moreover, students can borrow the same amounts regardless of their academic programs—including ones that traditionally lead to jobs with limited salary expectations. Institutions are at risk of losing their Direct Loan and Pell Grant program eligibilities if their cohort default rate gets too high, and yet they have limited control over how much money students can borrow.
A report from the National Association of Student Financial Aid Administrators (NASFAA) recommends allowing each institution to set loan limits as they see fit. Under this proposal, institutions can impose their own lower limits for specific programs and/or categories of students. Then, if students express the desire to borrow additional federal funds, each situation will be evaluated on a case-by-case basis. Ideally, such a policy would reduce over-borrowing, decrease default rates, and provide institutions with a more efficient and appropriate use of professional judgement.
Importantly, borrowing would not be limited based on race, sex, color, religion, national origin, age, disability status, or any other protected class.
Strengthen Income-Driven Repayment Options
Income-Driven Repayment Plans are typically effective in reducing default among borrowers who have low earnings at the beginning of their repayment schedule. Capping
monthly payments at 10 or 15 percent of discretionary income reduces the likelihood of having unmanageable payments for many borrowers. The problem is, there are currently five income-driven options, creating a considerable amount of complexity and confusion among borrowers. In turn, there is constant push for greater participation in the program.
A brief from the University of Pennsylvania suggests enrolling at least some of the riskiest borrowers into income-driven repayment options automatically (Perna et al., 2018). The major downside to increasing participation in such payment plans is that it may have significant costs to taxpayers, as many enrollees pay little to nothing at times. Also, remaining loan balances can be forgiven entirely if not paid by the end of the term. Reducing default, however, would reduce costs to taxpayers. The overall effect to taxpayers is difficult to predict because of the uncertainty in forecasting rates of participation in income-driven repayment plans, overall debt levels, borrowers’ future incomes, and interest rates.
This report also suggests providing better links between student loan records and the tax system. This would reduce the complexity of the current requirement for annual verification of income for participants of the program and ensure accuracy in reported income.
Incorporate Entrance and Exit Counseling into the Department of Education’s Financial Awareness Counseling Tool (FACT)
Entrance and Exit Counseling is required for all student borrowers as mandated by law, and it must contain specific content. How institutions relay this information, however, is up to their discretion. Some institutions deliver in-person counseling, but many larger schools resort to web-based delivery because it is easier and cheaper.
In addition to entrance and exit counseling, the Department of Education offers optional Financial Awareness Counseling. This tool offers information on understanding loan types and
borrower specific loan debt levels, budget management to compare living expenses and current income, plans to repay that predict post-grad incomes and calculate monthly payments for each repayment plan, and avoiding default with postponed or reduced payments. This tool, however, is not mandatory for student loan borrowers.
An NASFAA report suggests merging entrance and exit counseling into Financial Awareness Counseling, so student borrowers are more apt to understand the complexities and responsibilities that come with federal student loans.
Implement a “Variable-Fixed” Interest Rate System Based on Market Rates
Currently, student loan interest rates are set into law so much in advance, they fail to stay in touch with current economic conditions and fiscal realities. For example, in 2012, rates for Direct Subsidized Stafford Loans were set to double from 3.4 percent to 6.8 percent, which greatly exceeded the market rate at the time. This change was set into action several years prior, however, as part of the 2007 College Cost Reduction and Access Act.
To prevent this from happening again, researchers at NASFAA suggest implementing a variable-fixed interest rate system. This means rates vary year to year, based on the total cost to the government to lend and service these loans, and then fixed for the life of the loan. Therefore, students will face interest rates comparable to market rates in the year they receive the loan. Such a policy would create a more stable and predictable interest rate. This would also ensure student borrowers are protected from exorbitant interest rates.
Create a Universal Loan Portal
Researchers at NASFAA also suggest creating some kind of universal portal for student borrowers would house information regarding all federal, private, and institutional loans. Such a portal will be a “one-stop shop” for managing student loans. Many borrowers have multiple loan