DATA MINING AND PREDICTIVE ANALYTICS APPLICATION ON CELLULAR NETWORKS TO MONITOR AND OPTIMIZE QUALITY OF SERVICE AND
CUSTOMER EXPERIENCE
by:
MUWAWA JEAN NESTOR DAHJ
submitted in accordance with the requirements for the degree of
MAGISTER TECHNOLOGIAE
In the Subject
ELECTRICAL ENGINEERING
at the
UNIVERSITY OF SOUTH AFRICA
SUPERVISOR: DR KINGSLEY A. OGUDO
SUMMARY
This research study focuses on the application models of Data Mining and Machine Learning covering cellular network traffic, in the objective to arm Mobile Network Operators with full view of performance branches (Services, Device, Subscribers). The purpose is to optimize and minimize the time to detect service and subscriber patterns behaviour. Different data mining techniques and predictive algorithms have been applied on real cellular network datasets to uncover different data usage patterns using specific Key Performance Indicators (KPIs) and Key Quality Indicators (KQI). The following tools will be used to develop the concept: R-Studio for Machine Learning and process visualization, Apache Spark, SparkSQL for data and big data processing and clicData for service Visualization. Two use cases have been studied during this research. In the first study, the process of Data and predictive Analytics are fully applied in the field of Telecommunications to efficiently address users’ experience, in the goal of increasing customer loyalty and decreasing churn or customer attrition. Using real cellular network transactions, prediction analytics are used to predict customers who are likely to churn, which can result in revenue loss. Prediction algorithms and models including Classification Tree, Random Forest, Neural Networks and Gradient boosting have been used with an exploratory Data Analysis, determining relationship between predicting variables. The data is segmented in to two, a training set to train the model and a testing set to test the model. The evaluation of the best performing model is based on the prediction accuracy, sensitivity, specificity and the Confusion Matrix on the test set. The second use case analyses Service Quality Management using modern data mining techniques and the advantages of in-memory big data processing with Apache Spark and SparkSQL to save cost on tool investment; thus, a low-cost Service Quality Management model is proposed and analyzed. With increase in Smart phone adoption, access to mobile internet services, applications such as streaming, interactive chats require a certain service level to ensure customer satisfaction. As a result, an SQM framework is developed with Service Quality Index (SQI) and Key Performance Index (KPI). The research concludes with recommendations and future studies around modern technology applications in Telecommunications including Internet of Things (IoT), Cloud and recommender systems.
DECLARATION
I declare that DATA MINING AND PREDICTIVE ANALYTICS APPLICATION ON CELLULAR NETWORKS TO MONITOR AND OPTIMIZE QUALITY OF SERVICE AND CUSTOMER EXPERIENCE is my own work and that all the sources that I have used or quoted have been indicated and acknowledged by means of complete references.
I further declare that I submitted the thesis/dissertation to originality checking software and that it falls within the accepted requirements for originality.
I further declare that I have not previously submitted this work, or part of it, for examination at Unisa for another qualification or at any other higher education institution.
________________________ November 10, 2018
COPYRIGHT CLASSIFICATION
© Copyright resides in the University of South Africa (UNISA) and Dahj Muwawa Jean Nestor. In terms of the Copyright Act 98 of 1978, no part of this material may be reproduced, stored in any retrieval system, be transmitted in any form or be published, redistributed or screened by any means (electronic, mechanical, photocopying, recording or otherwise) without prior written permission from the University of South Africa. However, permission to use any material in this work that is derived from other sources must be obtained from the original source.
DEDICATION
I dedicate this dissertation to God Almighty who gave me the inspiration, strength and intelligence to tackle this hot topic of today’s century. This dissertation is also dedicated to my Parents Tjoppen Muwawa and Isamanga Therese for their belief in me.
ACKNOWLEGDEMENTS
Firstly, I would like to thank my Supervisor Dr. Kingsley of the Electrical Engineering Department for his unlimited support and direction throughout this research; His door was always opened whenever I needed assistance. He has consistently allowed this dissertation to become my own and individual work. I thank all the academic figures and experts who have been involved in the realization and validation of these research projects.
I would also like to thank the following people:
1. My brother Muwawa Salam Smart and Sister Muwawa Mireille for their mental and spiritual support through my studies and research, without who this could not have been achieved.
2. Mss. Divine Mutombo and Karice Beghela for their encouragement and moral support through the draft of this dissertation, for always pushing me to complete my task on time.
3. UNISA for granting me the opportunity to study and all support regarding the research and publication during my study period.
4. Mr. Minerve Mampaka, my colleague and business partner with whom we have shared many research ideas around new technologies. Without whom, it would have been quite difficult to be where I am with my dissertation.
5. Mr. Bagula Patrick for his facilitation of tools and resources to help me complete this course. And everyone who in a way or another contributed to this research study, including my colleagues, friends and extended family.
ABSTRACT
Cellular networks have evolved and are still evolving, from traditional GSM (Global System for Mobile Communication) Circuit switched which only supported voice services and extremely low data rate, to LTE all Packet networks accommodating high speed data used for various service applications such as video streaming, video conferencing, heavy torrent download; and for say in a near future the roll-out of the Fifth generation (5G) cellular networks, intended to support complex technologies such as IoT (Internet of Things), High Definition video streaming and projected to cater massive amount of data. With high demand on network services and easy access to mobile phones, billions of transactions are performed by subscribers. The transactions appear in the form of SMSs, Handovers, voice calls, web browsing activities, video and audio streaming, heavy downloads and uploads. Nevertheless, the stormy growth in data traffic and the high requirements of new services introduce bigger challenges to Mobile Network Operators (NMOs) in analysing the big data traffic flowing in the network. Therefore, Quality of Service (QoS) and Quality of Experience (QoE) turn in to a challenge. Inefficiency in mining, analysing data and applying predictive intelligence on network traffic can produce high rate of unhappy customers or subscribers, loss on revenue and negative services’ perspective. Researchers and Service Providers are investing in Data mining, Machine Learning and AI (Artificial Intelligence) methods to manage services and experience. This research study focuses on the application models of Data Mining and Machine Learning covering network traffic, in the objective to arm Mobile Network Operators with full view of performance branches (Services, Device, Subscribers). The purpose is to optimize and minimize the time to detect service and subscriber patterns behaviour. Different data mining techniques and predictive algorithms will be applied on cellular network datasets to uncover different data usage patterns using specific Key Performance Indicators (KPIs) and Key Quality Indicators (KQI). The following tools will be used to develop the concept: R-Studio for Machine Learning, Apache Spark, SparkSQL for data processing and clicData for Visualization.
KEY TERMS
Data Mining; Predictive Analytics; Big Data; Quality of Service (QoS); Customer Experience; Business Intelligence (BI); Network Churn; Key Quality Index (KQI); Key Performance Index (KPI); Service Quality Management (SQM); Neural Network (NN); Deep Learning (DL); Random Forest (RF); Classification Tree; Regression; In-memory Data processing; Data Science.
LIST OF PUBLICATIONS
1. D. M. J. Nestor and K. A. Ogudo, "Practical Implementation of Machine Learning and Predictive Analytics in Cellular Network Transactions in Real Time," 2018 International Conference on Advances in Big Data, Computing and Data Communication Systems (icABCD), Durban, 2018, pp. 1-10.
https://ieeexplore.ieee.org/document/8465476
2. K. A. Ogudo and D. M. J. Nestor, "Modeling of an Efficient Low Cost, Tree Based Data Service Quality Management for Mobile Operators Using in-Memory Big Data Processing and Business Intelligence use Cases," 2018 International Conference on Advances in Big Data, Computing and Data Communication Systems (icABCD), Durban, 2018, pp. 1-8.
https://ieeexplore.ieee.org/document/8465410
3. D.M.J Nestor and K.A. Ogudo, “Geo and Graph Analytics for Dynamic Cellular Transactions Insights, Improving Quality of Service and Business Decisions: Quality X Map”. Submitted to International Conference on Intelligent and Innovative Computing Applications (ICONIC 2018), Plaine Magnien, Mauritius, December 6-7. 2018
LIST OF ABBREVIATIONS
AI Artificial Intelligence
BI Business Intelligence
BPM Business Performance Management
BSC Base Station Controller
BTS Base Transceiver Station
CDR Call Data Records
CEM Customer Experience Management
CRISP-DM Cross-industry standard process for data mining
CRM Customer Relationship Management
CS Circuit-Switch
CSP Communication Service Provider
DNS Domain Name Server
ETSI European Telecommunications Standards Institute
FTP File Transfer Protocol
GGSN Gateway GPRS Support Node
GSM Global System for Mobile Communication
IEEE Institute of Electrical and Electronics Engineers
IoT Internet of Things
ITU International Telecommunication Union
KPI Key Performance Indicator
KPI Key Performance Indicator
KQI Key Quality Indicator
MSC Mobile Switching Center
PS Packet-Switch
QoE Quality of Experience
QoS Quality of Service
RAN Radio Access Network
RDBMS Relational Database Management System
RNC Radio Network Controller
ROC Receiving Operating Characteristics
RTT Round Trip Time
SGSN Serving GPRS Support Node
SQI Service Quality Index/Indicator
SQL Structured Query Language
SQM Service Quality Management
TCP Transmission Control Protocol
UE User Equipment
TABLE OF CONTENTS
SUMMARY ... 1 DECLARATION... 2 COPYRIGHT CLASSIFICATION... 3 DEDICATION... 4 ACKNOWLEGDEMENTS ... 5 ABSTRACT ... 6 KEY TERMS ... 7 LIST OF PUBLICATIONS ... 8 LIST OF ABBREVIATIONS ... 9CHAPTER 1. INTRODUCTION AND BACKGROUND ... 16
1.1. Context of the Study ... 17
1.2. Conceptual Background ... 19
1.2.1. Why Quality of Service (QoS)? ... 19
1.2.2. Why Data Science and Predictive Analytics? ... 20
1.2.3. Big Data in the Picture ... 21
1.2.4. Why Business Intelligence? ... 23
1.3. Global Requirements ... 24
1.3.1. Hardware Requirements ... 24
1.3.2. Software Requirements ... 24
CHAPTER 2. LITERATURE REVIEW ... 26
2.1. QoS Concept Overview ... 26
2.1.1. Quality of Service Overview ... 26
2.1.2. QoS Monitoring Literature Review ... 28
2.1.3. Scope of the above QoS Review ... 32
2.2. Data Mining and Predictive Analytics Review ... 33
2.2.1. Big Data Review ... 36
2.2.2. Prediction Algorithms Review ... 46
2.2.3. Business Intelligence ... 54
2.3. Related Works ... 57
2.4. Problem Statement ... 59
CHAPTER 3. STUDY FRAMEWORK ... 61
3.1. Research Objectives and Aims ... 63
3.1.1. Main Objective ... 63
3.1.2. Specific objectives ... 64
3.3. Benefits of the Study ... 65
3.4. Delimitation of the Study ... 66
3.4.1. In Scope Topics... 66
3.4.2. Out of Scope Topics ... 67
CHAPTER 4. THEORITICAL AND MATHEMATICAL BACKGROUND ... 69
4.1. Understanding the Model Approach ... 71
4.2. Understanding the SQI and KPIs Approach ... 73
4.2.1. The KPI Approach ... 73
4.2.2. The SQI Model Approach ... 75
4.3. Prediction Algorithms Used ... 76
4.3.1. Classification and Decision Tree ... 76
4.3.2. Gradient Boosting ... 78
4.3.3. Random Forest ... 79
4.3.4. Neural Networks ... 81
CHAPTER 5. METHODOLOGY... 84
5.1. Predicting Churn, Practical Machine Learning for Telecoms CS Transactions, Use Case 1. ... 84
5.2. Low Cost Data Service Quality Management: Methodology ... 86
CHAPTER 6. RESULTS AND DISCUSSION ... 88
6.1. Churn Prediction Analytics Using CRM Data in Real Time ... 88
6.1.1. Problem Definition and Objectives... 88
6.1.2. Data Collection and Pre-processing ... 89
6.1.3. Exploratory Data Analysis ... 96
6.1.4. Machine Learning and Training ... 101
6.1.5. Models’ Evaluation ... 111
6.1.6. Predicting on the new Dataset and ROC Curves ... 112
6.2. Low Cost SQM Tree Model Implementation ... 122
6.2.1. Data Collection, Preparation and Pre-processing ... 122
6.2.2. Data Caching, Processing and Adaptation ... 123
6.2.3. Visualization of the Output Results ... 124
CHAPTER 7. CONCLUSION... 130
7.1. Conclusion ... 130
7.2. Recommendations and Future Studies ... 132
7.2.1. QoS Data Prediction and Unification ... 132
7.2.2. Recommender Systems, Service and Customer Auto-Profiling ... 132
7.2.3. IoT and Device Performance Analytics ... 133
TABLE OF FIGURES
Figure 1 Smartphone Adoption in South-Africa 2014-2022 by Statista ... 22
Figure 2 The 3 Vs of Big Data Characteristics ... 23
Figure 3 Business Intelligence Basic Concept ... 24
Figure 4 Conceptual Architecture of QoS as studied by David Soldani et al. ... 29
Figure 5 Conceptual Architecture with Data post-processing ... 29
Figure 6 The Cross-Industry Standard Process for Data mining: CRISP-DM (Chapman & Al, 2000) 35 Figure 7 Hadoop Physical Architecture ... 37
Figure 8 MapReduce Task Overview ... 39
Figure 9 Apache Spark Supported Libraries ... 41
Figure 10 Scope of Application of SparkSQL Library ... 42
Figure 11 Customer calls Graph processing Illustration ... 43
Figure 12 Scale of the Number of users using Semi Clustering (S.A. Jacob, 2016) ... 45
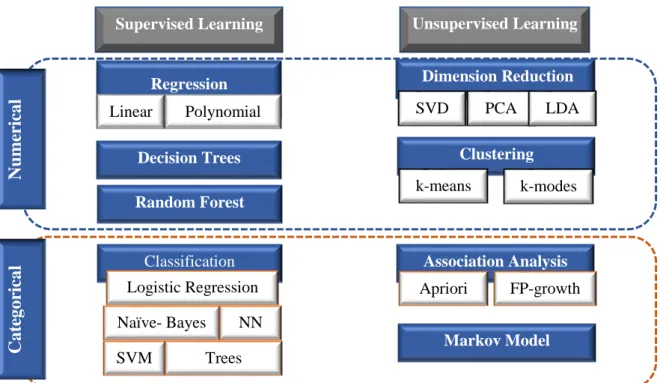
Figure 13 Popular Predictive Algorithms' Summary ... 46
Figure 14 The plotted best mean of the Galton dataset (Brian Caffo, 2015) ... 48
Figure 15 Plot of the Galton dataset as by Caffo (Brian Caffo, 2015) ... 48
Figure 16 Plot of Children vs. Parents Heights as illustrated by Caffo (Brian Caffo, 2015) ... 48
Figure 17 Francis Galton Genetic Dataset for Regression (Francis Galton, 19th, Century) ... 49
Figure 18 Deviation, Coherence & Precision of Galton's Regression Experiment (Francis Galton, 19th, Century) ... 50
Figure 19 Illustration of a simple, 1-layer Neural Network ... 51
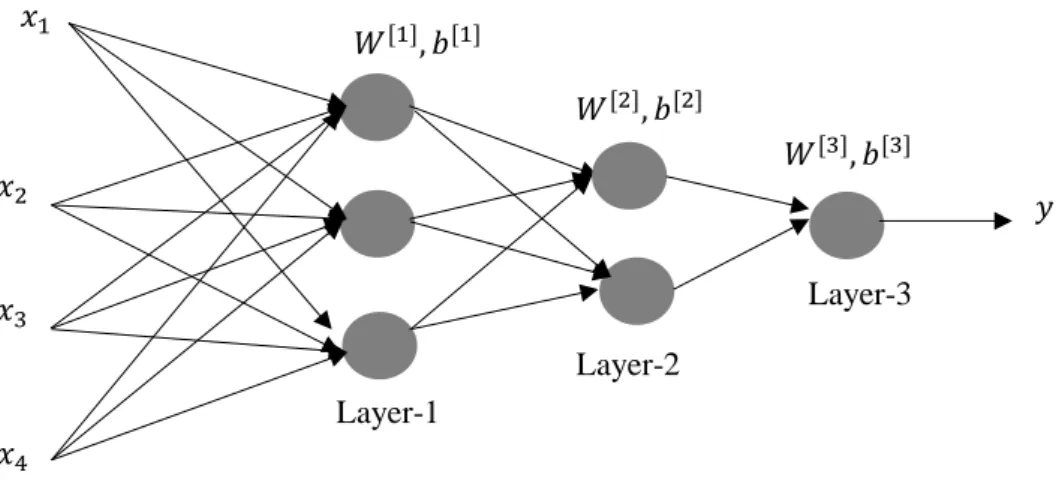
Figure 20 Illustration of a 3-Layer Neural Networks... 52
Figure 21 Creating Deep Belief Network by Using 3 RBMs (Y. Hua, 2015) ... 53
Figure 22 Illustration of Simulation for Handwriting Recognition Study using Deep Network (Y. Hua, 2015) ... 53
Figure 23 Business Performance Management Framework as presented by Yu Shin and X. Lu (Yan Shi, 2010) ... 55
Figure 24 Characteristics of Business Intelligence as studied by Tong Gang et al. (Tong Gang, 2008). ... 56
Figure 25 Key technology of Business Intelligence as shown by Tong Gang et al. (Tong Gang, 2008) ... 56
Figure 26 Currently existing Data Mining Framework views ... 62
Figure 28 SQM Service Application Tree Model ... 71
Figure 29 SQM Aggregation Model ... 72
Figure 30 Illustration of Network Latency ... 74
Figure 31 Example of Decision Tree Algorithm ... 77
Figure 32 Methodology and Design for Churn Prediction ... 85
Figure 33 Low Cost In-House SQM System Architecture ... 86
Figure 34 Low-Cost SQM Design Methodology ... 87
Figure 35 CRM Analytics Creed Illustration ... 89
Figure 36 Internal Structure of the Training Set ... 92
Figure 37 Computation of Data Chraracteristics ... 93
Figure 38 Histogram of SMS counts to check outliers ... 94
Figure 39 Histogram of Calls to Check Outliers ... 94
Figure 40 Data Plot for Outlier verification Revenue Data ... 95
Figure 41 Data Plot for Outlier Check on Durations and Chargeable Units ... 96
Figure 42 Subscriber Churn by International Plan Subscription ... 97
Figure 43 Data Relationship between Categorical Variables and the predictor variable ... 99
Figure 44 Exploratory Data Analysis for Numerical Variables ... 100
Figure 45 Related Decision Tree Model for the Classification Learning ... 103
Figure 46 Classification Model Predictors Importance ... 104
Figure 47 Random Forest Model's Predictor Importance ... 108
Figure 48 Neural Network Mode Fit with 3 Hidden Layer ... 109
Figure 49 Model Performance Comparison ... 112
Figure 50 Neural Network Model Real values vs. Pred. Values ... 117
Figure 51 ROC Curve for the 3 Regression-based model... 119
Figure 52 Number of Churners per Region ... 120
Figure 53 Number of Predicted Churners by Service Line ... 121
Figure 54 SQM Model Layer 1 Use Case Illustration ... 125
Figure 55 SQM Model Layer 2 Use case Illustration ... 127
Figure 56 SQM Model Layer 3 Use Case Illustration ... 128
Figure 57 SQM Model Layer 4: Use Case Illustration ... 129
TABLES
Table 1 QoS Service Class ... 27
Table 2 Illustration of Data Mining Tasks ... 34
Table 3 Comparison between Longitudinal & Lateral Regression models (X. Feng, 2017) ... 50
Table 4 Machine Learning Research Study for video QoE (M.T. Vega, 2018) ... 57
Table 5 Challenges Related to Wireless Channels and Devices (H. Luo, 2011) ... 58
Table 6 KPI Aggregation Model ... 75
Table 7 Variable Predictors for Churn Prediction Analytics (CRM data) ... 90
Table 8 Dimension of training and testing datasets ... 101
Table 9 Confusion Matrix of The Study ... 113
Table 10 Performance Metrics Selected for the Data SQM ... 122
Table 11 Categorical Aggregation Metrics for the SQM system ... 123
CHAPTER 1.
INTRODUCTION AND BACKGROUND
To protect and keep a stable business revenue stream, Network Mobile Operators need to strive for perfection on network quality with reduced or no customer affecting subjects, using effective techniques. Thus, ensuring a very good reference of customer satisfaction by putting a big accent on Quality, be it of Service, Experience, Device or Network (QoX). With Big transactions’ Data generated by users on daily basis, and with the projection on number of devices to be connected soon, Network Operators need transformation in their business models. Communication Service Providers (CSP) focus on different behavioural patterns in network traffic to pinpoint opportunities of service improvement and predict the likelihood of customers to terminate their contracts or/and move to a competitor [1]. CSPs have indeed managed to shape robust IT platforms which efficiently store subscriber transactions and any other traffic originated from devices and customers. Illustrations of such platforms include the Customer Relationship Management (CRM), Billing systems, Intelligent Network systems and so on. With the current rate of data application usage such as WhatsApp, Skype, Instagram and other Over-The-Top (OTT) applications, on top of the traditional voice services, CSPs clearly highlight the need for business model adjustment. Coupled with the increasing adoption of Smartphones and other smart devices, more network resources need to be added and undoubtedly more human technical expertise, to manipulate the humongous transactional data that will be generated; All in the road to maintaining good quality of service and experience.
Also, the more CSPs focus on QoS, the complex the entire business process becomes due to the exponential growth in connected devices. The coming of 5G, which will bring a more flexible architecture to the current Cellular Network architecture, aims to address challenges to come, IoT, Machine Type Communications, Virtualization. A study by Ericsson shows a projection of approximately 50 Billion devices to be connected by 2020 [2]; The question now is not to provide technological IoT platforms only, but to also develop intelligent mechanisms to draw values out the Big Data generated by the connected devices. Hence, the need to bring forth Data Mining and Predictive Analytics in Telecommunications.
Positioned at the crossroad of Statistics, Machine Learning and Computer Science, Data mining brings more value to the Analytics process by exploring the different traffic patterns that can guide in improving business decisions. Another essential facet of telecommunications data analytics is the visual portrayal of the outcome, which opens another hole of research on efficient data visualization and representation. For instance, after exploring traffic patterns on
analysed transactions, the result needs to be portrayed in such a way that everyone in the Organization needs to understand the significance of each report or dashboard to simplify decision making; So, choosing the best way to present the analysis result to the end users is as important as mining the data itself. Organizations need to move in the direction of Business Intelligence (BI) systems to explore and represent in a flexible manner, the insight of processed large datasets. The dynamic depiction of data generated by humans and machines, involves an analytics methodology and mathematical models for information and knowledge retrieval processes to support easy and extremely complex business decisions [3]. This research study presents a practical, simplistic and efficient system models to support various decisions in the Telecommunications Environment.
1.1.
Context of the Study
Millions of people today own Mobile devices for calling or intensively using internet services and they generate huge amount of transactions in Mobile Networks every day if not every hour. With the expansion of IoT (Internet of Things) and Machine to Machine Communication (MTC), even more resource intensive transactions are passed through the Mobile Networks. Those transactions are all stored in complex storage systems in the form of structured data systems such as Customer Relationship Management (CRM), storing customer related information and unstructured data system storing pictures, videos and pure voice traffic [4]. Despite the complex IT infrastructures put in place, one of the pain points of Communication Service Providers (CSP) is to ensure very good quality of service for all the users. By good Service Quality, we call high number of satisfied customers and low rate of attrition or contract terminations. The scope of this research study involves two very important aspects of science and technology, highly on demand today.
In one aspect, the notion of QoS and QoE improvement in the Mobile Network environment is tackled through an SQM (service Quality Management) model, an area in which international organizations such as the Institute of Electrical and Electronics Engineers (IEEE), the International Telecommunication Union (ITU), the European Telecommunications Standard Institute (ETSI) and others including the 3rd Generation Partnership Project (3GPP), the Multimedia Communication Forum are spending comprehensive research time to provide the required basic Standards to govern QoS and QoE in Network environment.
The second aspect of the study brings the concept of applied Data Science and Predictive measures to efficiently improve the first concept. The hikes of Big Data Analytics, Artificial Intelligence (AI) and Predictive Machine Learning do not exempt the Telecommunications environment, instead, become critical components of the environment to improve customer experience and service experience. In this research, we explore a basic hierarchical tree model, leaning on Big Data Analytics, Predictive Analytics using some of the popular algorithms such as Regression, Random Forest, Boosting Tree, Neural Networks and Deep Learning (NN) and Business Intelligent (BI) methodology to methodically output the result of the model, in the aim to give Communication Service Providers (CSPs) a skeletal framework to apply all the mentioned technologies in their business environments. Two practical case studies are explored in this dissertation to go along with the theoretical background:
• A practical approach in the application of Machine Learning in Telecommunications Network transactions, using different algorithms. In this case study, transaction information from the CRM system is collected and analysed to find useful patterns and presented for decision support process. The use case addresses one of the hottest topics of any CSP: the prediction of customers that could churn (terminate their contract with one CSP). This will assist CSPs to protect customers [1].
• A low-cost model is explored for an efficient Service Quality Management system based on internet Data traffic. Using a tree model in this case, a navigational Analysis is performed on Network data of popular application services such as Interactive services, Streaming Services and Background Services [5].
In the context of this research study, we leverage on existing systems and platforms, providing a more practical methodology, facilitating the research reproducibility. We involve Big Data Analytics with in-memory data processing to increase the speed of data retrieval and discuss the concept for real time application analysis.
1.2.
Conceptual Background
In comparison to the Second Generation and the third Generation of Cellular Mobile Network (2G and 3G respectively), the Fourth Generation has given the users (customers) the freedom to maximize data usage by intensively using resource demanding applications such as video and audio streaming, video-conferencing and other real time applications. Nevertheless, with more high demanding traffic increasing, Quality of Service (QoS) and Quality of Experience (QoE) are affected. The high use of data related services by Mobile users is an indication for CSPs to shift the business towards Packet data. With high usage of Over-The-Top (OTT) services, Data quality becomes a key parameter for customer satisfaction. In association to the high usage of services, is the current adoption of Smart devices. More devices, more services used, more data generated, more technical expertise required to manage Network Quality. For the reason elaborated above, Communication Service Providers (CSPs) appear to be investing heavily on expensive Customer Experience and Service Quality platforms to remain competitive in the market. The lofty investment is backed-up by the integration and deployment of new technologies including but not limited to Big Data, Real Time Data Processing Solutions, Machine Learning, Predictive Analytics, Business Intelligence and Smart visualization platforms. Be that as it may, the Return on Investment (ROI) of such expensive and explosive QoS/QoE systems is not as evident as the functionalities and integrated business rules.
In this research study, two important conceptual studies are addressed based on the concept illustrated in the above paragraph, to give CSPs a basic framework to transformation of CSPs business.
• Provide a Practical Approach of Predictive Analytics in the Telecommunication environment.
• Model of low-cost Service Quality Management System, tackling cost reduction.
1.2.1. Why Quality of Service (QoS)?
The use of Cellular Mobile devices has become an important factor in human life as they are becoming more and more human companions. Massive use of mobile internet on social media, video streaming and other protocol applications is attracting everyone to have a mobile phone. Mobile phones use SIM cards which are the main chip, provided by Mobile Network Operators
(MNOs) to access different network services. Ensuring and anticipating user’s Quality of Service needs, is the factor that draw the line between service providers and their competitions. The framework proposed by the ITU for QoS is based on a 3x3 Matrix, using speed, accuracy, and dependability as parameters. These parameters are then used to evaluate the quality with which the basic user functions of connection set-up, user information transfer, and connection release are executed. By following closely and efficiently the requirements of the framework for telecommunications services, CSPs should have the user quality of experience facilitated [6].
The quality of a service is a great separator in the Mobile business market. Its parameters and measures are very critical in providing indication of how well a specific service is or behaves, and therefore, it becomes an important selector of offered services by different service providers. In the case of equal service billing and features, quality becomes the differentiator for network users, as well as, service providers can make use of quality to have an image of a “respected” provider [7]. Today mobile users are switching from one operator to the other due to poor services complaining about poor internet speed, not being able to watch YouTube, unable to live stream soccer game on the smart phones. And this is because Quality of Service is not looked at efficiently.
1.2.2. Why Data Science and Predictive Analytics?
Data mining and prediction Analytics fields are attracting increasing interest from scientists and technologists who want to solve real-life problems. Data mining refers to the science of finding useful information or patterns in a dataset stored in different ways, structured or unstructured. In processes of Data Mining, the point of interest is not very specified at priori and often the data is searched by Analytics. The concept of “useful information” in data mining depends on the context of the domain in which the science is applied and different objectives that are set. The aspects of mining in different protocols layers are distinguished in two ways as shown by Azzalini et al. [4] :
• Global behaviour of the phenomenon examined in the data. The objective in this case is to construct a global model, taken from the available data.
• Characterization of details or the pattern structure of the data. In this case the interest is outside the standard behaviour. It means the point of interest when analysing pattern
structure in data is exterior to the standard behaviour of data. The objective is to identify various variances in the structure instead of looking at the standard known behaviours.
Cellular Network traffic is collected, examined and analysed in different layers to identify trends that allows the Communication Service Provider (CSP) to forecast customers’ behaviour or experience according to their data usage, voice calls, geographical positions and other elements, reducing the gap between the customers and the Service provider. The subject on importance of Data Mining and Predictive Analytics is clarified in the statements of D.J Hand [8] in which Data mining is presented as an applied discipline, requiring a wide span of knowledge to understand both statistical and computational issues. Predictive Analytics is practically the new way to improve customer experience by studying their behaviours.
One of the challenges of Service Providers have always been to know what customers exactly want, which give competitive advantage and increase customer loyalty. Different customers have different needs and different perception of the same services. Data Mining and Predictive Analytics allows customer’s customization of needs, moving the business towards a customer-centric services as described by J. Betser [9], a system in which customer preference plays the crucial role. Several methods are used from simple classification and categorization algorithms to more complex forecasting and deep learning algorithms through which customers are clustered in line with their service interest, service usage leaning on their past service usage patterns.
Associating Data Mining and Predictive Analytics to the Telecommunications Environment provides to the CSPs (Customer Service Providers) a glimpse of what to invest on in the future. For example, by analysing YouTube, ShowMax, Netflix, Black application usage across the country in the past, a CSP can predict the group of customers or regions which is likely to adopt a new video-streaming or content provider service. This will help the CSP to target the correct market, tailor the service to suit the targeted group of customers.
1.2.3. Big Data in the Picture
Activities or transactions done by the users in a Cellular Network can be structured or unstructured, they can have different natures as some users may focus on browsing only, others on video-streaming, others on audio-streaming and pictures. With the high adoption of Smartphones in the last decade and a projected increase in number in the future, billions of
transactions are being generated by the users in the Network in terms of voice calls and internet usage. The figure below shows the adoption of Smartphones in South Africa from 2014 to 2022 as published by [10]. Depending on the applications and the service type of the CSPs, data retrieval speed is very capital in building business decision models.
Figure 1 Smartphone Adoption in South-Africa 2014-2022 by Statista
Imagining a query which takes more than 5 minutes to run in the system database to retrieve information could be a big nightmare for a CSP because it can delay the business process; the heterogeneousity, the amount of transactions generated by the customers and the fast requirement to retrieve information already characterized Big Data’s three Vs (Variety, Volume and Velocity). In this study, different Big Data Solutions are looked at and one of them is applied along with some traditional data manipulation algorithms.
1.2.4. Why Business Intelligence?
Data Analytics facilitates Data manipulation and pattern analysis. But one of the biggest concerns has been how to represent the results of Analysis in an efficient and understanding way to ease the decision-making process. Through Business Intelligence, the presentation of relevant dashboards and reports as described by [11] is used to convert or transform data into actionable information. Through BI systems, productivity is improved, saving time to take decisions. In the Telecommunications arena, the concept “performance” (Quality) is defined by several Key Performance Indicators (KPI) which defines the metric used to measure the performance. Going beyond the scope of KPIs, BI systems also introduce the concept of smart visualizations such as Scorecards and complex dashboards. Figure 3 illustrates the basic concept of BI which is also used in this study.
Volume • Amount of Data • In the order of 100s of Gigabytes. Velocity • Retrieval speed
• Real time applications
Variety • Data Diversity
• Video, pictures, texts, binaries.
• Data stored in different file format
Figure 2 The 3 Vs of Big Data Characteristics
KPI
Scorecards
Dashboards
Drilldown Mechanism
Measurement units: Metrics
Aggregation of metrics (KPIs): determine a performance index
Information window. Combination of multiple report cases
More details on Analytics results: Navigation
The Business Intelligence also introduces the concept of drilldown or navigation from one dashboard or report to another in the objective to get more details which can support the decision-making process. The Cellular Network is made of different interfaces and protocols. Defining the Quality of Service is not as straight forward as it seems because customer transactions can have different identities in different interfaces of the Network. Therefore, when doing Analytics on Cellular transactions it is important to define the interface at which the Analytics is done, facilitating the representation of data. In this Study, we have also introduced the concept of SQI (Service Quality Index) along with the rest of the BI components.
1.3.
Global Requirements
1.3.1. Hardware Requirements
To conduct the research study in the area proposed, a list of requirements on the Hardware and operating system software has been put in place. All the use cases built in the scope of the research requires high computational power. The Hardware used for all the use cases is at minimum as follow (high performing PC):
• Processor Intel® Core i7-5500U 2.4GHz boost up to 3.0 GHz • NVIDIA 920M with 2 GB Dedicated VRAM.
• RAM: 16GB DDR3 Memory • 1TB Storage Disk.
• Operating System: Windows10.
The processing power of the Hardware limits the amount of data that can be processed in memory (Data < 16 GB) and stored in the disk (Data < 1TB).
1.3.2. Software Requirements
In order to build an efficient low-cost Data Analysis and predictive models, a good knowledge on Data Mining platforms and programming languages are required. In the same line as section
1.3.1, a list of Software is also stipulated in this section to work on the experiment. The following list of software is used during the research for Data manipulation and processing:
• MySQL: For data manipulation based on the popular traditional Sequence Query Language.
• R & R-Studio: a modern platform for Data Analysis based on the R-Project team. The R platform is a solid Open-Source platform for Data Analysis and statistics. It is based on the R language [12].
• Apache-Spark: with the growth of data in the Network and high usage of Mobile phones, the ideal way to process or mine data is by exploring the advantages of distributed computing architecture such as Apache Spark and explore the in-memory capability of the system [13].
• ClicData BI tool: Data representation is one of the key aspect of Data Analysis, including Telecommunications Data Analysis. This is because the end result is what is used for business decisions. For this research, a low-cost BI tool is used to represent data graphically and allows navigation from one layer to another.
CHAPTER 2.
LITERATURE REVIEW
QoS as a concept, in Telecommunications is reviewed and defined by many researchers and boards of standards such as the ITU, IEEE… And researchers have also applied many models and algorithms to address QoS in different network domains. QoS is described as the degree of satisfaction of a service usage during a given communication session. Consistently monitoring and improving the QoS is the point that distinguishes successful communications service and network operators from their competitors [6]. When talking about QoS, the parameter traffic Class needs to be taken into consideration. The QoS mechanisms provided in the Cellular Network must be efficient with reasonable resolution. Depending on the way latency is handled, four QoS classes are described: Streaming, Conversational, Background and Interactive classes. The provision of QoS for data applications in a cellular network imposes a series of challenges because of the unreliable wireless channels and the mobility of mobile devices [14]. The measurement of QoS is based on parameters like delay, jitter, packet loss, throughput and many others, depending on the application and management scheme [7].
2.1.
QoS Concept Overview
2.1.1. Quality of Service Overview
End user experience satisfaction is the main objective of QoS from a Communication Service Provider perspective. Service requirements can differ from one service to another, depending on the type, the nature and the amount of Network resources utilized by the service in question. A typical illustration is listening to music online and sending a mail to a friend. In terms of basic requirements, it can be stated that listening to music on the internet is very sensitive to delay then sending a mail to a friend. However, sending an email requires a high reliability then internet audio streaming. This shows that different services yield different quality requirements, which a certain category tolerating delays and others not. Another illustration would be tolerance to error. Certain services do not tolerate error in transmission (packet loss for example); a service application such as File transfer could have no meaning to the destination if there are errors in the transmission or loss of packets. In this case, there could be a need to retransmit packets to ensure that integrity of the file is maintained. R. Rodriguez et al. identify the above overview of QoS as the starting point for several developments and
researches, leading to the setting up of mechanisms and protocols to differentiate service requirements [15].
R. Rodriguez et al. in their book section classify the QoS in two, quantitative QoS and qualitative QoS depending on the methodology followed by the CSP.
• Qualitative QoS: focuses on priority of service in the Network. for instance, based on their requirements and user experience, traffic priority could be given to YouTube streaming then e-mail, providing faster traffic flow for YouTube.
• Quantitative QoS: focuses on measuring network capabilities. It guarantees certain performance level. Metrics are specified such as latency, packet loss, and throughput as data speed. While the study of R. Rodriguez and his associates have gone deep into both Quantitative and Qualitative QoS, the scope of our study is limited to measurable metrics, thus only developing on quantitative QoS.
2.1.1.1. QoS Services Class Categorization
When addressing QoS matter in a Network, it is crucial to group services in relation to their requirements. The 3GPP defines QoS classes as shown on the below table, considering limitation of the air interface. The Network treats or should at least treat services of the same QoS requirements accordingly.
Table 1 QoS Service Class
Service Class Characteristics Applications
Conversational • Low delay.
• Preserve time variation
• Voice Call
• VoIP
Streaming • Preserve time variation Audio & Video Streaming Interactive • Request response pattern
• Preserve payload content
• Web browsing
• Instant Messaging Background • Not delay sensitive
• Preserve payload content
2.1.1.2. QoS Levels
Users being able to effectively and efficiently stream a basketball match on the phone or tablet when connecting to a 3G or 4G network is a very important link between the service user and the Network Operator who provides that service. This means, as concluded by J.D. Power, that the operator with a strong focus on QoS is likely to attract a high number of customers than others [16]. To establish a robust QoS mechanism, the needs to situate the QoS in the general model is mandatory. The QoS in the general model can be situated in three levels as detailed in the work done by W.C. Hardy on QoS measurement and evaluation [17]:
• Intrinsic QoS: related to performance. In Intrinsic QoS, the focus is on the ability of the Network to provide basic services to the end-users. Network centricity of intrinsic QoS opens the flow to more NOC (Network Operation Centre) related applications and tools.
• Perceived QoS: related to customer perception of the quality of a specific used service. Many factors influence the perceived QoS including real customer experience. This QoS is measured in a non-technical way. The Service Level Agreement is the main assessor of this kind of QoS.
• Assessed QoS: build as an umbrella of the first two QoS levels, Assessed QoS relates to the probability of users to continue using specific services. This QoS makes the main driver of QoE (Quality of Experience). The requirements are then based on tangible network metrics such as delay, packet loss, jitter, and throughput.
2.1.2. QoS Monitoring Literature Review
This section is based on the work done by David Soldani et al. on QoE and QoS monitoring [18]. In their study, the perception of subscribers on provided services is analysed in terms of 3 parameters which are:
• Integrity: related to quantitative QoS metrics such as packet loss, delay and throughput. • Accessibility: related to the availability of the service itself, the time it takes to set up
connection to the Network for that service.
The conceptual architecture of the QoS monitoring system as developed by their study, is shown in the figure 4. It is to be noted that although the entire architecture is shown, our research study focuses on one aspect of the architecture which is the Service Quality Management.
The study goes further with adding layers for data post-processing, visualization and drilldown mechanism on performance metrics used. The conceptual architecture as presented by D. Soldani, enhanced with the data processing is shown in the below Figure:
Service & QoS provisioning
Customer & QoE provisioning
Fault Management Performance Management Network Elements Network Management Layer Element Management Layer
Figure 4 Conceptual Architecture of QoS as studied by David Soldani et al.
Data Generated by Users
Analysis Visualization Post processin g Visualization Data Storage Use Cases Operation Marketing & Sales Planning & Optimization
• The Data Storage is responsible for data collection and data storage.
• The Post-processing layer is the layer with possessing the intelligence for transaction data analysis.
• The visualization layer is responsible for the displaying of the data analysis results, with drilldown capabilities. This facilitates the investigation of network issues and help identify the unsatisfactory criteria by showing metrics separately.
Network management layer addresses two big questions: SQM (Service Quality Management) which takes performance and fault data as inputs and the Customer Experience management which takes as inputs the SQM data and the user data.
• The study also proposes a framework for QoS monitoring by formulating metrics that can be used to measure services performance across different domains of the network, carrying less on the content carried by upper layers’ protocols.
• Integrity monitoring in BSS: the researchers introduce the metrics used to assess integrity of services belonging to a certain class.
o BLER (Block Error Rate) monitoring: to determine how successful transmission is over the physical layer, which is nothing else than the ratio between the blocks of data with error over the total number of blocks sent over a transmission line. This is given by:
𝐵𝐿𝐸𝑅
𝑝= 1 −
∑
𝑁
𝐶𝑜𝑟𝑟𝑒𝑐𝑡𝑅𝑥𝑅𝐿𝐶𝑏𝑙𝑜𝑐𝑘𝑠,𝑖𝑃 𝑀𝐶𝑆−9 𝑖=1
∑
𝑀𝐶𝑆−9𝑖=1𝑁
𝑇𝑜𝑡𝑎𝑙𝑇𝑥𝑅𝐿𝐶𝑏𝑙𝑜𝑐𝑘𝑠, 𝑖𝑃Where 𝑁𝐶𝑜𝑟𝑟𝑒𝑐𝑡𝑅𝑥𝑅𝐿𝐶𝑏𝑙𝑜𝑐𝑘𝑠 is the blocks of data correctly received over the transmission line and the 𝑁𝑇𝑜𝑡𝑎𝑙𝑇𝑥𝑅𝐿𝐶𝑏𝑙𝑜𝑐𝑘𝑠 is the total number of blocks of data sent over the transmission line for the used encoding techniques (MCS 1 to MCS 9) and 𝑝 is related to the QoS Class.
o Throughput: popularly known as number of bits delivered per seconds. This given by: 𝑏𝑝 = ∑ ∑ 𝑟𝑘𝐵𝑖 𝑝,𝑘 𝑁 𝑖=1 𝑀𝐶𝑆−9 𝑘=𝐶𝑆−1 (2.1.2.2) (2.1.2.1)
Where 𝑏𝑝 represents the total bits delivered correctly over the transmission line which is the parameter of interest in the computation of the throughput. And the time taken to deliver 𝑏𝑝 , 𝐷𝑝is given by:
𝐷𝑝 = ∑ 𝑑 𝑖 𝑝 𝑁
𝑖=1
The average throughput per user, is then given by the ratio (2.1.2.2) over (2.1.2.3):
𝑡
𝑝=
𝑏
𝑝
𝐷
𝑝• Integrity monitoring in RAN [18]: introduces the metrics used to assess integrity of services belonging to a certain class now in a more advanced network, the 3G.
o BLER monitoring in the downlink:
𝐵𝐿𝐸𝑅𝑚 = ∑ 𝐵̅𝑖 𝑚 𝑁 𝑖=1
∑𝑁𝑖=1(𝐵𝑖𝑚+ 𝐵̅𝑖𝑚)
Based on the formula definition of Block Error Rate, we can deduce that 𝐵̅𝑖𝑚 is related to the block of data unsuccessfully delivered over the transmission line and 𝐵𝑖𝑚 is related to the block of data successfully delivered to the destination over the same transmission line.
o Throughput: the throughput in the RAN (Radio Access Network) takes into consideration the correctly transmitted bits over a certain period. This is an important (the throughput) QoS metric to assess the quality of experience (QoE) of customers [19]. The throughput 𝑡𝑚 is given by, as unit of bits over time:
𝑡
𝑚=
∑
∑
𝑟
𝑘𝐵
𝑖 𝑚,𝑘 𝐶 𝑘=1 𝑁 𝑖=1∑
𝑁𝑖=1𝑑
𝑖𝑚 (2.1.2.3) (2.1.2.4) (2.1.2.5) (2.1.2.6)• Integrity monitoring in Core: the study done by Soldani et al. also introduce the metrics used for integrity in the Packet Core domain, which will be the main area of interest of our research study herein.
o Throughput: The throughput is given on the downlink and uplink as follow:
𝐴𝑣𝑒𝑈𝐿. 𝐴𝑃𝑁 = 𝐺𝑇𝑃𝐵𝑦𝑡𝑒𝑠𝑆𝑒𝑛𝑡. 𝐴𝑃𝑁 𝐾. 𝑃𝐷𝑃𝑐𝑜𝑛𝑡𝑒𝑥𝑡𝐴𝑐𝑡𝑖𝑣𝑒. 𝐴𝑃𝑁
𝐴𝑣𝑒𝐷𝐿. 𝐴𝑃𝑁 = 𝐺𝑇𝑃𝐵𝑦𝑡𝑒𝑠𝑅𝑒𝑐𝑒𝑖𝑣𝑒𝑑. 𝐴𝑃𝑁 𝐾. 𝑃𝐷𝑃𝑐𝑜𝑛𝑡𝑒𝑥𝑡𝐴𝑐𝑡𝑖𝑣𝑒. 𝐴𝑃𝑁
Where 𝐺𝑇𝑃𝑏𝑦𝑡𝑒𝑠𝑆𝑒𝑛𝑡 𝑎𝑛𝑑 𝐺𝑇𝑃𝑏𝑦𝑡𝑒𝑠𝑅𝑒𝑐𝑒𝑖𝑣𝑒𝑑 represent the number of User plane Bytes sent and received respectively at the APN level. K is a constant and the 𝑃𝐷𝑃𝑐𝑜𝑛𝑡𝑒𝑥𝑡𝐴𝑐𝑡𝑖𝑣𝑒. 𝐴𝑃𝑁 represents the number of active PDP(Packet Data Protocol) contexts at APN (Access Point Name) level.
• The study of Soldani et al. [18] also provides different examples of service assurance solution for Network Management Systems such as the:
o Centralized Performance Management: in this system the data is collected from the Network element layer, pre-processed in the databases and sent for visualization. It mentions also that the storage capacity and retention period are CSP dependent.
o Active, Service Management tools: this includes probing systems. Easily manage alarming systems.
o Service Quality Manager: consisting of KPIs (metrics), Real time data processing, Alarming systems, and more functionalities.
2.1.3. Scope of the above QoS Review
The work done presented by D. Soldani et al. as summarized above is one of the most detailed and inspirational research studies in Telecommunications and Quality of Service (QoS). The work presents the conceptual architectures of QoS and QoE taking into consideration integrity and accessibility. The topic on Retainability has not been covered in the study. And, their (2.1.2.7)
approach is based on a layered architecture focusing on Network Element Management layer (Performance Management and Fault Management) and Network Management layer which is the baseline of SQM and CEM. QoS metrics computation are presented in a clear way. It also presents different SQM systems and tools for QoS improvement.
From the previous review, our research follows some of the methodologies described in the work of the researchers such as following a layered architecture for our Network Data analysis. However, the work presented by D. Soldani et al. does not tackle the methodology or technology used for data pro-processing phase and does not detail much on the SQM use cases that could be useful for different departments although the use case layer was added on the conceptual architecture. The administration database system presented is not detailed as for how to proceed with the management of the database.
In our research we include the steps used for data processing and pre-processing, including SQL and Big Data techniques to manipulate network elements data. And also, deduce some basic SQM use cases from which CSPs can build upon.
2.2.
Data Mining and Predictive Analytics Review
Finding information pattern in a bunker of data and predicting the trend of performance have become the new song of today Data Science techniques and it is being applied to almost every domain in life (Medicine, Telecommunications, Finances, …). Data mining is simply related to applying a thorough explanatory Data Analysis on the datasets. The review in this section is mostly based on the work by Daniel T. Larose and Chantal D. Larose in Data Mining and Predictive Analytics [20]. Their study describes six tasks that can be accomplished through data mining techniques as summarized in the below table:
Table 2 Illustration of Data Mining Tasks
Tasks Summary.
Description • Description of pattern information inside the data.
• Use Exploratory Data Analysis and any graphical model to uncover data pattern.
Prediction • Relying on future trend, or future results.
• Predicting a certain service adoption 2 to 3 months from now (Marketing campaign related strategy).
• Can use Regression methods Classification • Focus on categorical predictors.
• Classifying the customers likely to “churn” from a Communication Service Provider.
Estimation • Approximation model of numerical variables based on categorical predictors.
• Estimating the number of customers that could be affected by poor YouTube streaming quality based on other predictors.
• Can also use Regression models and other statistical methods.
Clustering • Categorizing attributes of the same nature together. • No target predictor required for clustering.
• Groups of customer contracts (Prepaid, Post-paid, …) Association • Prediction of Degradation of services in a Communication
Service Provider.
• Creating relationship between attributes or predictors. • Applying the rule of “If … then …” with support and
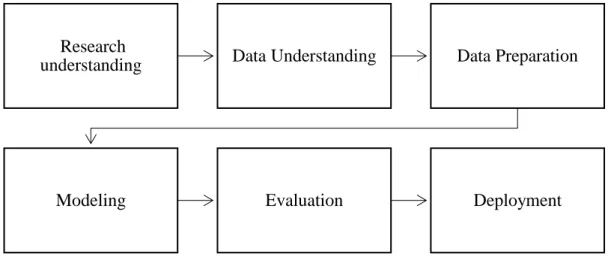
The methodology used by Daniel T. Larose and Chantal D. Larose is based on the Cross-Industry Standard process for Data Mining (CRISP-DM) developed by analysts and researchers [21]. This methodology will be adopted by our research, but with a bit of customization on the process.
The CRISP-DM methodology defines a process model that provides a framework for carrying data mining projects which is independent of the industry sector and the technology used. This gives the model a certain flexibility in terms of area of application. Adapting the methodology to fit the Mobile Cellular Networks is the main objective of the research.
▪ Research Understanding Phase: Understanding what needs to be done and requirements from a research perspective. The knowledge is then converted in to Data Mining problem definition as defined in the problem statement. Finally prepare a preliminary strategy to meet the requirements.
▪ Data understanding Phase: Initial data collection, get familiar with the data, identify quality problem in the data using exploratory data analysis, discover first Insight in to the data. Detect interesting subsets to form a hypothesis for hidden information (subsets that may contain actionable patterns).
▪ Data preparation phase: Construct the final data set. Data feeding to the model. The tasks in this process includes record, tables, attribute selection, data cleaning, construction of new attributes, transformation of data for the modelling tool.
▪ Modeling Phase: Apply and calibrate the model(s) to optimal values. In this case focus will be on the Regression trees.
Research
understanding Data Understanding Data Preparation
Modeling Evaluation Deployment
▪ Evaluation Phase: Evaluate and review the steps that used to build the model to ensure that the model has met the objectives set. A key point in the phase is to evaluate if there is any research area that has not been considered sufficiently. At the end, the model should be ready to be deployed.
▪ Deployment Phase: Be able to reuse the research output. The output of the research model will be a reporting graphical representation of Modelled data.
2.2.1. Big Data Review
The amount of Data that are generated in a Mobile Cellular Network by subscribers, grow in an exponential way with ease adoption of Smartphones, affordable subscriber plans, and wide span of attractive applications. Even in the Telecommunications, data generated is of higher magnitude comparing to the size of Telecommunications data of years ago. Because of the number of Open source Big Data projects being developed, several start-up companies move towards the big data direction. Since Big Data approach is one of the methods that we are using in this research study, we browse through some of the big data technologies available and at the end, we use one technology to approach our study.
2.2.1.1. Hadoop MapReduce Overview
Hadoop is an open-source Big Data technology, which has been used for years now for processing large scale data. And it run on a cluster of servers. Using simple programming model, Hadoop is based on distributing processing computing where tasks are distributed among many computers. Google back in 2014 analysed the fastest methodology to process Terabytes of information by developing a distributed computing mechanism, the MapReduce [22]. MapReduce can be integrated with many big data platforms, as an example here, the open source Hadoop.
Advantages of the Hadoop Big Data:
• Open source framework and can run on a cluster of commodity servers. Cost reduction. No need to purchase extravagant Hardware.
• Fault tolerance and high availability are provided with the Hadoop big data platform. • Hadoop is very good for Batch processing of large amount of data.
• Distributed computing facilitating the movement of codes around the cluster than moving around a large dataset. The framework facilitates the writing of codes for distributed applications.
Components of the Hadoop Big Data:
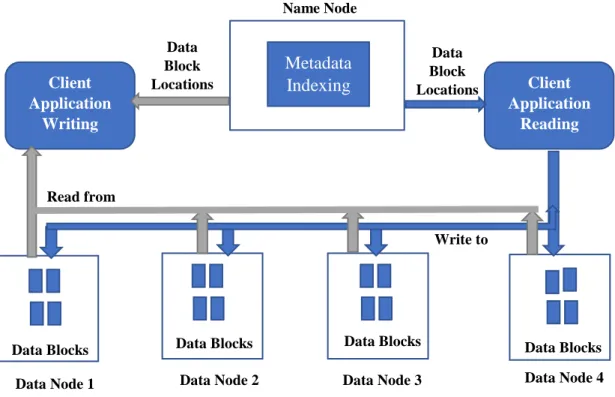
• HDFS: the Hadoop Distributed File System is the file system used to store data and it is used to have faster access to big amount of data. Data is partitioned into blocks and stored in the cluster’s individual machines. The HDFS consists of two types of nodes: Data Node and Name Node.
o Name Node: Manages the systems files, also stores the Metadata. o Data Node: Stores the blocks of Data files (content).
The below figure shows a typical Architecture of an HDFS with four Data Nodes and one Name Node.
o To ensure that the Data Nodes are all functional, they send “heartbeats” messages to the Name node.
o To provide the list and status of data blocks, the Data Nodes send “Blockreport” messages to the Name node.
Data Block Locations Data Blocks Data Block Locations Name Node Client Application Writing Client Application Reading Metadata Indexing Data Blocks
Data Node 1 Data Node 2
Data Blocks Data Node 3 Data Blocks Data Node 4 Read from Write to
o Every process of Data Read or Write goes through the Name Node. A client application sends the request to “read” or “write” data from or to respectively to the Name Node. The Name Node responds with the locations of the specific data blocks that constitute the file.
o For the write process, the Name Node creates new entries in the HDFS namespace every time a write request is initiated by the client application. o However, the Name Node does not take part into the actual retrieval of data
from the cluster to the client.
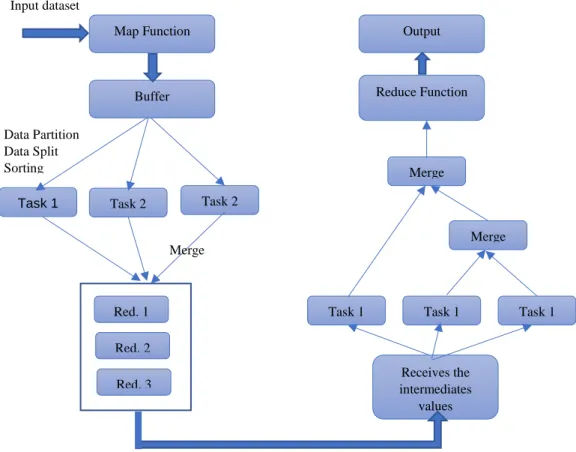
• MapReduce: The processing engine for large datasets. It uses parallel processing capability and provides a higher-level environment for drafting distributed application codes that can run on clusters of machines. The MapReduce has two main functions:
o Map: The Map splits and distributes the data partitions across the data nodes in the cluster of machines. It uses key-value pairs as inputs and output intermediates keys. It arranges the output and put together the values which belong to the same intermediate keys. Then this is passed to the Reduce function.
o Reduce: The Reduce function of the MapReduce aggregates the intermediate value keys received from the Map function, and outputs one aggregated value. Presented by Khadija et al., the tasks of the MapReduce are shown in the figure below [23]:
• Limitations of Hadoop Technology:
Although considered as one of the biggest big data technologies by many researchers and scientists, the Hadoop technology has shown some limitations which are listed below:
o Small Files problems: The design capacity of Hadoop is very high. Therefore, it doesn’t process efficiently small files, with small size defined to be less than the HDFS size of a block, which by default is 128 Mb.
o Slow processing speed: in processing large datasets, the two functions of Hadoop, described above (Map and Reduce) need to be performed in a parallel way. This increases the latency since the data is also stored in the disk.
Task 1
Merge
Receives the intermediates
values
Task 1 Task 1 Task 1 Merge Reduce Function Output Red. 1 Red. 2 Red. 3 Input dataset Data Partition Data Split Sorting Map Function Buffer Task 2 Task 2 Merge
o Good for Batch Processing Only: Hadoop does not work well with streamed data, which also affects the performance speed. Datasets for Hadoop are processed in Batches.
o Real time capability not supported: For huge amount of data processing, batch processing could be the ideal solution, but also requires high computational power. Hadoop takes high volume data and produces output. However, the solution is not suitable for real time processing.
o Not user friendly: For every operation that needs to be done on the cluster, codes need to be handed over, this makes the system complex to use. MapReduce on its own downs provide interactivity.
o No Caching capability: MapReduce doesn’t provide the capability to cache data in memory. The intermediate data cannot be cached for further processing, which slows down Hadoop performance.
2.2.1.2. In-Memory Processing with Apache Spark
As mentioned in section 2.2.1, Hadoop technology has shown limitations in terms of data caching, in-memory processing. Not suitable for data streaming and real time processing. In the same line, many data processing technologies have been relying on data manipulation in disk, with a good illustration being the popular Structure Query Language (SQL). Many services provided today such as video streaming, social media streaming (twitter stream) and audio-streaming applications require low latency, fast data processing and quicker data retrieval speed. Data stored in the memory is accessed faster than data stored in disk; for that reason, for real time applications and streaming, in-memory data processing happens to be the best methodology to process data [24]. In contrary to the Big Data Hadoop system, in-memory data processing provides a lower hardware footprint relying on the single computer processing power. To meet the business needs, computational elements such as CPU, Memory size, disk storage are all extremely important for fast data processing. The objective is to process data at rest and data on the move to answer different business needs.
Apache Spark, built on Java, is a big data framework, based on distributed processing; however, Apache Spark is faster than many existing big data processing frameworks. The speed
of Apache Spark is deducted and demonstrated with the fact that data processing is completely done in memory of the computer(s) and remove the needs for using I/O processes on the storage disks.
• Some Advantages of Apache Spark:
o Powerful processing framework with a uniform programming model
o Support multiple programming languages including Python, Java, Scala, R. o Faster data processing than other big data processing because of the in-memory
capability.
o Supports both stand-alone (single machine) and cluster configuration.
o Comes with a diverse stack of libraries and functionalities, used for different data processing needs.
• The Spark Libraries:
• SparkSQL:
The technological enhancement introduces many challenges including but not limited to development of skills. Organizations for very long time has been using Relational Database Management Systems (RDBMS) and have invested a lot in such technologies.
Facilitates the use of the popular SQL queries inside the Applications of Spark
Facilitates and supports graph algorithms to process big Data.
Facilitates real or live data stream processing Facilitates Machine
Learning application development
Spark
SparkSQL GraphX MLlib Spark Streaming
Re-investing totally in a new technology could be a considerable obstacle towards adopting new technologies. Hence, the need for many platforms to enable interoperability between existing systems, technologies and the latest ones. SparkSQL is an Apache Spark module and library, developed to process Relational Data Structure with Spark [25]. It enables the application of SQL commands to retrieve information. Hence, SQL Users can take advantage of the Big Data processing. SparkSQL presents three main capabilities as presented by [26]:
• Data frame abstraction in different programming languages including Java, Python and Scala to efficiently work with structured data sets.
• Read and write many popular structured data formats such as JASON, Parquet, and Tables).
• Using SQL, query data from inside Spark program and from external tools that use database connectors to communicate with Spark (JDBC/ODBC). This scenario is used in this paper since the connection to the dataset is via JDBC connector.
• In-memory Caching and Data Access for SparkSQL:
Spark SQL takes the advantage of the in-memory capability of Apache Spark to provide to cache data in the memory in a structured way. It reduces the memory footprint by applying columnar compression techniques on the structured data dictionary encoding
SparkSQL
JDBC/ODBC Spark Shell
JDBC/ODBC
JSON Hive CSV Parquet


![Figure 18 Deviation, Coherence & Precision of Galton's Regression Experiment [33]](https://thumb-us.123doks.com/thumbv2/123dok_us/9777120.2469449/51.892.192.701.104.524/figure-deviation-coherence-amp-precision-galton-regression-experiment.webp)
![Figure 22 Illustration of Simulation for Handwriting Recognition Study using Deep Network [35]](https://thumb-us.123doks.com/thumbv2/123dok_us/9777120.2469449/54.892.256.724.158.366/figure-illustration-simulation-handwriting-recognition-study-using-network.webp)
![Figure 23 Business Performance Management Framework as presented by Yu Shin and X. Lu [39]](https://thumb-us.123doks.com/thumbv2/123dok_us/9777120.2469449/56.892.126.792.209.559/figure-business-performance-management-framework-presented-yu-shin.webp)
