BearWorks
BearWorks
MSU Graduate Theses
Summer 2019
Fake Review Detection using Data Mining
Fake Review Detection using Data Mining
Md Forhad HossainMissouri State University, [email protected]
As with any intellectual project, the content and views expressed in this thesis may be considered objectionable by some readers. However, this student-scholar’s work has been judged to have academic value by the student’s thesis committee members trained in the discipline. The content and views expressed in this thesis are those of the student-scholar and are not endorsed by Missouri State University, its Graduate College, or its employees.
Follow this and additional works at: https://bearworks.missouristate.edu/theses
Part of the Other Computer Engineering Commons
Recommended Citation Recommended Citation
Hossain, Md Forhad, "Fake Review Detection using Data Mining" (2019). MSU Graduate Theses. 3423. https://bearworks.missouristate.edu/theses/3423
This article or document was made available through BearWorks, the institutional repository of Missouri State University. The work contained in it may be protected by copyright and require permission of the copyright holder for reuse or redistribution.
FAKE REVIEW DETECTION USING DATA MINING
A Master’s Thesis Presented to The Graduate College of Missouri State University
In Partial Fulfillment
Of the Requirements for the Degree Master’s of Science, Computer Science
By
Md Forhad Hossain August 2019
FAKE REVIEW DETECTION USING DATA MINING Computer Science
Missouri State University, August 2019 Master’s of Science
Md Forhad Hossain
ABSTRACT
Online spam reviews are deceptive evaluations of products and services. They are often carried out as a deliberate manipulation strategy to deceive the readers. Recognizing such reviews is an important but challenging problem. In this work, I try to solve this problem by using different data mining techniques. I explore the strength and weakness of those data mining techniques in detecting fake review. I start with different supervised techniques such as Support Vector Ma-chine (SVM), Multinomial Naive Bayes (MNB), and Multilayer Perceptron. The results attest that all the above mentioned supervised techniques can successfully detect fake review with more than 86% accuracy. Then, I work on a semi-supervised technique which reduces the dimension-ality of the input features vector but offers similar performance to existing approaches. I use a combination of topic modeling and SVM for the implementation of the semi-supervised tech-nique. I also compare the results with other approaches that consider all the words of a dataset as input features. I found that topic words are enough as input features to get similar accuracy compared to other approaches where researchers consider all the words as input features. At the end, I propose an unsupervised learning approach named asWords Basket Analysisfor fake re-view detection. I utilize five Amazon products rere-view dataset for an experiment and report the performance of the proposed on these datasets.
bas-FAKE REVIEW DETECTION USING DATA MINING
By
Md Forhad Hossain
A Master’s Thesis
Submitted to The Graduate College Of Missouri State University In Partial Fulfillment of the Requirements
For the Degree of Master’s of Science, Computer Science August 2019
Approved:
Jamil M. Saquer, Ph.D., Thesis Committee Chair
Razib Iqbal, Ph.D., Committee Member
Lloyd A. Smith, Ph.D., Committee Member
Julie Masterson, Ph.D., Dean of the Graduate College
In the interest of academic freedom and the principle of free speech, approval of this thesis indicates the format is acceptable and meets the academic criteria for the discipline as determined by the faculty that constitute the thesis committee. The content and views expressed in this thesis are those of the student-scholar and are not endorsed by
ACKNOWLEDGEMENTS
First, I would like to thank Dr. Jamil M. Saquer for his continuous help throughout the research. His guidance helped me a lot to make good progress in my research. I enjoyed and learned a lot working with him. He also helped me a lot for my teaching assistant (TA) duties. He is very well organized, which made my TA duties easier. I would also like to thank Dr. Razib Iqbal for helping me in my research. I liked his always-ready attitude to help. He also helped me a lot outside of academic work. I would also like to thank Dr. Lloyd A. Smith for helping with all the academic works and GA duties.
Lastly, I would like to thank my family for their continuous support from Bangladesh. I dedicate this thesis to my mother (Fatema), my elder brother (Faruk), my younger sister (Jemmy), my younger brother (Tanvir) and my uncle (Amjadh).
TABLE OF CONTENTS
1 INTRODUCTION Page 1
2 RELATED WORK Page 8
3 SUPERVISED LEARNING APPROACH Page 13
3.1 Data Collection Page 13
3.2 Algorithm Selection Page 15
3.3 Different Algorithms' Performance Page 15
3.4 Visualization of POS Frequency Page 19
3.5 Working Procedure and Results Page 19
4 TOPIC MODELING BASED APPROACH Page 21
4.1 Proposed Approach & System Implementation Page 23
4.2 Performance Page 25
4.3 Performance with Unbalance Dataset Page 30
4.4 Performance with Only Topic Sentences Page 32
4.5 Topic Words Counting Approach Page 35
5 WORDS BASKET ANALYSIS Page 40
5.1 Working Procedure Page 40
5.2 Performance Page 41
5.3 Words Basket Analysis using Useful Votes Page 49
6 CONCLUSION Page 56
References Page 60
Appendices Page 61
Appendix A. Datasets Page 61
LIST OF TABLES
3.1 Automated SGD Classifier's performance with different train and test sets, including
(A)ccuracy, (P)recision, (R)ecall and (F)1-score. Page 18
3.2 Automated MNB classifier's performance with different train and test sets, including
(A)ccuracy, (P)recision, (R)ecall and (F)1-score. Page 18
3.3 Automated MLP classifier's performance using one hidden layer with different train and test sets, including (A)ccuracy, (P)recision, (R)ecall and (F)1-score. Page 18 3.4 Automated MLP classifier's performance using two hidden layer with different train
and test sets, including (A)ccuracy, (P)recision, (R)ecall and (F)1-score. Page 19 4.1 Classifier performance with positive and negative reviews dataset on 5-fold cross-validation
experiments and reported precision, recall and F-1 score. Page 30 4.2 Classifier performance with unbalanced reviews dataset with majoritypositivereviews
on 5-fold cross-validation experiments and reported accuracy, precision, recall and
F-1 score. Page 31
4.3 Classifier performance with unbalanced reviews dataset with majoritynegative re-views on 5-fold cross-validation experiments and reported accuracy, precision, recall
and F-1 score. Page 31
4.4 Appearance of topic words (from topic 1) in truthful and deceptive reviews. Page 38 4.5 Appearance of topic words (from topic 2) in truthful and deceptive reviews. Page 39 5.1 Performance ofWords Basket Approachwith a Power Bank's reviews dataset where
upper threshold is 60% and lower threshold is 40% for labeling truthful and
5.2 Performance ofWords Basket Approachwith a Blending Machine's reviews dataset where upper threshold is 60% and lower threshold is 40% for labeling truthful and
deceptive reviews. Page 44
5.3 Performance ofWords Basket Approachwith an iPhone6's reviews dataset where up-per threshold is 60% and lower threshold is 40% for labeling truthful and deceptive
reviews. Page 45
5.4 Performance ofWords Basket Approachwith a Book's reviews dataset where upper threshold is 60% and lower threshold is 40% for labeling truthful and deceptive
re-views. Page 45
5.5 Performance ofWords Basket Approachwith a Headphone's reviews dataset where upper threshold is 60% and lower threshold is 40% for labeling truthful and
decep-tive reviews. Page 46
5.6 Performance ofWords Basket Approachwith a Power Bank's reviews dataset where upper threshold is 65% and lower threshold is 35% for labeling truthful and
decep-tive reviews. Page 46
5.7 Performance ofWords Basket Approachwith a Blending Machine's reviews dataset where upper threshold is 65% and lower threshold is 35% for labeling truthful and
deceptive reviews. Page 47
5.8 Performance ofWords Basket Approachwith an iPhone6's reviews dataset where up-per threshold is 65% and lower threshold is 35% for labeling truthful and deceptive
reviews. Page 47
5.9 Performance ofWords Basket Approachwith a Book's reviews dataset where upper threshold is 65% and lower threshold is 35% for labeling truthful and deceptive
re-views. Page 48
5.10 Performance ofWords Basket Approachwith a Headphone's reviews dataset where upper threshold is 65% and lower threshold is 35% for labeling truthful and
5.11 Performance ofWords Basket Approachwith a Power Bank's reviews dataset where upper threshold is 70% and lower threshold is 30% for labeling truthful and
decep-tive reviews. Page 49
5.12 Performance ofWords Basket Approachwith a Blending Machine's reviews dataset where upper threshold is 70% and lower threshold is 30% for labeling truthful and
deceptive reviews. Page 49
5.13 Performance ofWords Basket Approachwith an iPhone6's reviews dataset where up-per threshold is 70% and lower threshold is 30% for labeling truthful and deceptive
reviews. Page 50
5.14 Performance ofWords Basket Approachwith a Book's reviews dataset where upper threshold is 70% and lower threshold is 30% for labeling truthful and deceptive
re-views. Page 50
5.15 Performance ofWords Basket Approachwith a Headphone's reviews dataset where upper threshold is 70% and lower threshold is 30% for labeling truthful and
decep-tive reviews. Page 51
5.16 Performance ofWords Basket Approachusinguseful voteswith a Power Bank's re-views dataset where upper threshold is 65% and lower threshold is 35% for labeling
truthful and deceptive reviews. Page 53
5.17 Performance ofWords Basket Approachusinguseful voteswith a Blending Machine's reviews dataset where upper threshold is 65% and lower threshold is 35% for
label-ing truthful and deceptive reviews. Page 53
5.18 Performance ofWords Basket Approachusinguseful voteswith an iphone6's reviews dataset where upper threshold is 65% and lower threshold is 35% for labeling
truth-ful and deceptive reviews. Page 54
5.19 Performance of WordsBasket Approachusinguseful voteswith a Book's reviews dataset where upper threshold is 65% and lower threshold is 35% for labeling truthful and
5.20 Performance of Words Basket Approachusinguseful voteswith a Headphone's re-views dataset where upper threshold is 65% and lower threshold is 35% for labeling
truthful and deceptive reviews. Page 55
5.21 Performance of Words Basket Approachusinguseful voteswith a Power Bank's re-views dataset where upper threshold is 65% and lower threshold is 35% for labeling
LIST OF FIGURES
1.1 The Google Trend result of the search query ”Fake Review” in the USA Page 3 3.1 Parts of Speech(POS) frequency distribution over positive and negative review. Page 19 3.2 Parts of Speech(POS) frequency distribution over truthful and deceptive review. Page 20
4.1 System Overview Page 23
4.2 Impact of number of components on accuracy Page 25
4.3 Impact of lemmatization and the presence/removal of duplicate topic words on the
accuracy of the model on thepositivereviews dataset Page 27
4.4 Impact of lemmatization and the presence/removal of duplicate topic words on the
accuracy of the model on thenegativereviews dataset Page 27
4.5 Accuracy, Precision, Recall and F1-Score oftruthful reviewsof spam review detec-tion using topic modeling and SVM on thepositivereviews dataset. Page 28 4.6 Accuracy, Precision, Recall and F1-Score ofdeceptive reviewsof spam review
de-tection using topic modeling and SVM on thepositivereviews dataset. Page 28 4.7 Accuracy, Precision, Recall and F1-Score oftruthful reviewsof spam review
detec-tion using Topic Modeling and SVM on thenegativereviews data set. Page 29 4.8 Accuracy, Precision, Recall and F1-Score ofdeceptive reviewsof spam review
de-tection using Topic Modeling and SVM on thenegativereviews data set. Page 29 4.9 Accuracy, Precision, Recall and F1-Score oftruthful reviewsof spam review
detec-tion using Topic Modeling and SVM on thepositivereviews withtopic sentencedata
set. Page 34
4.10 Accuracy, Precision, Recall and F1-Score ofdeceptive reviewsof spam review de-tection using Topic Modeling and SVM on thepositivereviews withtopic sentence
4.11 Accuracy, Precision, Recall and F1-Score oftruthful reviewsof spam review detec-tion using Topic Modeling and SVM on thenegativereviews withtopic sentencedata
set. Page 35
4.12 Accuracy, Precision, Recall and F1-Score ofdeceptive reviewsof spam review de-tection using Topic Modeling and SVM on thenegativereviews withtopic sentence
data set. Page 35
5.1 Words Basket from power bank dataset. Topic modeling is used to get the topic words
1 INTRODUCTION
E-commerce is growing at an unprecedented rate all over the globe. With its growth, the impact of online reviews is increasing day by day. Reviews can influence people's purchasing de-cisions. Nowadays, reading product reviews before buying the product has become a habit, espe-cially for potential customers. Customers post reviews about a product they purchase which may be positive or negative. Such reviews provide valuable feedback on these products, which may further be used by potential customers to find the opinions of existing users before deciding to purchase a product. If customers want to buy a product, they usually read reviews from some cus-tomers about the current product. If the reviews are mostly positive, there is a big chance to buy the product. Otherwise, if the reviews are mostly negative, customers tend to buy other products.
While online reviews can be helpful, blind trust of these reviews is dangerous for both the seller and buyer. Most customers read online reviews before placing any online order. However, the reviews may be deceptive for extra profit or gain, thus any purchasing decision based on on-line reviews must be made carefully. To sell their products, companies often pursue customers to give desired reviews. There is a growing incentive for businesses to solicit and manufacture deceptive reviews, a.k.a. opinion spam- fictitious reviews that have been deliberately written to sound authentic and deceive the reader [1]. For example, Ott [2] has estimated that between 1% and 6% of positive hotel reviews appear to be deceptive, suggesting that some hotels may be posting fake positive reviews in order to hype their own offerings.
Spam detection has been studied in many areas. Web spam and e-mail spam are the two most widely studied types of spam. Opinion spam is very different from those two. Unlike other forms of spam, it is almost impossible, to recognize fake opinions by manually reading them. For example, one can write a truthful review of a bad hotel and post it as a fake review for a good hotel. Fake reviews are especially damaging for small businesses. Even a single bad fake review can cause significant damage to a small business. A couple of examples of truthful and deceptive
reviews about a restaurant named Affinia in Chicago city are given below. We request the reader to read those reviews carefully and label them. You can check your answer later.
Review 1. I was completely blown away by this hotel. It was magnificent. I got a great deal and I am so happy that I stayed here. Before arriving I was nervous as I had read a few bad reviews about the impact the renovation was having on peoples stay, for example very noisy. However, whilst the renovation was still going on and the gym was not open nor the restaurant, it made no difference to me. My room was huge, bathroom was spacious with excellent water pressure, bed was perfect and the view was amazing. Hotel is so close to the great shops of Mag-nificent Mile, plus a comfortable walking distance to Hancock tower and Millennium Park.
Review 2. My husband and I arrived for a 3 night stay for our 10th wedding anniversary. We had booked an Executive Guest room, upon arrival we were informed that they would be up-grading us to a beautiful Junior Suite. This was just a wonderful unexpected plus to our beauti-fully planned weekend. The front desk manager was professional and made us feel warmly wel-comed. The Chicago Affinia was just a gorgeous hotel, friendly staff, lovely food and great at-mosphere. Not the mention the feather pillows and bedding that was just fantastic. Also we were allowed to bring out beloved Shi-Tzu and he experienced the Jet Set Pets stay. The grooming was perfect, the daycare service we felt completely comfortable with. This was a beautiful weekend, thank you Affinia Hotels! We would visit this hotel again!
Review 3. There were many positives when staying in this hotel at the north end of the Magnificant Mile. The rooms were spacious and beautifully appointed with great attention to detail. The quality of service was excellent, the staff professional, and the location was perfect. There are great views of Chicago from many of the rooms. The staff seemed to care about the quality of my stay from the moment I was greeted upon arrival to the moment I got in my taxi to leave. There is a nice rooftop bar/restaurant perfect for a lite meal or a refreshing cocktail with great views of the city. There really weren’t any negatives and I would recommend this boutique hotel to anyone staying in the Chicago area.
throughout. The Concierge Christopher was excellent and helped as with all our needs, gave us discount vouchers etc. Hotel was in excellent position. 3 blocks from John Hancok Building and more importantly The Cheesecake Factory , Bloomingdales 3 blocks away and the Water Tower Shopping Centre 2 blocks away. We went to the huge I Max cinema which is about ten minutes away. Cant wait to go back to Chicago and The Affinia
Review 1 and Review 4 are truthful whereas Review 2 and Review 3 are deceptive. Com-pare your labeled answer with the actual result. Now you will have an idea of how difficult it is to detect a fake review. Its almost impossible to label a review correctly simply reading the review.
Besides, day by day customers in the USA are becoming concerned about fake reviews. The Google trend chart for ”fake review” (Figure 1.1) clearly tells us about customers concern re-garding counterfeit reviews. In Figure 1.1, numbers represent search interest relative to the high-est point on the chart. A value of 100 is the peak popularity for the term. A value of 50 means that the term is half as popular. A score of 0 means there was not enough data for this term.
Figure 1.1: The Google Trend result of the search query ”Fake Review” in the USA
Primarily, there are three types of spam reviews [3]:
1) Fake review: These reviews are written with a motive to promote or demote a product. In most of the cases reviewers do not have first-hand experience of using the products or services.
2) Review about brands only:Here reviews are not about a specific product or service instead it is about the brand or manufacturer of the product. For example, a review about Sam-sung smartphone that says, ”I hate SamSam-sung phone, I never buy any of their smartphones.”
3) Non-reviews: These reviews are advertisements and irrelevant content without any proper opinion.
There are two types of fake reviewers: professional fake reviewers and nonprofessional fake reviewers.
Professional fake reviewers: A professional fake reviewer usually writes a large number of reviews. They might work as a freelancer or work for a company to write fake reviews. They get paid for their work. As they write a large number of reviews, their linguistic and behavioral patterns can be easily identified by different data mining algorithms. But before they are caught they might have already done a significant amount of damage. To make matters worse, when they are caught for spamming reviews they leave their account, and create a new account and start spamming again.
Nonprofessional fake reviewers: They write a small number of fake reviews. These peo-ple write fake reviews to foster themselves or their friends and families. They usually do not get paid for their work. As they write a small number of fake reviews, their linguistic and behavioral patterns are hard to identify.
Spamming can occur in two ways: individual spamming or group spamming.
Individual spamming:An individual spammer does not work with anyone. For example, a seller of a product may write fake reviews for himself to promote his business or product.
Group spamming:A group of spammers work together to promote or demote a product or service. It usually carried out by professional spammers. Group spamming is more damaging than individual spamming.
There are three main types of data that can be used for spam review detection:
Review Content:We can extract linguistic features such as word and parts of speech (POS), n-grams and other syntactic, semantic, and stylistic clues for deceptions and lies.
Meta-data about each review: The data such as the star rating given to each review, user id of reviewer, review-id, the time/date when the review was posted, and the number of helpful-ness votes.
Web usage data: This data include the sequence of clicks, the time when each click is made, how much time a user stays on a page, the time taken to write a review and so on. Such data are also called side information.
Product Information: Information about the entity being reviewed, for example, product brand, model, type/category, and description.
Sales Information:This mainly includes business-related information such as the sales volume and the sales rank of a product in each period of time.
Generally, lying/deception communications are characterized by the use of fewer first-person pronouns, more negative emotion words, fewer exclusive words, and more motion/ac-tion words [3]. Several researchers have hypothesized that liars often try to avoid statements of ownership either to dissociate themselves from their words or due to the lack of personal experi-ences [3]. Fake reviewers do not give any specific opinion about any specific features of products or services as they lack the first-hand experience. So they use more general opinion words such as great, wonderful, and so on in their given reviews.
Detecting fake review using supervised learning is applicable. It is possible to use super-vised learning to detect fake reviews, because fake review detection can be formulated as a clas-sification problem with two classes, fake and non-fake. However, the key difficulty is that it is al-most impossible to recognize fake reviews reliably by manually reading them because a spammer can carefully craft a fake review that is just like any genuine review. For this reason, there is no reliable fake review and non-fake review data set available to train a machine learning model to recognize fake reviews. Because there is no labeled data for learning, Jindal and Liu [4] exploited duplicate reviews in their study on Amazon reviews. Researchers employed three sets of features for learning: Review-centric features, Reviewer-centric features, and Product-centric features.
Review-centric features: These features are all about each review. These features in-clude length of the review, number of useful votes, review rating, percentage of positive and neg-ative sentiment words in the review, cosine similarity of the review and the product description, percentage of brand name mentions, etc.
Reviewer-centric features: These features are about each reviewer. These features in-clude review frequency of the reviewer, average rating given by the reviewer, total number of re-views posted, etc.
Product-centric features: These features are about each product. These features include the average rating of the product, price of the product, brand name of the product, etc.
Li et al. [5] manually labeled a set of fake and non-fake reviews by reading the reviews and the comments. We have described in more details about their labeling process in the next chapter. Ott et al. [6] used Amazon Mechanical Turk to crowdsource fake hotel reviews of twenty hotels. Their work reported 89.6% of accuracy using only word bigram features under the bal-anced class distribution. Feng et al. [7] used some deep syntax rule-based features to boot the accuracy to 91.2%.
There are two types of features that can be used in classification: linguistic features and behavioral features [3]. Linguistic features are about the review text content, while behavioral features are about behaviors of reviewers and their reviews. Behavioral features combined with bigram gave the highest accuracy with Yelp data (only contains positive reviews about popular Chicago hotels and restaurants). Wang et al. [8] proposed a graph-based module for detecting spam where reviews describe purchase experiences and evaluations of stores. The spamming be-haviors are as follows: targeting products, targeting groups, general rating deviation, and early rating deviation [3].
Targeting products:Spammer usually put their efforts toward promoting or demoting a few target products. They closely monitor those products and mitigate the rating by giving fake reviews.
Targeting groups:It defines the pattern of spammers manipulating ratings of a set of products sharing some attributes within a short span of time.
General rating deviation: A real reviewer usually gives a rating to a product that is al-most similar to other raters of the same product. However, a spammer tries to promote or demote a product by giving a rating that typically deviates from those of other reviews.
Early rating deviation: Early deviation catches the behavior of a spammer by giving a fake review shortly after product launch. Such reviews are likely to draw attention from other reviewers which let spammers to alter the views of consequent reviewers.
In our research, we mainly focus on review-centric features of each review. We apply su-pervised, semi-supervised and unsupervised methods for detecting fake reviews. We do not uti-lize any individual or group behavior features in our proposed method for fake review detection. We use a publicly available hotel reviews dataset and five different Amazon products reviews for our research.
2 RELATED WORK
Most of the research work on spam review detection falls into two categories. One group of researchers focus on only the content of the reviews. On the other hand, other groups of re-searchers concentrate on reviewers behavior instead of review content. But a combination of both approaches gives the best result.
In [4], Jindal, et al. claimed they are the first to attempt to study review spam and spam detection. They collected 2.14 million reviews from Amazon for their research work. They found a large number of duplicate and near-duplicate reviews written by the same reviewers on different products or by different reviewers on the same products or different products. They proposed to perform spam detection based on duplicate finding and classification. They used logistic regres-sion to learn a predictive model. Using 10-fold cross-validation on the data they got average area under the ROC curve (AUC) value of 78%.
In [6], Ott, et al. showed that psychological studies of deception and genre identification are both out-performed at statistically significant levels by n-gram based text categorization tech-niques. Notably, a combined classifier with both n-gram and psychological deception features achieves nearly 90% accuracy.
In [9], Ott, et al. worked on negative deceptive opinion spam which usually are reviews that aim at degrading other company's reputations. They found that standard n-gram text catego-rization techniques can detect negative deceptive opinion spam with performance far surpassing that of human judges.
In [10], Sandulescu, et al. used one time reviewers such as a reviewer who leaves only one review. They exploited the singleton reviewers review. They tackled the problem of detect-ing fake reviews written by the same person usdetect-ing multiple names, postdetect-ing each review under a different name. They propose two methods to detect similar reviews and show the results gener-ally outperform the vectorial similarity measures used in previous work. Their proposed methods
are the semantic similarity between words to the review level and based on topic modeling and exploit the similarity of the reviews topic distributions using two models: bag-of-words (a sim-plifying representation used in natural language processing and information retrieval) and bag-of-opinion (a simplifying representation used in natural language processing and opinion mining) phrases.
In [5], Li, et al. manually labeled nearly 6000 reviews. They collected a dataset from the Epinions website. They employed ten college students for tagging all the reviews. Students were first instructed to read books and articles about how spam review looks like then they were asked to label those reviews.They first used supervised learning algorithm and analyze the effectiveness of different features in review spam identification. They also used a two-view semi-supervised methodology to exploit a large amount of unlabeled data. The experiment results show that two-view co-training algorithms can achieve better results than the single-two-view algorithm.
In [11], Luca, et al. worked on restaurant reviews that are identified by Yelp’s filtering al-gorithm as suspicious, or fake. They found that nearly one out of five reviews is marked as fake by Yelp’s Algorithm. These reviews tend to be more extreme than other reviews and are written by reviewers with less established reputations. Moreover, their finding suggests that economic in-centives factor heavily into the decision to commit fraud. Organizations are more likely to game the system when they are facing increased competition and when they have poor or less estab-lished reputations.
In [12], Wahyuni, et al. aimed to detect fake reviews for a product by using the text and rating property from a review. Their proposed system measures the honesty value of a review, the trustiness value of the reviewer and the reliability value of a product.
In [13], Jindal, et al. deal with identifying unusual review patterns which can represent suspicious behaviors of reviewers. They formulate the problem as finding unexpected rules. They analyzed an Amazon.com review dataset and found many unexpected rules and rule groups which indicate spam activities.
usual practice. These reviewers are highly suspicious of review manipulation. Their research sug-gests that one should focus on detecting spammers based on their spamming behaviors, instead of identifying spam reviews. Their proposed review spammer detecting approach is user-centric, and user behavior-driven. They claimed their proposed methods generally outperform the base-line method based on helpfulness votes.
In [15], Mukherjee et al. dove down to Yelp’s secret filtering algorithm.They put a few existing research methods to the test and evaluated performance on the real-life Yelp data. They found the behavioral features perform very well, but the linguistic features are not as effective. Their analysis and experimental results shows that Yelp’s filtering is reasonable and its filtering algorithm seems to be correlated with abnormal spamming behaviors.
In [16], Li, et al. claimed they are the first one to present a large-scale analysis of restau-rant reviews. They were able to collect a large amount of data from Dianping which is a Chinese group buying website for locally found food delivery services, consumer products and retail ser-vices. Dianping helped them to get user reviews about restaurants and, users IP addresses and profiles. They used a method called Positive-Unlabeled Learning. They used temporal and spatial features at various levels (reviews, users, IPs) for supervised opinion spam detection.
In [17], Xie, et al. developed a model for singleton spam review detection problem based on the observation that the arrival pattern of singleton review tends to be bursty and temporally correlated to the rating.
In [18], Li, et al. worked on detecting spamming network using reviewer posting fre-quency within short periods of times and also considered other users posting frefre-quency within that short period of time for the same products. They primarily tried to find out individual spam-mers and spammer groups.
In [19], KC, et al. worked on the temporal dynamics of opinion spamming. They looked to find out if there are any specific spamming policies that spammers employ. They used a large set of reviews from Yelp restaurants and its filtered reviews to characterize the way opinion spam-ming operates in a commercial setting. Using time-series analysis, they found that there exist
three dominant spamming policies: early, mid and late across the various restaurant. Their anal-ysis showed that the deception rating time-series for each restaurant had statistically significant correlations with the dynamics of truthful rating time-series indicating that spam injection may potentially be coordinated by the restaurants/spammers to counter the effect of unfavorable rating over time.
In [20], Shebuti and Akoglu proposed a framework named Speagle that exploits both re-lational data (user-review-product graph) and metadata (behavioral and text data) collectively to detect suspicious users and reviews, as well as products targeted by spam. Their main contribu-tion is to employ a review-network-based classificacontribu-tion task which accepts prior knowledge on the class distribution of the nodes, estimated from metadata. Their proposed framework works in an unsupervised fashion, but can easily leverage labels.
In [21], Hooi, et al. used a Bayesian Model approach to detect spam reviews. They con-sidered two parameters for fraud review detection. One, Review in short time bursts/periods and another one is finding users who rate product very differently than others.
In [22], Li, et al. used Collective positive-unlabeled (PU) learning for fake review detec-tion. They proposed a supervised algorithm called Multi-typed Heterogeneous Collective Classi-fication (MHCC) for the heterogeneous network of reviews, users and IPs. Then they extended it to Collective Positive and Unlabeled learning (CPU). Their results show that their proposed mod-els can remarkably improve the F1 scores of strong baselines in both PU and non-PU learning settings.
While the vast majority of existing methods focused on either review text or behavioral analysis for detecting a spam review, however in [23], Akoglu et al. used a graph-based network effect among reviewers and products. Their proposed model entirely operates in an unsupervised fashion and is linearly scalable. It consists of two complementary steps; scoring users and re-views for fraud detection, and grouping for visualization and sense-making. They found review-ers, reviews, and products are more deeply encapsulate structure signals. They have created a bipartite network among products, users and reviews for spam review detection.
In [24], Jindal and Liu made the first attempt to investigate opinion spam in reviews and proposed some novel techniques to study spam detection. They used manual labeling for review on brands only and non-reviews. But for untruthful opinions, they used a large number of dupli-cate and near-duplidupli-cate reviews to build a spam detection model.
In [25], Chauhan et al. incorporated sentiment analysis of reviews techniques into the spam review detection. They used sentiment analysis using their in house-dictionary and com-pared sentiment analysis result of a product with the given review by customers. If both results rating difference is higher than a certain level(e.g. 0.5) they level it as a Spam.
In [26], Li, et al. proposed a generative LDA-based topic modeling approach for fake re-view detection. Their approach is a variation of Latent Dirichlet Allocation (LDA) and aims to detect subtle differences between the topic-word distributions of deceptive reviews vs truthful ones [27].
3 SUPERVISED LEARNING APPROACH
In this section, we will talk about the different approaches we take to find fake reviews. We use both supervised and unsupervised methods. We explore different data mining algorithm's performance in fake review detection and compare their results. We also discuss the dataset col-lection procedure.
3.1 Data Collection
We use two types of datasets in our research. One dataset is labeled and another one is unlabeled. The biggest problem we faced in our research is finding a labeled dataset. We found only one publicly available labeled dataset. We also collected different Amazon products reviews which are unlabeled. In this section, we will discuss in details how the labeled and unlabeled datasets were collected.
To conduct most of our experiments, we used Ott et al.'s publicly available dataset of opinion spam [6]. The dataset contains 800 positive reviews (400 truthful and 400 deceptive) and 800 negative reviews (400 truthful and 400 deceptive) of 20 popular Chicago hotels. To collect deceptive reviews, the authors used Amazon Mechanical Turk (AMT) which is a popular crowd-sourcing service. AMT has a large number of well-educated anonymous online workers (known as Turkers). Turkers help to make large-scale data annotation with a small amount of money. The authors created a pool of 400 Human-Intelligence Tasks (HITs) and allocated them evenly across 20 chosen hotels. To ensure that unique authors write opinions, they allowed only a single sub-mission per Turker. They took into consideration that Turkers live in the United States and have an approval rating of at least 90%.
In order to collect truthful reviews, the authors mined 6977 reviews from the 20 most pop-ular Chicago hotels on TripAdvisor. They filtered reviews depending on the following: 1) non-5-star reviews, 2) non-English reviews, 3) reviews with fewer than 150 characters and 4) reviews
sor.
We use the phrasepositive reviews datasetto refer to the part of the dataset that contains truthful and deceptive reviews that promote a product. Likewise, we use the phrasenegative re-views datasetto refer to the part of the dataset that contains truthful and deceptive reviews that demote a product.
We also collected a review dataset of Amazon products. The products include a set of headphones, iPhone, blending machine, power bank, and a book. To select these products, we mainly focused on the following two criteria: 1) product's popularity, and 2) availability of nu-merous number of reviews (e.g. 1k reviews). We used web scraping to collect reviews from Ama-zon website. For web scraping, we used Python’s Requests and BeautifulSoup4 packages. Re-quests package is used for performing HTTP reRe-quests and BeautifulSoup4 is used for handling all of the HTML processing. We collect the content from the specific URL by making an HTTP GET request. If the content-type of the response is some kind of HTML/XML, it returns text content, otherwise, it returns None. Returned content is raw HTML. The BeautifulSoup4 con-structor parses raw HTM strings and produces an object that contains the HTML document struc-ture. The object includes a slew of methods to select, view, and manipulate the document object model (DOM) nodes and text content. From all the DOM, we only take the DOM that contains product review related information. We collect the following information from each review: rat-ing, title, date, verified purchase, body and helpful votes. Each Amazon page contains ten re-views. Therefore, each time we send a URL request, it returns ten rere-views. Amazon blocks the IP address if it receives continues requests from a single IP address. To avoid continually send-ing URL requests, we decided to send a request in a random interval between 5 to 10 seconds. Following the above procedure, we collected 1000 reviews from one blending machine, 5000 re-views from one headphone, 2259 rere-views from one iPhone 6S, 1700 rere-views from one book and 2610 reviews from one power bank.
3.2 Algorithm Selection
One group of researchers focused on features associated with the behavior of the reviewer for fake review detection. Another group of researchers solely focused on review text content for fake review detection. In our research, we mainly concentrate on review text content due to the available dataset. There are few approaches such as bags of words, psycholinguistics analysis, and n-gram based that are used for detecting fake reviews. However, standard n-gram based text categorization techniques have been shown to be effective at detecting deception in the text [1, 6, 24], and the text classification Support Vector Machine (SVM) comparatively performs better than other data mining algorithms[15]. For this reasons, we decided to use SVM with unigram and bigram term frequency for getting better performance in detecting spam reviews. In addition to SVM, we used Multinomial Naive Bayes (MNB) and Multi-Layer perceptron (MLP) for de-tecting spam reviews since they also perform well for text classification.
3.3 Different Algorithms' Performance
In this section, we use Support Vector Machines (SVM) with stochastic gradient descent (SGD) learning, Multinomial Naive Bayes (MNB), Multilayer Perceptron with one hidden layer (MLP1) and two hidden layers (MLP2) for classification. We report the deception review de-tection performance of the above classifiers. We evaluate the performance using Ott et al.'s [6] positive and negative deceptive review dataset.
The outline of our approach for detecting spam reviews using SVM is shown in Algo-rithm 1. We use the Scikit-learn package from Python in our implementation. We create a doc-umentList from the input dataset in lines 1. We use 5-fold cross-validation for evaluating the model's performance. For 5-fold cross-validation, the dataset is divided into 5 parts, where 4 parts are used for training the model and one part is used for testing the model's performance. This process is repeated five times as shown by theforloop in line 2. Therefore, each tuple in the dataset is used once for testing and four times for training. In line 3, we split the documentsList into training and testing data. In line 4, we tokenize the training data and count the occurrence of
each token in the documents. We discard all the stopwords. Normalization and weighting are also performed in line 4 to diminish the importance of tokens that occur in the majority of the doc-uments. In line 5, we apply the TFIDF Transformer to the output from the previous line to give similar priority to long and short documents and perform weight downscaling. We build the clas-sifier/model using linear SVM with stochastic gradient descent (SGD) learning in line 6 and test it in line 7. We also use “Held Out” for evaluating the generated model's performance. In “Held Out” process, we train the model with positive reviews and test with negative reviews and vice versa. We follow a similar procedure for building a classifier with MNB, MLP1, and MLP2.
Algorithm 1Algorithm for detecting spam reviews using SVM 1: documentsList= input dataset
2: fori= 1to5do
3: training data, testing data = Split documentsList
4: tokenize = CountVectorizer(training data).fit transform(training data) 5: tfidf = TfidfTransformer().fit transform(tokenize)
6: classifier = SGDClassifier().fit(tfidf) 7: prediction = classifier.predict(testing data) 8: end for
Results appear in Tables 3.1 - 3.4. If we look at the performance of the generated model in Table 3.1, we find that for positive reviews, the accuracy of 5-fold cross-validation is nearly 89%. But when we follow the “Held Out” procedure to evaluate the performance of the gener-ated model, its accuracy dropped to only 75%. The “Held Out” testing procedure gives better performance with negative reviews, however, and accuracy is nearly 81% and almost 90% for 5-fold cross-validation. This implies that people use different sets of words for a negative deceptive review than for a positive deceptive review. Because of this, we need to handle a negative decep-tive review differently. However, 5-fold cross-validation with a combined dataset of posidecep-tive and negative reviews comparatively performs better than 5-fold cross-validation with only positive or negative reviews. We get the highest precision (almost 93%) in 5-fold cross-validation with negative reviews and the lowest precision (nearly 70%) in “Held Out” with positive reviews.
In Table 3.2, we outline the performance of MNB classifier. With positive dataset fol-lowing the cross-validation procedure it gives 86.56% accuracy, but folfol-lowing the “Held Out” procedure it gives only 75.00% accuracy. However, with negative dataset following the cross-validation it offers 86.56% accuracy and following the “Held Out” it offers 85.50% accuracy. We get the highest precision (almost 95%) in cross-validation both with positive and negative reviews and the lowest precision (nearly 75%) in “Held Out” with positive reviews.
In text classification, Artificial Neural Networks show a promising result [28, 29]. For this reason, we also tried to check ANN performance with our dataset. We used Multi-Layer Perceptron (MLP) for classification. We build our model with Scikit-learn MLPClassifier func-tion which trains using backpropagafunc-tion. We use one and two hidden layers where the number of nodes in each hidden layer ranges from 2 to 50. This is because in our experiment, we observed that we get the best performance when we use the number of nodes in a hidden layer between 2 to 50. After this, we determine the best number of nodes that gives the best performance. Using the negative reviews dataset when we use one hidden layer, we obtain the best accuracy (86.5%) with 26 hidden nodes. Similarly, using negative and combined reviews dataset, we get the best accuracy with one hidden layers with 13 and 35 hidden nodes numbers (87.87% and 88.5%, re-spectively). We use cross-validation for this testing. In table 3.3, we show multilayer perceptron classifier's full details performance with one hidden layer. We also test with “Held Out”. For pos-itive and negative reviews, we obtain the best accuracy (77.25% and 84%), when each hidden layer contains respectively 47 and 44 nodes. The highest precision we get (93.03%) in cross-validation with negative reviews and the lowest precision we get (73.39%) in “Held Out” with positive reviews.
Similarly, we also check MLP classifier's performance with two hidden layers which is shown in Table 3.4. Using negative, positive and combined dataset, we get the best accuracy re-spectively 86%, 88.37% and 88.5%, when each hidden layer contains rere-spectively 15, 27 and 41 nodes. When we test “Held Out” with positive review dataset, two hidden layers and the number of nodes in each hidden layer is 12. This gives us 77.37%, the best result. We receive the highest
precision (almost 94%) in cross-validation with negative reviews and the lowest precision (nearly 75%) in “Held Out” with positive reviews.
Table 3.1: Automated SGD Classifier's performance with different train and test sets, including (A)ccuracy, (P)recision, (R)ecall and (F)1-score.
TRUTHFUL DECEPTIVE
Training Testing Accuracy P R F-1 P R F-1
Positive (800 reviews) Cross-Validation 89.12 90.37 87.44 88.81 87.94 90.89 89.32 Held-Out 75.50 70.00 89.00 78.00 85.00 62.00 72.00 Negative (800 reviews) Cross-Validation 88.50 92.40 83.68 87.79 85.15 93.39 89.04 Held-Out 81.62 76.00 92.00 83.00 90.00 71.00 79.00 Combined Cross-Validation 89.37 90.55 88.07 89.23 88.39 90.75 89.50
Table 3.2: Automated MNB classifier's performance with different train and test sets, including (A)ccuracy, (P)recision, (R)ecall and (F)1-score.
TRUTHFUL DECEPTIVE
Training Testing Accuracy P R F-1 P R F-1
Positive (800 reviews) Cross-Validation 86.56 94.82 77.47 85.18 80.99 95.76 87.70 Held-Out 75.00 70.00 87.00 78.00 83.00 63.00 72.00 Negative (800 reviews) Cross-Validation 86.56 94.82 77.47 85.18 80.99 95.76 87.70 Held-Out 85.50 85.00 83.00 84.00 84.00 85.00 85.00 Combined Cross-Validation 86.56 94.82 77.47 85.18 80.99 95.76 87.70
Table 3.3: Automated MLP classifier's performance using one hidden layer with different train and test sets, including (A)ccuracy, (P)recision, (R)ecall and (F)1-score.
TRUTHFUL DECEPTIVE
Training Testing Accuracy P R F-1 P R F-1
Positive (800 reviews) Cross-Validation 87.87 89.66 85.36 87.42 86.16 90.36 88.17 Held-Out 77.25 73.39 85.50 78.98 82.63 69.00 75.20 Negative (800 reviews) Cross-Validation 86.50 93.03 78.74 85.13 81.77 94.46 87.53 Held-Out 84.00 80.49 89.75 84.86 88.41 78.25 83.02 Combined Cross-Validation 88.50 92.53 83.84 87.92 85.23 93.23 89.01
Table 3.4: Automated MLP classifier's performance using two hidden layer with different train and test sets, including (A)ccuracy, (P)recision, (R)ecall and (F)1-score.
TRUTHFUL DECEPTIVE
Training Testing Accuracy P R F-1 P R F-1
Positive (800 reviews) Cross-Validation 88.37 89.65 86.73 88.09 87.14 90.18 88.55 Held-Out 77.37 74.49 83.25 78.63 81.01 71.50 75.96 Negative (800 reviews) Cross-Validation 86.00 93.81 76.99 84.38 80.69 95.18 87.20 Held-Out 84.25 80.71 90.00 85.10 88.70 78.50 83.28 Combined Cross-Validation 88.50 91.79 84.64 88.04 85.76 92.23 88.90
3.4 Visualization of POS Frequency
In this section, we try to visualize in Figure 3.1 and 3.2 different parts of speech (POS) present in positive, negative, truthful and deceptive reviews.
Figure 3.1: Parts of Speech(POS) frequency distribution over positive and negative review.
3.5 Working Procedure and Results
We build two groups of datasets, positive and negative, and another truthful and decep-tive review. Using all of the posidecep-tive and negadecep-tive reviews, we determine the most frequently used POS. To do that, we use Python's NLTK package. First, we tokenize all of the reviews and
re-Figure 3.2: Parts of Speech(POS) frequency distribution over truthful and deceptive review. universal tagset. Using FreqDist function of NLTK we find out the most frequently used POS. We only consider the following parts of speech: noun, verb, adj, adv, pron, and det for our experi-ment. We do not consider other POS with an overall percentage of presence less than 3%.
We observe that people use nouns more frequently than other parts of speech. From vi-sualizing Figures 3.1 and 3.2, we can say that for positive and truthful reviews people use nouns and adjectives more than other POS. For negative and deceptive reviews, they use verb, adv, pron and det more frequently than other POS. For positive reviews, people use nearly 3% more nouns than for negative reviews. A similar result is found with adjectives. Verbs were used 6% less in positive reviews than in negative reviews. Between truthful and deceptive reviews, maximum dif-ference of the percentage of different POS is only 2%. From the above results, we can say that it is hard to label a review using only POS frequency.
4 TOPIC MODELING BASED APPROACH
Topic modeling is an approach for discovering topics from a large corpus of text docu-ments. The most common output of a topic model is a set of word clusters and a topic distribu-tion for each document. Each word cluster is called a topic and is a probability distribudistribu-tion over words in the corpus. Topics are aspects that refer to the attributes and components of an entity. Aspects are the most important parts to get inside a document. From looking at aspects, we can deduce what is the document about. We assume that aspects of deceptive reviews will be similar. Same goes for truthful reviews. For example, in the sentence “The picture and xsound quality of Samsung-HDTV are great.”, picture and sound are aspects of the Samsung-HDTV. As per [3], the advantage of topic modeling is that it can automatically extract aspects and put them into separate groups. For example, it can extract and group organization, cleanliness, and comfort under one topic in a hotel review dataset.
In this section, we present an approach that uses Topic Modeling and Support Vector Ma-chines (SVM) to detect both deceptive positive and deceptive negative reviews. Our approach uses only the topic words that are generated by topic modeling, compared to the existing ap-proaches, e.g. [6, 9], that use all the words in the dataset.
While earlier works, e.g. [6, 18, 30], explored different characteristics of reviews and re-viewers, such as total number of reviews left by a reviewer, date of a review relative to when a product first became available, etc., the usefulness of applying topic modeling on spam review detection has not been fully investigated. There are two basic topic models. One is called proba-bilistic Latent Semantic Analysis (pLSA) [31] and the other is called Latent Dirichlet Allocation (LDA) [27]. They are both unsupervised methods. pLSA learns latent topics by performing a ma-trix decomposition on the term-document mama-trix. But LDA is a generative probabilistic model that assumes a Dirichlet prior over the latent topics. In practice, pLSA is much faster to train than LDA but has lower accuracy. That is why we choose LDA over pLSA. LDA assumes that each
document consists of a mixture of topics and each topic is a probability distribution over words. It is a document generative model that specifies a probabilistic procedure by which documents are generated.
In [26], the authors proposed a generative LDA-based topic modeling approach for fake review detection. Their approach is a variation of LDA that aims to detect subtle differences be-tween the topic-word distributions of deceptive reviews versus truthful reviews. They used prob-abilistic prediction to figure out how likely a review should be treated as deceptive or truthful. However, in our research, we use LDA-based semisupervised learning to build our model for de-tecting deceptive and truthful reviews. We use LDA to extract relevant data from the dataset to be used as features for SVM.
The researchers in [5, 6, 24] applied n-gram based text categorization techniques for ex-tracting all the words from the corpus to use them as features. Then they used these features in different machine learning techniques, such as SVM [6], logistic regression [24], and naive Bayes [5], to identify deceptive reviews. In our approach, we do not use all words as feature. We only use the topic words generated by LDA. We chose to use SVM because it was found to com-paratively perform better than other data mining algorithms in text classification [32].
In our proposed approach, we follow a two-step process where we first extract the fea-tures using LDA topic modeling, and then use these extracted feafea-tures in SVM for spam review detection.
We summarize our approach in Figure 4.1. Input to LDA is a dataset consisting of all the reviews. The LDA procedure requires the user to set two parameters specifying the number of components (n component) and the number of top words (n top words). Number of components represents the total number of topics to be generated by LDA and number of top words represents the total number of top words that will be generated for each topic. Output from LDA is topic words (a.k.a. top words).
Figure 4.1: System Overview
4.1 Proposed Approach & System Implementation
In the second step, we use the topic words as features for SVM. To be more specific, a linear SVM with stochastic gradient descent is used to build the model. The new reviews are then classified by the model as truthful or deceptive.
To conduct our experiment, we used Ott et al.'s publicly available dataset of opinion spam [6]. We have described the data collection procedure in the Data Collection section.
The outline of our approach for detecting spam reviews using LDA and SVM is shown in Algorithm 2. It is similar to Algorithm 1. The most important difference is the use of LDA for topic modeling. In line 2, we utilize LDA to get the topic modeling words from all the docu-ments. Then we use these topic words as features in SVM, instead of all the words from the train-ing dataset.
Algorithm 2Algorithm for detecting spam reviews using LDA and SVM 1: documentsList= input dataset
2: topicWordList= get topic words from documentList using LDA 3: fori= 1to5do
4: training data, testing data = Split documentsList
5: tokenize = CountVectorizer(topicWordList).fit transform(training data) 6: tfidf = TfidfTransformer().fit transform(tokenize)
7: classifier = SGDClassifier().fit(tfidf) 8: prediction = classifier.predict(testing data) 9: end for
For the LDA procedure, we set the number of components to 2, 3, or 4 because a review can be “truthful or deceptive”, “truthful, deceptive, or neutral”, or “positive, truthful-negative, deceptive-positive, or deceptive-negative”. We started with 50 top words for each topic. Then, for each new experiment we increased the number of top words by 50 and continued this process for up to 1000 top words per topic. A sample output from LDA with 2 components and 20 top words is as follows:
Topic #1: hotel chicago room stay staff great service stayed time place recommend make
like business visit friendly just city definitely enjoy
Topic #2: room hotel great stay night location bed chicago staff nice good walk clean
stayed bathroom comfortable michigan view service restaurant
Below are samples of two reviews with the words that appear in either Topic #1 or Topic #2 shown in bold. The first review is a sample of a positive truthful review while the second is a sample of a positive deceptive review.
1. I was completely blown away by thishotel. It was magnificent. I got agreatdeal and I am so happy that Istayedhere. Before arriving I was nervous as I had read a few bad reviews about the impact the renovation was having on peoplesstay, for example very noisy. How-ever, whilst the renovation was still going on and the gym was not open nor therestaurant, it made no difference to me. Myroomwas huge,bathroomwas spacious with excellent water pressure,bedwas perfect and theviewwas amazing. Hotel is so close to thegreat shops of Magnificent Mile, plus a comfortable walking distance to Hancock tower and Mil-lennium Park.
2. After recent weekstayat the Affinia Hotels, I can definitely say i will be coming back. They offer so many inroomamenities and services, Just a very comfortable and relaxed place to be. My most enjoyable experience at the AffiniaHotelwas the amazing customiza-tion they offered, I would recommend Affinia hotels to anyone looking for a nice place to stay.
4.2 Performance
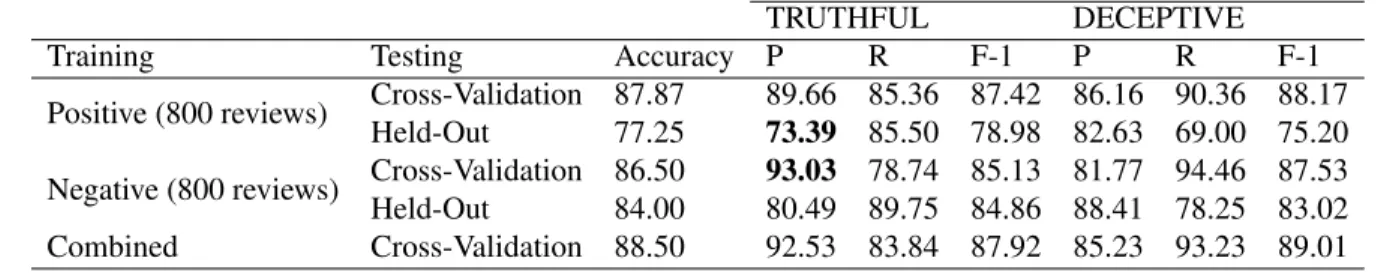
In this section, we report the deception review detection performance with our proposed approach. In Figure 4.2, we show the effect of the number of components (i.e. topics) on the ac-curacy. We used the whole dataset for this experiment. We observed similar accuracy for decep-tion detecdecep-tion with number of topics set to 2, 3, or 4 as can be seen in Figure 4.2. However, more topics means more total number of top words (i.e. features for SVM). This can be seen in Figure 4.2 where the accuracy increases as the number of top words in a topic increases. For example, 600 top words per topic provide an accuracy of about 87%. If we use 2 topics, we will need 600 * 2 = 1200 total top words. If we use 3 topics, we will need 600 * 3 = 1800 total top words. Like-wise, for 4 topics, we will need 600 * 4 = 2400 total top words. Therefore, we decided to use n component = 2 (i.e. 2 topics), because this means fewer features and reduced dimensionality for SVM in addition to better accuracy for the same total number of top words as compared to 3 or 4 topics.
Figure 4.2: Impact of number of components on accuracy
If we look at the top words in Topic #1 and Topic #2 in the previous Section, we find some words that appear in both topics. For example “hotel” and “room” appear in both topics.
We use the termduplicate topic wordsto mean topic words that appear in both topics. We also observe the same word (e.g. stay) appearing in different forms as topic words in the same or dif-ferent topics (e.g. stay and stayed both appear in Topic #2). We conducted experiments to check how these words are affecting our model's performance. We used lemmatization to convert the words in a review/document to their base forms. We preprocessed the dataset in four different ways before sending to LDA for topic modeling or before using SVM for classification as fol-lows: 1) Without lemmatization and keeping duplicate topic words, 2) With lemmatization and keeping duplicate topic words, 3) Without lemmatization and removing duplicate topic words, and 4) With Lemmatization and removing duplicate topic words.
Figure 4.3, shows the performance of our model on the positive reviews datasets. Initially, lemmatization resulted in a slightly better performance accuracy than without lemmatization. But after about 530 top words, the accuracy is about the same or slightly better without lemmatiza-tion. The highest accuracy we receive with lemmatization is 87.37% and without lemmatization is 88.12% when the number of top words are 400 and 850, respectively. This experiment shows that lemmatization does not have much effect on improving performance. Figure 4.3 also shows that when we removed the duplicate words that appeared in both topics, our model's accuracy decreased by 5%-10%. Figure 4.4 shows similar results when we ran the experiments on the neg-ative reviews dataset. So we proceeded with the experiment without lemmatization and without removing duplicate topic words.
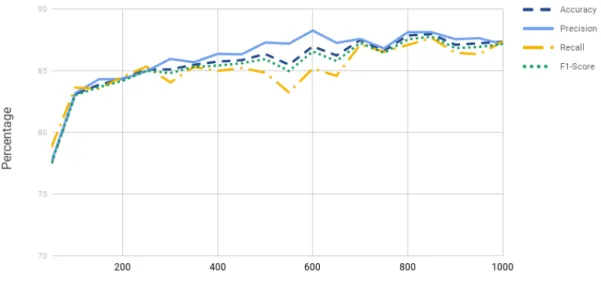
Figure 4.5 and Figure 4.6 show the performance of our model on the positive reviews dataset. The accuracy varies from 84% to 88% for top words between 200 and 1000. In compar-ison, Ott et al. [6] achieved 89% but they considered all the words of the dataset as features with dimensionality of approximately 5476. Nonetheless, our model's accuracy is based on a maxi-mum dimensionality of 2000.
Our model performs similarly on the negative reviews dataset as can be seen in Figure 4.7, Figure 4.8 and Table 4.1. With regards to precision, recall, and F1-score for truthful reviews
Figure 4.3: Impact of lemmatization and the presence/removal of duplicate topic words on the accuracy of the model on thepositivereviews dataset
Figure 4.4: Impact of lemmatization and the presence/removal of duplicate topic words on the accuracy of the model on thenegativereviews dataset
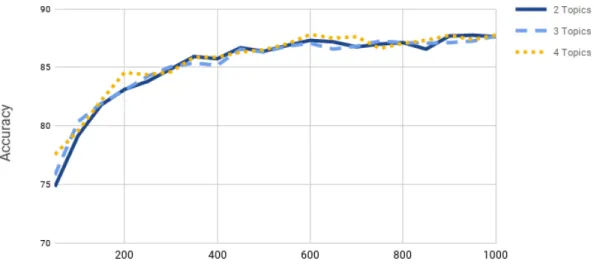
and deceptive reviews, Figures 4.5 and 4.6 show that increasing the number of top words con-tributes positively to higher precision, recall, and F1-score. This validates that our proposed model is working properly since accuracy, precision, recall, and F1-score results are consistent. Simi-larly, Figures 4.7 and 4.8 show the effectiveness of our model on negative reviews.
model-Figure 4.5: Accuracy, Precision, Recall and F1-Score oftruthful reviewsof spam review detec-tion using topic modeling and SVM on thepositivereviews dataset.
Figure 4.6: Accuracy, Precision, Recall and F1-Score ofdeceptive reviewsof spam review detection using topic modeling and SVM on thepositivereviews dataset.
ing. Our research results show that not all words in a document are needed to tag a review as truthful or deceptive. Topic modeling was used successfully to find the important words to use as features. Our approach reduces the number of features and hence dimensionality for SVM. Our model detects deceptive reviews with accuracy ranging from 84% to 88%. The accuracy we
Figure 4.7: Accuracy, Precision, Recall and F1-Score oftruthful reviewsof spam review detec-tion using Topic Modeling and SVM on thenegativereviews data set.
Figure 4.8: Accuracy, Precision, Recall and F1-Score ofdeceptive reviewsof spam review detection using Topic Modeling and SVM on thenegativereviews data set.
achieved is comparable with other approaches that use all the words in a dataset as features. The research results show that not all words in a document are needed to tag a review as truthful or deceptive.
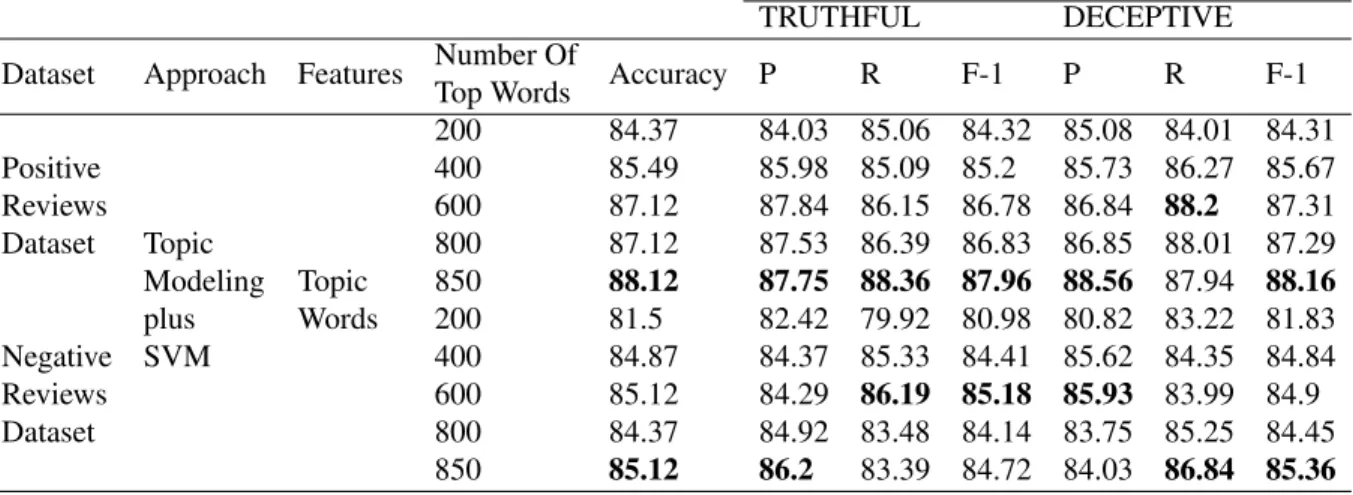
Table 4.1: Classifier performance with positive and negative reviews dataset on 5-fold cross-validation experiments and reported precision, recall and F-1 score.
TRUTHFUL DECEPTIVE
Dataset Approach Features Number Of
Top Words Accuracy P R F-1 P R F-1
Positive Reviews Dataset Topic Modeling plus SVM Topic Words 200 84.37 84.03 85.06 84.32 85.08 84.01 84.31 400 85.49 85.98 85.09 85.2 85.73 86.27 85.67 600 87.12 87.84 86.15 86.78 86.84 88.2 87.31 800 87.12 87.53 86.39 86.83 86.85 88.01 87.29 850 88.12 87.75 88.36 87.96 88.56 87.94 88.16 Negative Reviews Dataset 200 81.5 82.42 79.92 80.98 80.82 83.22 81.83 400 84.87 84.37 85.33 84.41 85.62 84.35 84.84 600 85.12 84.29 86.19 85.18 85.93 83.99 84.9 800 84.37 84.92 83.48 84.14 83.75 85.25 84.45 850 85.12 86.2 83.39 84.72 84.03 86.84 85.36
4.3 Performance with Unbalance Dataset
Most of the real world datasets are unbalanced. Which is why we check our model's per-formance with unbalance dataset. To create unbalance dataset, we keep all of the positive reviews and randomly select negative reviews from 10% to 90% of the negative reviews. For each time of unbalanced dataset creation, we decrease negative reviews by 10% and record our model's perfor-mance. If we look at Table 4.2, we can see the lowest accuracy is 84.53%. We get the lowest ac-curacy when we create unbalance dataset with 100% positive reviews and 60% negative reviews from the whole dataset. The highest accuracy is 88.54% which we get when we create unbalance dataset with 100% positive reviews and 20% negative reviews. It also gives us the highest preci-sion of 88.54%.
Similarly, we create unbalance dataset by keeping all the negative reviews and randomly selecting positive reviews from 10% to 90% of the positive reviews. For each time of unbalanced data creation, we decrease positive reviews by 10% and record our model's performance in Ta-ble 4.3. We receive the lowest accuracy (85.14%), when we create unbalance dataset with 70% positive and 30% negative reviews. The highest accuracy is 92.30%, when we create unbalance dataset with 30% positive and 100% negative review dataset. It also provides us the highest
preci-sion which is 91.73%.
Finally, after analyzing our model's performance from Table 4.2 and Table 4.3, we can say that it performs similar to the balanced dataset. Thus, we can claim that our proposed approach works both with balance and unbalance dataset.
Table 4.2: Classifier performance with unbalanced reviews dataset with majoritypositivereviews on 5-fold cross-validation experiments and reported accuracy, precision, recall and F-1 score.
TRUTHFUL DECEPTIVE
Positive review Negative review Accuracy P R F-1 P R F-1
100% 90% 86.05 88.27 84.35 86.12 83.94 87.63 85.62 100% 80% 86.52 87.75 88.00 87.72 85.30 84.61 84.78 100% 70% 86.17 88.44 87.63 88.01 82.72 84.27 83.43 100% 60% 84.53 87.11 88.19 87.61 79.82 78.37 78.99 100% 50% 84.83 86.42 91.50 88.77 81.07 72.72 76.22 100% 40% 86.60 89.24 92.17 90.66 78.88 72.76 75.59 100% 30% 87.69 88.61 96.13 92.21 83.55 59.23 69.16 100% 20% 88.54 89.41 97.73 93.35 78.77 42.28 54.68
Table 4.3: Classifier performance with unbalanced reviews dataset with majoritynegative re-views on 5-fold cross-validation experiments and reported accuracy, precision, recall and F-1 score.
TRUTHFUL DECEPTIVE
Positive review Negative review Accuracy P R F-1 P R F-1
90% 100% 86.71 88.40 82.79 85.37 85.48 90.39 87.76 80% 100% 87.08 86.02 84.20 85.06 87.73 89.43 88.55 70% 100% 85.14 85.73 76.93 80.79 85.05 91.18 87.87 60% 100% 86.09 86.83 74.24 79.79 85.79 93.40 89.34 50% 100% 86.00 84.27 71.71 77.11 86.78 93.44 89.88 40% 100% 85.35 78.15 68.98 72.69 87.93 92.36 89.98 30% 100% 92.30 91.73 72.58 80.80 92.46 97.97 95.13 20% 100% 89.16 78.64 47.80 59.09 90.28 97.51 93.73
4.4 Performance with Only Topic Sentences
A topic sentence is a sentence that contains at least one topic word. For example,Hotel is a topic word. So the following sentence which is taken from a real hotel review: “The Omni ChicagoHotelI am a business woman who travels a great deal out of a month, therefore, my
ac-commodations must meet the highest standards.” will be considered as a topic sentence. The fol-lowing experiment consists of three steps. In the first step, we use topic modeling for extracting topic words from all of the reviews. In the second step, we remove all of the non-topic sentences from all the reviews.
Example: Output of topic modeling when n component = 2 & n top words = 10.
Topic#1:hotel room great chicago stay location nice staff stayed service
Topic#2:hotel chicago stay room staff great rooms service stayed time
Before Sentence Removal: The Omni Chicago Hotel I am a business woman who trav-els a great deal out of a month, therefore, my accommodations must meet the highest standards. I was booked for a stay at The Omni Chicago Hotel, located in what is referred to as ’ The Mag-nificent Mile ’ in the greater Chicago area. ’ MagMag-nificent ’, it was! The beautifully red-bricked sky scraper was indeed a breath- taking sight and upon entrance, I had a felling of warmth from the very hospitable welcoming staff. I was impressed with the hotels special rates offered dur-ing prime business hours and the guest rooms ranged everythdur-ing from ’ The Presidential Suite to The Governors Suite ’. I accepted a more humble room as I would not need to spend very much time there during the day. I did stay inside most nights and the amenities were more than satis-factory. I enjoyed the very spacious exercise room and afterwards, I would take a quick dip in the pool. I toured the hotel as my niece is planning her wedding and just so happens to live close to the hotel. The ’ Chagall Ballroom ’, was elegant enough for such an occasion and reeked of pure luxury. I was given very adequate maps and directions to and from as my business was conducted throughout the city. That was a life saver. All in all, my experience was more than favorable and I would definitely stay there again along with recommending it to anyone.
agreatdeal out of a month, therefore, my accommodations must meet the highest standards. I was booked for a stay at The OmniChicago Hotel, located in what is referred to as ’ The Mag-nificent Mile ’ in the greaterChicagoarea. ’ The beautifully red-bricked sky scraper was indeed a breath- taking sight and upon entrance, I had a felling of warmth from the very hospitable wel-comingstaff. I was impressed with thehotelsspecial rates offered during prime business hours and the guest rooms ranged everything from ’ The Presidential Suite to The Governors Suite ’. I accepted a more humbleroomas I would not need to spend very much time there during the day. I didstayinside most nights and the amenities were more than satisfactory. I enjoyed the very spacious exerciseroomand afterwards, I would take a quick dip in the pool. I toured thehotel as my niece is planning her wedding and just so happens to live close to the hotel. All in all, my experience was more than favorable and I would definitelystaythere again along with recom-mending it to anyone.
In the third step, we build a classifier/model using linear SVM with stochastic gradient descent (SGD). To build this model, we use our new dataset which we get from step 2. This gen-erated model is used for measuring performance with testing data. We use 5-Fold cross-validation to measure performance.
Figure 4.9 and Figure 4.10 show the performance of our model on the positive reviews dataset. The accuracy varies from 84% to 88% for top words between 200 and 1000. After 600 top words, its accuracy remains above 87%. It gives a similar accuracy as Figure 4.5 and 4.6. The highest precision we get from Figure 4.9 is 87.99% and from Figure 4.10 is 87.96%. On the other hand, the lowest precision we get from Figure 4.9 is 77.65% and from Figure 4.10 we get 78.80%.
Similarly, Figure 4.11 and Figure 4.12 show the performance of our model on the nega-tive reviews dataset. The accuracy varies from 81% to 86% for top words between 200 and 1000. After 550 top words, the accuracy remains above 85%. It gives similar accuracy as Figure 4.7 and 4.8. The highest precision we get from Figure 4.11 is 85.99% and from Figure 4.12 we get 87.19%. On the other hand, the lowest precision we get from Figure 4.11 is 72.80% and 72.72%
Figure 4.9: Accuracy, Precision, Recall and F1-Score oftruthful reviewsof spam review detec-tion using Topic Modeling and SVM on thepositivereviews withtopi