Design and Implementation of a Web-based Internet
Performance Management System Using SNMP MIB-II
By Seong Jin Ahn,
ŁSeung Keun Yoo and Jin Wook Chung
This article is aimed at defining items of analysis using SNMP MIB-II for the purpose of analyzing the performance of Internet-based networks running on TCP/IP protocol, and then utilizing these items, in conjunction with various Web technology and JAVA, to design and implement a Web-based interface of a management system to analyze the performance of the Internet. Copyright1999 John Wiley & Sons, Ltd.
Introduction
W
ith the rapid development of information technology, TCP/IP-based Internet is now being used widely in various fields, providing the end user with a basic structure for distributed service around the globe. Such an evolution of Internet, coupled with the increasing traffic associated with an ever broader user base, is seriously impairing network performance and is calling for a need for a complete redesign of the system. It is therefore very timely to ensure a good performance management of the Internet to sustain a stable network.1,2Performance management allows the system manager to maintain an optimum system per-formance by collecting, analyzing and making a decision on, the traffic of the overall network, sub-network, and particular nodes. Furthermore, it provides the user with vital information regarding future expansion or modification of the system. For the maintenance of communication equipment in the Internet, SNMP (Simple Network Management
Protocol) is used to exchange system management information between the manager system and the managed system.
Moreover, in today’s complex network environ-ments, the manager must bear the inconvenience of using a combination of tools of at least two different types and of course only those which are supported in the system or network he/she is managing. An additional problem is the limitations of scalabil-ity of the currently used centralized management tools, which make it very hard to handle very large networks. In order to solve these problems, one needs to utilize Web-related technology or other Internet-based technology such as JAVA to create a system management application which can effec-tively overcome the limits of existing management tools as technology.3,4
For this paper, items of analysis that are of interest were defined and sorted from the analysis parameters for Internet performance management which in turn were extracted from SNMP MIB-II. Based on these items was then formulated, with the help of Web-related technology and JAVA,
Seong Jin Ahn received his Ph D from the Sung Kyun Kwan University in 1998. His research interests include Web-based network management, network design and traffic forecasting.
Seung Keun Yoo graduated from Sung Kyun Kwan University, Korea, in 1998. He is currently a MS candidate in the same university. Jin Wook Chung received his Ph D from the Seoul National University in 1991. He is a Professor in the School of Electrical and Computer Engineering, Sung Kyun Kwan University, Korea.
Ł
Correspondence to: Seong Jin Ahn, Information and Communication Laboratory, School of Electrical and Computer Engineering, Sung Kyun Kwan University, 300 Chunchun-dong Jangan-gu, Suwon City, South Korea.
a visualization system, that is, a Web interface of the Internet management system, carrying out the actual management task. Moreover, as the interface is based on a client/server structure, a protocol by the name of MATP (Management Application Transfer Protocol) has been defined for the purpose of exchanging messages between the client and the server and between the server and the analysis system executing accumulative analysis. As a result, it was possible to conceive with the help of JAVA and other Web-related technologies, a network management scheme that is completely platform independent. A systematic analysis of the collected management information and presentation of the results in the form of a
graph allow the user to easily access and use the data obtained.5,6
Related research to this paper includes the development of a private network/intranet traffic analysis system using Web technology and RMON MIB and a Web-based service application analysis system aimed at analyzing TCP/IP traffic with the objective to study the types and the frequency of TCP/IP network services.7
Internet Performance
Management
Performance management seeks to inspect the actions of the managed system and increase the
Analysis type Analysis circle Analysis item
Real-time analysis
Internet performance analysis
Link utilization, availability, interface packet transmit/receive rate, I/O traffic rate, broadcast traffic rate, system packet I/O rate, packet forwarding rate
Internet fault analysis Error receive rate, interface packet error
rate, system packet error rate, system memory load rate, packet forwarding error rate, routing error rate
Management traffic analysis
Management traffic utilization Elementary
analysis
Internet performance analysis
Link utilization, availability, system down count,
Detailed analysis Internet synthesis
analysis
Synthesis analysis, link analysis, device analysis, device application analysis Internet timely analysis,
monthly analysis, weekly analysis, daily analysis
Error receive rate, interface packet
transmit/receive rate, interface packet error rate, input traffic analysis, output traffic analysis, broadcast traffic analysis, system memory load rate, packet forwarding rate, routing error rate
Internet comparative analysis
Inbound/outbound byte,
inbound/outbound packet, broadcast traffic analysis (broadcast/unicast), byte per packet (transmit/receive), normal/abnormal packet analysis, system packet error rate, system packet error I/O analysis
Internet term
comparative analysis
Inbound/outbound byte,
inbound/outbound packet, broadcast traffic analysis (broadcast/unicast), byte per packet (transmit/receive), normal/abnormal packet analysis, system packet error rate, system packet error I/O analysis
efficiency of communications. It involves collecting data on such performance indicators as utilization and collision rate for the overall network, subnet-work, specific segments and nodes. The collected data are then analyzed to determine the current performance of the network and are used to main-tain an optimum performance. These data also provide vital information during system expansion or modification.
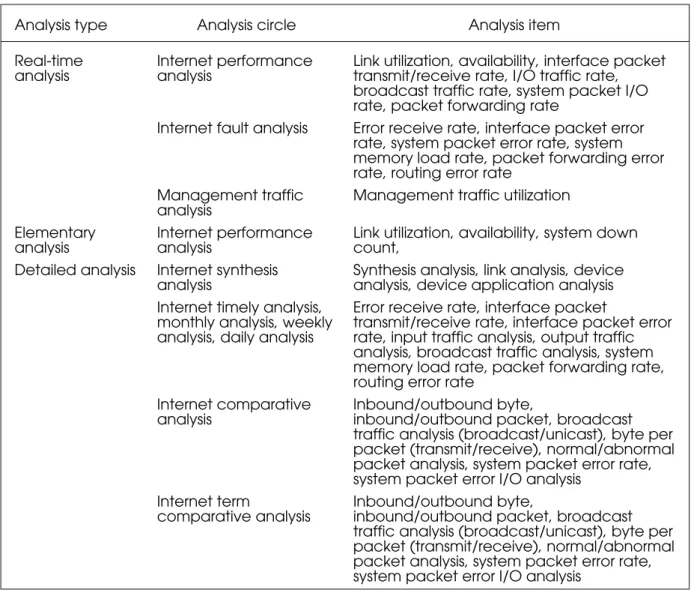
The items of analysis for the performance man-agement of the Internet are formulated using the diverse performance analysis parameters extracted from SNMP MIB-II. These items are classified and grouped according to the type of analysis.8
Real-time analysis is used when one wishes to analyze the performance of the Interbased net-work equipment at the moment of request. By contrast, elementary and detailed analyses involve the analysis of data collected over a given period of time. Elementary analysis deals with measuring elementary indicators for the analysis of Internet performance such as utilization and availability over a period specified by the user. Detailed analy-sis is used to obtain a comprehensive and detailed analysis of the performance of the Internet-based managed system over a given period of time.9
Table 1 is an explanation of the MIB object analysis items concerned with the above analysis items.
Design and Realization of the
Web Interface
—Overview of the Design—
The Internet performance management system selects those managed systems for which the per-formance on the Internet of the network equipment will be managed. Information on these selected systems will then be collected and analyzed. The results will be used to ensure a stable network by enabling a smooth traffic flow. The system has a client/server structure with the client being responsible for the user interface and the reporting of the results and the server being responsible for the real-time analysis of each analysis item and sending the results to the client. Depending on the management objective, an accumulated analysis system can be used whereby data collected over a specified duration can be utilized to carry out a
performance analysis of the equipment over that very duration.
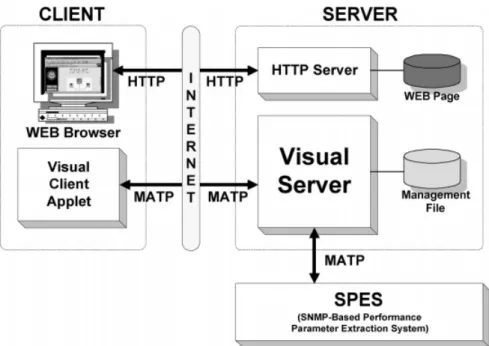
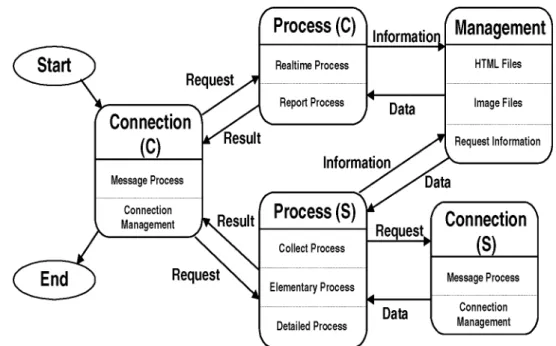
The Internet performance management system mentioned in this paper specifically means the Web-based graphic user interface with the assis-tance of which a distant user connects himself to the Internet management system via a web browser and carries out a series of activities regarding the performance of the concerned network equip-ment. Figure 1 is a structural diagram of the entire Internet performance management system which consists of a visualization client functioning as client; a visualization server functioning as server; and an accumulated analysis system (SPES: SNMP-based Performance Parameter Extraction System) analyzing the performance of the system over a specified period of time.
—Visualization Client—
Structure
— The visualization client operates in a remote web browser and serves as user interface as well as a system that responds to user demands. It is composed of a module that has for its function the establishment of connection with the server, a message processing module, a real-time processing module, a collection demand module, an accumulation analysis module, a graph processor and a report processor. The function of each module of the visualization client system is as follows as illustrated in Figure 1.The connection management module has for its function the establishment of connection with the visualization server system as well as transmission of messages containing the user’s requests to the server and receiving the server’s response mes-sages. These messages are then processed by the message processing module which creates the mes-sages requested by the user, analyzes the response messages from the visualization server and trans-mits them to the relevant processing modules. The real-time processing module is concerned with processing the user’s request to analyze the current performance of the network equipment. It is thus a user interface that accepts the user’s request: it extracts the necessary data from the server’s response to produce a graph; and receives the request from the user to terminate data output or to disconnect from the visualization server. The
Figure 1. Structural diagram of the entire Internet performance management system
Figure 2. Overall structure of the visualization client system collection demand module is an user interface that
has the role, of requesting of data collection to the accumulation analysis system for the purpose of carrying out an analysis with the accumulated data obtained by polling specific network equipment
over a specified amount of time. The module is also responsible for sending necessary information to the visualization server and browsing through the material whose collection has been requested. The accumulation analysis method serves as a
user interface for elementary and detailed analysis of network equipment over a specified duration on information that has been accumulated by the collection demand module. The module displays the results in the form of a graph or a table depending on the preferred type of analysis. The graph processor is called for a graph-based report of results. The graph processor generates graphs according to items of analysis and consists of sub-modules responsible for generating line, pie or bar graphs depending on the item of analysis and the user’s request. The report processor transforms the output graphs generated upon the request for each analysis into a GIF image and accordingly creates a web page for report display purposes. The proces-sor also handles the task of calling the response of the accumulation analysis module from the server.
Basic operations
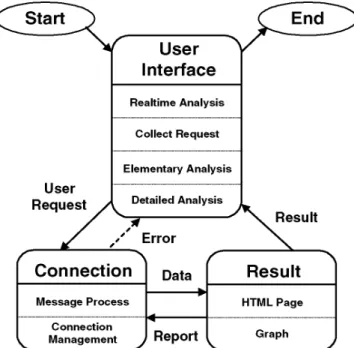
— From a functional perspec-tive, the visualization client system for Internet performance management provides the user with four different services. Specifically, they are: the function of real-time analysis for, as the name implies, the real-time analysis of a network per-formance; the two functions of elementary and detailed analyses for the performance analysis of the network over an extended period of time; andthe function of collection demand for the collec-tion of the required data. The visualizacollec-tion client system provides the user with several interfaces for the above services. To use the desired service, the user inputs information such as IP address and community name to the corresponding interface and requests the desired service. The part respon-sible for the communication with the visualization server creates a message based on the informa-tion provided by the user. This message is then transmitted via the transmission module to the visualization server. Finally a reception is made in the form of a message or data as a response from the visualization server. If an error occurs while creat-ing a message or durcreat-ing transmission to and from the visualization server, the user is notified of the error and is asked to input new information. The analysis result data obtained through the connec-tion with the visualizaconnec-tion server are then shown to the user in the form of either a graph or an HTML document depending on the type of analysis item. The result is displayed on-screen after the data is processed in the relevant processors mentioned above. The user service for performance analy-sis is made available by the above processes. The basic operations of the visualization client system is illustrated in Figure 3.
—The Visualization Server—
Structure
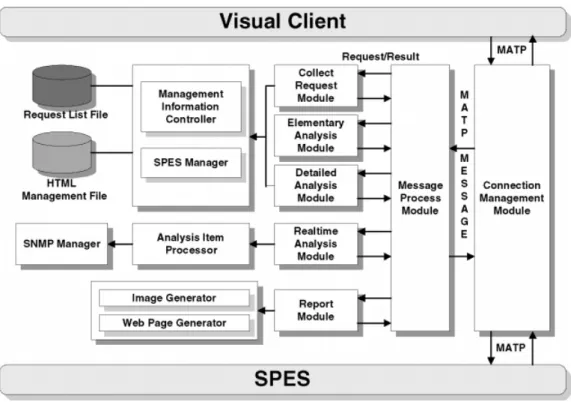
— The visualization server processes the request from the client and the related tasks of: establishing connection, creating messages; han-dling and transmitting requested data; process-ing by item of analysis; establishprocess-ing connection with and transmitting requested information to the accumulation analysis system; image creation; creation of Web pages for analysis results; and management of requested information. Figure 4 is an illustration of the overall structure of the visu-alization server. The functions of the constituent modules are as follows.The SNMP manager carries out the specific func-tion of the SNMP manager system which polls related MIB information for the purpose of the server’s extraction of analysis information upon the request message for a real-time analysis. The connection management module is in charge of establishing connection with the client as well as receiving demand messages from the client. The module also processes and manages necessary connection to send reply messages. Furthermore, it has also the function of transmitting messages
requesting collection of data and accumulation analysis to the accumulation analysis system. The message processing module has the function of processing received messages according to the for-mat requested by the system administrator. The module also analyzes the message before sending to the relevant processor. The analysis module is in charge of real-time processing of each and every user service and consists of modules designed to handle four types of user services. The real-time analysis module has for its function the real-time processing of request by the user for analysis of the current state of the system. In order to extract values for the item of analysis requested from the client, the MIB information data are polled by calling the SNMP manager system. The data obtained in this fashion are then sent to the anal-ysis item processor with the result transmitted to the client at each polling. The collection demand module processes the request for data collection for the analysis of the accumulated data that are polled over a specified duration for a given network’s resources. The module is also responsi-ble for transmitting data requested by the system administrator to the accumulation analysis system.
The module also receives replies from the accu-mulation analysis system regarding the result of set-up following the request for data collection. The accumulation analysis module’s tasks can be divided into elementary and detailed analyses. The module carries out the function of processing the request for elementary and detailed analyses of network resources set up over a specified amount of time for information accumulated by the col-lection demand module. Analysis of accumulated information is relegated to the accumulation anal-ysis system by sending a request message. After receiving the results of analysis, the module reports to the client. The report module’s task is to tabulate the graph format results analyzed by the manager at the client into a Web page. The analysis item processor extracts analysis results from the man-agement information polled according to item of analysis by the real-time processing module. The SPES manager is a module responsible for the pro-cessing of requests made by the data collection module and the accumulation analysis module. It accomplishes this task through communication with the accumulation analysis system and also handles such functions as the management of connection with the accumulation analysis sys-tem, creation of request messages, management of received messages, data buffering and flow control on top of the function of sending the data analyzed by the accumulation analysis system to the request-ing modules. The image generator generates a file out of the GIF image received from the client and transmits the file information to the Web generator, The Web page generator presents the results of the elementary analysis, in a tabular form, on a Web page. It is also responsible for the generation of Web pages tailored to the type of the analysis item in real-time and detailed analyses. It also responds to requests made by the graph processor. The man-agement information controller has for its function the generation of HTML and GIF files as well as the recording, deleting and viewing of these files.
Basic operations
— The visualization server consists of three subparts which are responsible for the transmission of messages with the visual-ization client, the transmission of messages with the accumulation analysis system and the process-ing of various user services respectively. Upon receiving a message from the visualization client, the visualization server analyzes the messageand determines to which user service it belongs before it transmits the request information to the relevant service processor. Each service pro-cessing part receives the pertaining information, and executes the processes of real-time analysis, collection demand, elementary analysis, detailed analysis and reporting. The results are sent to the connection-related module which in turn creates a message directed to the client. In real-time anal-ysis, SNMP is used to poll performance analysis information of the equipment whose analysis is requested by the user. The performance informa-tion is derived from this analysis informainforma-tion and is sent to the visualization client. The report processor receives from the visualization client, information and image data for the report and creates an image file and a report file. Information pertaining to file management is then stored. The created files are sent to the visualization client via HTTP and are displayed to the user in the form of a Web page. For the processing of collection demand, the message received from the visualization client is transmit-ted to the accumulation analysis system where a collection is requested. The result is transferred back to the visualization client. Elementary anal-ysis processing is carried out by transmitting the request message from the visualization client to the accumulation analysis system. The analysis results received thereafter are sent to the visualization client in the form of an HTML file. The processing of detailed analysis is similar to that of elementary analysis; the request message is sent to the client after which the analysis results obtained are pre-sented in either a HTML or a graph format accord-ing to the item of analysis. When a HTML format is desired, a HTML file is created and then transmit-ted. When a graph is requested, on the other hand, the analysis data is transmitted instead in order to allow the visualization client to plot a graph. The HTML file or the image file created by the visual-ization server are managed by the file management part. The basic operations of the visualization server are schematically shown in Figure 5.
—Communication between the Client
and Server—
To analyze network traffic, the visualization sys-tem is composed of several subsyssys-tems which are namely, the client, the server and the accumulation
Figure 5. Event transition chart of the visualization server analysis system. However, as the client runs on
the system along with the web browser, it first has to communicate with the server to analyze the network resources the administrator wishes. Also, in carrying out the tasks of collection or accumulation analysis, the server communicates with the accumulation analysis system. In other words, it is necessary to establish a protocol for message exchanges among the server, the client and the accumulation analysis system. Nat-urally, such a protocol was designed and was called MATP (Management Application Transfer Protocol).10
Method of communication
— When an applet is loaded onto the administrator’s Web browser, the visualization client requests a TCP/IP connection to the server and sends the request messages of the user. The visualization client can include data and in this case, the server confirms with an acknowledgement. Following the user’s request, the visualization server makes a TCP/IP connection with the accumulation analysis system to which it will subsequently send a request message. The accumulation analysis system replies with a result message. Data can be included in the message in which case the visualization system replies with an acknowledgement. Thevisualization server transmits the results of the user’s request processed in this manner and the corresponding analysis results to the visualization client. In return, upon reception of data from the visualization server, the visualization client confirms with an acknowledgement. After receiving all data and completing the output of results, the visualization client sends a request an abort message to the server. Figure 6 illustrates the above-mentioned mechanism of the MATP Protocol.
Definition of a message
— Analysis type is a field representing the protocol currently being used to differentiate it from a possible expansion of the protocol in the future. Message type is a field that sets apart the service currently requested by the user to the visualization system. Subtype is a type to handle the details of each request in the message type. Start time and end time are fields that sets the duration of the collection period. They have to be inputted by the user and are further subdivided into fields representing the year, the date, the hour and the minute. Interval is the polling interval between the start time and the end time. This field sets how often data will be polled for storage during the collection period. Figure 7 highlights the message type describe above.Figure 6. The MATP Protocol
Result View-display
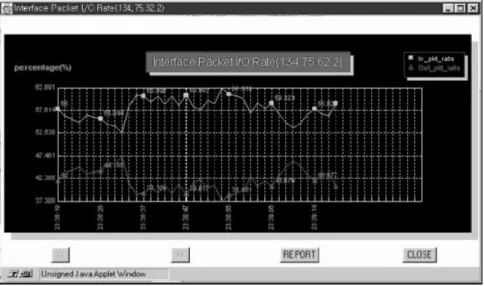
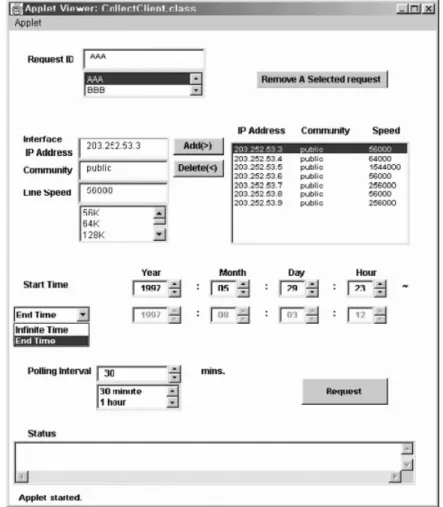
The Internet visualization system, is capable of processing four types of user requests, which are namely, real-time analysis, collection, elementary analysis and detailed analysis requests. In order to handle these four requests, the client and the server have each four request processing modules. Real-time analysis concerns the current state of an IP-based network equipment and deals with the representation of, in the form of real-time line graphs, the results of such analysis items as utilization and availability. Furthermore, if the user wishes to obtain a document version of the graph generated, the report function can be called to generate a report-style result. The result view-displays of real-time analysis are shown in Figure 8. Figure 8 is a result view-display of real-time analysis showing the current interface packet transmission rate on the router whose IP address is 134.75.62.2. The top curve represents the current ratio of incoming packets into the interface, and the bottom curve represents the current ratio of packets exiting the interface. TheX-axis represents the monitored time of polling in hours, minutes and seconds. TheY-axis represents the traffic ratio. Collection demand is a function that requests collection of data over a specified period of time for the purpose of carrying out an accumulation analysis of Internet equipment. Figure 9 illustrates this function. The user interface of the collection
demand system provides the system administra-tor with such functions as setting the collection period, and addition/deletion of managed sys-tems for analysis. The user is required to register the information on managed systems that are used or managed for the first time. It is therefore neces-sary to pre-input the management identifier — the request ID — as well as other information on the managed systems such as IP address, name of com-munity, line speed and period of collection before making a request to the server. For management setting already established, there is a convenient feature of deleting specific management identi-fiers. Figure 9 is a result of a collection request on IP addresses 203.252.53.3 to 203.252.53.9.
Elementary analysis aims to analyze elementary management items in the Internet. To this end, the data accumulated through a collection request are analyzed by item of analysis on a elementary level and then are presented to the user in a Web page format. For a more detailed result, detailed analysis can be used. Figure 10 shows the result view-display of a request for an elementary analysis.
Figure 10 is a result view-display of an ele-mentary analysis request on a router whose IP address is 134.75.62.2. The results are presented to the user in the form of Web page and include the downcount, availability and the corresponding line speed of each and every managed system con-tained in the selection request ID. Items of analysis or managed systems marked in red indicate that
Figure 9. Example of an user interface display for a collection demand
Figure 11. Example of a result view-display for a detailed analysis precautions are needed on the part of the user, and
suggests a need to run a detailed analysis of these items or systems.
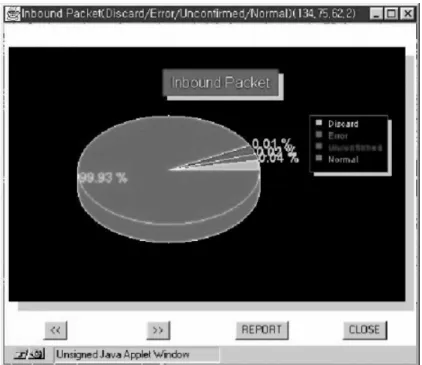
In detailed analysis, the data accumulated through a collection request are analyzed by item of analysis on a comprehensive level and then are presented to the user in the form of a graph or table for an analysis period desired by the user. A result view-display of a detailed analysis is shown in Figure 11.
Figure 11 is an output of the results of incoming packet traffic analysis on the above-managed system. The results are an arithmetic mean of analysis over a duration specified by the user and show the discard, error, unknown protocol and normal state ratios of packets heading into the interface.
Conclusion
This paper makes use of SNMP MIB-II in carrying out a performance analysis of the Internet. Specifically it utilizes Internet performance para-meters to extract such items of analysis as real-time, elementary and detailed analyses.
Furthermore, in order to provide the four user services of real-time analysis, collection demand,
elementary analysis and detailed analysis, a Web-based interface of an Internet performance management system whereby the requests for service are processed, functions are carried out according to the item of analysis and the respec-tive results are shown to the user either in the form of a graph or table, was realized with the assistance of Web-related technology and JAVA. The Web interface assumes a client/server struc-ture with the visualization client being responsible for the functions of managing the connection with the visualization server, processing user mes-sages, processing of collection/analysis requests, processing of graphs, and processing of reports. By contrast, the visualization server, in order to process the user’s request obtained through the visualization client, assumes the responsibility of carrying out SNMP management, connection management, message processing, processing of collection/analysis results, processing of reports, processing of items of analysis, SPES manage-ment, image generation, Web page creation and management information control. Moreover, to ensure a reliable communication between the visu-alization client, and the visuvisu-alization server and between the visualization server and the accumu-lation analysis items, a protocol by the name of
MATP was designed for information transmission functions. The results obtained through the sys-tem are presented via a result on-screen display and an analysis report. Furthermore, management with existing equipment and at no additional cost was possible with the use of MIB-II, an Internet management standard.
In conclusion, the research presented in this paper made it possible to realize a platform-independent management of the Internet by defin-ing items of analysis usdefin-ing SNMP MIB-II and by designing and implementing a Web-based user interface of an Internet management system capa-ble of analyzing the above items of analysis.
References
1. Blommers J.Practical Planning for Network Growth, Prentice Hall, Englewood Cliffs, NJ, 1996.
2. Deri L.Surfin’ Network Resources Across the Web, IBM Zurich Resezrch Laboratory, 1996.
3. Cornell G, CAY S, Horstmann CS.Core Java, Prentice Hall, Englewood Cliffs, NJ, 1996.
4. Hughes, Merlin H. JAVA Network Programming, Manning Publications, New York.
5. Koo JH. A Study of the design of Web-based interface for network traffic analysis system. The Graduate School of Sung Kyun Kwan University, 1997. 6. Havel O, Patel A. Design and implementation
of a composite performance evaluation model for heterogeneous network management applications, 1995.
7. Han J-S, Ahn SJ, Chung JN. Web-based perfor-mance manager system for a Web server. Net-work Operations And Management Symposium ’98, 1998.
8. Shin S-C, Ahn SJ, Chung JW. Design and Imple-mentation of SNMP-based Performance parameter extraction system. 1997 Asia-Pacific Network Oper-ations and Management Symposium, 1997.
9. Shin S-C, Ahn SJ, Chung JW. A new approach to gather network management data periodically. ITC-CSCC 97, 1997.
10. Stallings W.SNMP, SNMPv2, and CMIP: The Practical Guide to Network-Management Standards, Addison-Wesley, Reading, MA, 1993. If you wish to order reprints for this or any other articles in the International Journal of Network Management, please see the Special Reprint instructions inside the front cover.