Collaborative Software Performance Engineering for Enterprise Applications
Hendrik Müller, Sascha Bosse, Markus Wirth, Klaus TurowskiFaculty of Computer Science, Otto-von-Guericke-University, Magdeburg, Germany {hendrik.mueller, sascha.bosse, markus.wirth, klaus.turowski}@ovgu.de
Abstract
In the domain of enterprise applications, organizations usually implement third-party standard software components in order to save costs. Hence, application performance monitoring activities constantly produce log entries that are comparable to a certain extent, holding the potential for valuable collaboration across organizational borders. Taking advantage of this fact, we propose a collaborative knowledge base, aimed to support decisions of performance engineering activities, carried out during early design phases of planned enterprise applications. To verify our assumption of cross-organizational comparability, machine learning algorithms were trained on monitoring logs of 18,927 standard application instances productively running at different organizations around the globe. Using random forests, we were able to predict the mean response time for selected standard business transactions with a mean relative error of 23.19 percent. Hence, the approach combines benefits of existing measurement-based and model-based performance prediction techniques, leading to competitive advantages, enabled by inter-organizational collaboration.
1. Introduction
As of today, development and operations activities are not integrated tightly enough within one organization [1] and in most cases do not collaborate across organizations, although similar and comparable standard software components are consistently deployed. The lack of integration and the distribution of responsibilities across organizational units lead to increasing difficulties in accessing information that is required to deploy, operate and maintain applications cost-effectively and in constant alignment to agreed service levels [1]. As a consequence, the end-user experience may suffer, e.g., from poor software performance caused by inadequate capacity planning. Recent approaches
address these challenges from a software engineering perspective under the term DevOps [2], [3]. Corresponding research activities aim at increased flexibility through shorter release cycles in order to support frequently changing business processes. Therefore, DevOps enables a culture, practices and automation that support fast, efficient and reliable software delivery [4]. However, especially for enterprise applications, IT departments usually make use of existing standard software components instead of developing solutions entirely in-house [5]. In such cases, activities referred to as Dev, rather include requirements engineering, architectural design, customization, testing, performance-tuning and deployment [6]. Here, key service levels typically include performance objectives, expressed in terms of average response times, throughput or latency, in order to ensure deployment options that are aligned with actual business requirements. Since enterprise applications support vital corporate business functions, their performance is critical for success of business tasks and must never be degraded significantly [7]. As corporations tend to grow depending on an increased customer base, new product releases, new divisions and acquisitions [6], enterprise application performance needs to be monitored and managed continuously and proactively [8]. In order to evaluate and test software performance in early design stages, development teams carry out software performance engineering (SPE) activities [9]. In addition, operations teams conduct application performance monitoring (APM) [10] to control the status of running systems. In a recent technical report, [1] summarizes that the challenges of these two performance domains are often considered independently from each other. Hence, they identified the interoperability between tools and techniques of SPE and APM as a key success factor in order to support a level of technical and organizational flexibility that is required for DevOps. According to this review, performance data collected during operations provides various insights for development teams and replaces assumptions with knowledge. However, managing performance at design-time (SPE) or at run-time (APM) leads to
different challenges since, for instance, more degrees of freedom exist at design-time for the system architecture [11]. In both domains, application performance can be evaluated using either measurement-based or model-based techniques [1]. Depending on the application life cycle, measurement-based performance evaluation is conducted during regular operations or as part of stress tests or performance unit tests inside quality assurance systems [12]. While model-based approaches can be used at design-time, parametrization is often difficult and involves expert knowledge which may lead to low credibility of the obtained results. Measurement-based approaches, on the other hand, require (parts of) an implemented system and are normally limited in terms of the configuration alternatives to be considered [11] which means these are more suitable in the operation phase. The advantages of both approaches could be exploited if previously conducted measurements and derived knowledge are made available for the design of new landscapes.
Gartner summarizes the efforts to integrate monitoring data from different sources under the term IT operations analytics [13]. As an example, in [8], a knowledge base is trained to collect performance profiles of services in a SOA environment. These efforts aim at the integration of SPE and APM in a single organization (intra-organizational). In order to utilize knowledge for different organizations, the specifics of this organization have to be considered in the applied performance models. However, in a standard application environment there is no need for individual performance models and monitoring data can potentially be normalized and aggregated across several systems. Thus, knowledge that has been applied to deploy existing landscapes can be extracted and applied to new scenarios, saving costs and time. Furthermore, the risk of errors, for instance, by a service provider that conducts benchmarks, is avoided. To support intra- and inter-organizational collaboration for performance activities during design and operations phase, we follow an empirical approach that combines monitoring data from various instantiations of running enterprise applications and provides data-driven feedback for new software rollouts.
Therefore, we investigate the comparability and applicability of this data to serve as an input for a domain-specific performance knowledge base which integrates different organizations that utilize the same standard software components. Within the knowledge base, we utilize machine learning algorithms to build performance prediction models that we train using 230 million performance-related log entries of more
than 18,000 productively running application instances of a global market leading enterprise resource planning software. Thus, the approach integrates data from different sources and utilizes methods and technologies related to the field of big data and statistical analyses.
Our approach combines the accuracy of real quality assurance systems with the cost-effectiveness of performance models and data analysis. Hence, we combine the advantages of model-based (applicable at design-time) and measurement-based prediction (high accuracy of results) while not suffering from their disadvantages (difficult parameterization, required expert knowledge, need for an implemented system and sufficient training data size in operation).
The following research questions narrow down our particular interest addressed in this paper: Do performance-related monitoring logs of enterprise standard software contain information that can be extracted on a global scale in order to serve as a valuable input for new software rollouts? How accurate are performance models that have been trained on mass data from different environments but similar software? Which model types are most suitable for log-based performance prediction? Our research methodology follows the design science paradigm [14], where the developed artefact comprises the knowledge base including performance models that we evaluate in terms of accuracy and applicability in multiple iterations.
Therefore, the remainder of this paper is structured as follows: In Section 2, we provide an overview of the state of the art related to model-based and measurement-based software prediction. We conclude that both approaches have their disadvantages. A knowledge base is proposed in Section 3 to combine the advantages of model-based and measurement-based prediction as a concept and as a technical architecture. In the evaluation, presented in Section 4, a prototype of the knowledge base is implemented and applied to monitoring data of nearly 19,000 business application systems. The paper concludes with Section 5 in which the key findings of the paper as well as possible future research activities are discussed.
2. Software Performance Prediction
Software performance can be predicted using either model-based or measurement-based techniques. In order to be able to classify our approach, this section summarizes the state of the art for both techniques.2.1. Model-based Prediction
The basic idea behind model-based prediction techniques is to define an analytical performance model describing the relation between software artifacts and performance metrics. Artifacts include requirements, specification, architecture, and design as well as dynamic information about runtime behavior. Model types include queuing networks, stochastic process algebra, stochastic petri nets, stochastic processes and simulation models [15].
By incorporating expert knowledge within the performance model in combination with early design artifacts, these approaches can be applied in the development phase. Since model-based approaches are applicable before a system is implemented, e.g. by using specifications, many architectural alternatives can be evaluated leading to lower correction costs than during the operations phase [8]. While approaches can also be further used in later lifecycle phases to validate the used models and feedback information for future developments, their application in the operations phase is not as effective as in the design phase due to high time effort in construction and analysis [11].
Furthermore, model-based techniques require expert knowledge about the system to be implemented and its dependencies which may not be available especially for third-party products that are used in application system landscapes [5]. Additionally, identifying the parameters of the performance model can be difficult, e.g. when using test environments for single components [11]. Finally, the credibility of obtained results remains questionable until these can be validated in later lifecycle phases.
2.2. Measurement-based Prediction
Predicting performance on the basis of measurements requires an implemented system to be observed [11], [15]. Hence, measurement-based prediction techniques consider all executional dependencies which model-based approaches cannot guarantee [16]. On the one hand, measurement-based approaches are more used in practice than model-based approaches due to their effectiveness in operation [5]. On the other hand, they usually allow for fewer degrees of freedom than model-based approaches resulting in a trade-off between runtime and accuracy [11]. According to [16], their main steps are as follows:
1. Collecting training data,
2. Extracting features from training data, and
3. Selecting a suitable prediction technique. Collecting training data can be done by monitoring or benchmarking. For this purpose, software monitors are integrated into applications, termed instrumentation, in order to create log entries driven by any occurring events such as user activity [1], [17]. However, a dedicated implementation of these mechanisms can be very costly [5]. Subsequent feature extraction depends on the application; e.g., for database performance, important features include workload, cache, page size as well as disk speed [18]. Regarding suitable prediction techniques, different machine learning approaches exist.
Two major machine learning approaches are the systems modeling and the performance counters approach [16]. For systems modeling, only a small amount of training data is required. Instead, expert knowledge is used, e.g., in [8]. In contrast, performance counters use a large number of low level counters, i.e. performance related measurements, that can be gathered either in real time from software monitors and operating systems or from log files [19]. Approaches such as random forests or support vector machines leverage these data to predict key metrics. Therefore, performance counters represent a pure black-box approach, where large amounts of training data are needed [16].
Determining the effect of changed configuration parameters usually requires a complex benchmarking process which may be expensive; thus, recent approaches focus on the exploitation of a few variants to train underlying models [20]. The total cost of these approaches is determined by the costs to obtain training and test data sets, the model building cost, and the cost of the prediction error [20].
Measurement-based techniques are most effective in operation resulting in higher correction costs and fewer degrees of freedom. Furthermore, preparing and conducting benchmarks is required which involves experts. In the systems modeling approach, additional expert knowledge is needed. On the other hand, the performance counters approach is only applicable with high amount of data which is usually not available within a single organization since the number of possible configurations to be benchmarked is limited.
To conclude, model-based approaches are very costly e.g. due to needed expert knowledge, but measurement-based approaches are difficult to apply in the SPE normally due to lack of data; if data is available, however, feeding back information from APM to SPE can combine the advantages of both approaches.
3. Design of a Collaborative Performance
Knowledge Base
In the following, we propose the concept of a collaborative knowledge base that utilizes the measurement-based prediction technique of performance counters (c.f. Section 2.1.). Furthermore, enabling technical components are identified.
3.1. Concept
As pointed out in the introduction, our aim is to support the development of standard business application systems by knowledge from the operation of comparable systems. For that reason, a knowledge base is proposed that uses information of APM activities to support SPE activities in the design phase of a system or a system landscape.
Hence, the system under analysis (SUA) does not need to be set up in order to manage performance. Instead, runtime-information from comparable systems can be utilized. In a standard business application environment, certain aspects of a system are comparable to systems of other departments or organizations. Thus, on a global scale, many possible configurations exist and outputs of running software monitors provide a high amount of comparable performance data. This allows for the application of machine learning algorithms based on performance counters [16] since log entries from APM activities can be used for training. Thus, no expert knowledge is needed to construct performance models as in model-based approaches. Instead, knowledge is extracted from a high number of separate observations and can be shared within or across organizations.
The proposed knowledge base concept compromises three layers. The machine learning algorithms as well as the trained performance models are stored in an analytics layer. For these models, the number of different observations as well as their currentness determines the quality of the performance prediction. For instance, a release-specific change of transaction logic might leverage a particular operating system feature or hardware resource more efficiently resulting in lower average response times. Therefore, the knowledge base should provide an interface to import information of former and future APM activities into a data layer.
From a business perspective, the knowledge base can be hosted by an IT consultancy company to provide unique “SPE as a service” offerings. At the same time, the knowledge base provider is enabled to
leverage the data layer for further analytics in order to provide individual optimization services that are aligned with current needs, bottlenecks or other service opportunities that arise from the respective subset of monitoring data.
End users should be provided with easy access to the knowledge base in order to support particular SPE related tasks, which we refer to as provisioning layer. As a usage example, a performance engineer may expect an estimated hourly workload for a particular timeframe and provides characteristics of the technical platform the application is running on or planned to be migrated to. In this case, the service can be used to predict the mean response times for a particular business transaction under the given conditions and, thus, support decision-making for capacity planning and capacity management. Such decisions may affect sizing processes for planned systems, e.g. in terms of required CPU capacity, scaling of existing systems (either down or up) in cost-effective accordance to operational level agreements, and release upgrade planning. Hence, knowledge from monitored systems is fed back through prediction models into performance engineering activities in order to evaluate change effects preliminary to their implementation.
Since any functionality on the analytics and provisioning layer is limited by the type of available data, we interviewed three consultants who provide performance-related system analyses for enterprise applications in order to identify necessary data dimensions. According to our findings, the data layer of a performance knowledge base should include but is not limited to attributes of the following dimensions in order to enable performance model training:
System topology
o Mapping of logical and physical components
o Release information o System type Resource capacity
o Capabilities and capacity limits of hardware components
Workload characteristics o Transaction usage o Resource demands o Performance metrics
Depending on the available data, additional use cases are conceivable on analytics layer, which are not subject to the evaluation conducted in this paper. As an exemplary outlook, the integration of monitored data from different systems enables cross-system and cross-organizational analytics. Therefore, end users or organizations are given the opportunity
to assess their ERP system landscape by comparing own system performance with, e.g., mean values derived from empirical distribution functions across various systems on similar hardware, e.g. in order to identify performance anomalies.
3.2. Technical Architecture
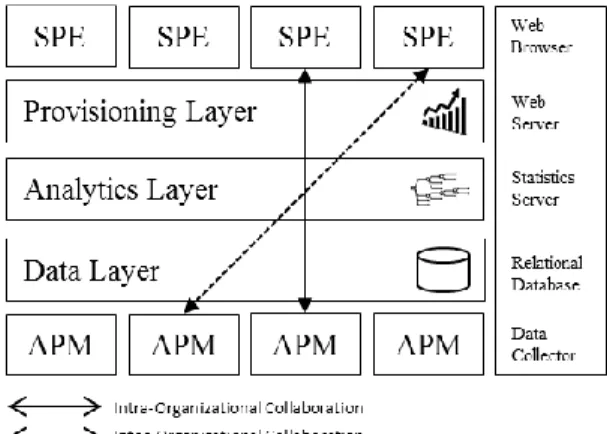
The knowledge base is intended to serve as a bridge between APM and SPE activities for standard enterprise applications across organizational borders. Thus, data resulting from various monitoring activities during operations will serve as input for performance engineering tasks in the design phase. In the following section, we will introduce how the knowledge base can be instantiated. Therefore, Figure 1 shows the knowledge base layers and their enabling technical components.
Figure 1. Components of the knowledge base As discussed in Section 3.1, we use measurement data from running enterprise applications to train prediction models. Software monitors can be used to collect data during execution. These are often inherent in standard enterprise applications and make use of event-driven techniques [17] to produce a constant flow of log entries. Typical examples are SAP statistical records or Oracle performance statistics. While extended tracing capabilities usually need to be activated intentionally in order to reduce measurement overhead [1], performance log entries such as SAP statistical records are stored on the file system by default, regardless of whether the contained data is analyzed or not. These log entries can be extracted, transformed and loaded by a data collecting software (data collector) into a central database periodically resulting in a classical ETL process. Such data collectors are already used by IT consultancies as part of system maintenance services [21]. While these services always focus on one particular customer and a limited timeframe (usually
up to three weeks), a central knowledge base enables cross-case analytics and periodic data updates resulting in intra- and inter-organizational collaboration as depicted in Figure 1.
The expected volume of the data layer depends on the data granularity, the number of data sources and the maximum required age of historic data which is subject to our future research. The capabilities to build prediction models are provided on the analytics layer, technically enabled by a statistics server or, alternatively, by stored procedures within the database itself. After prediction models have been trained, they need to be utilized by end users. Therefore, an integrated web server enables users to access the knowledge base on a provisioning layer. Hence, no separate application server is needed and predictive capabilities can be used through a web browser. In this manner, performance engineers are able to make use of existing knowledge which is encompassed in models to predict the performance of planned standard enterprise applications or to evaluate performance-related effects of planned changes. Hence, a valuable decision support is delivered.
4. Evaluation
According to [14], we utilize a descriptive evaluation using the scenario of “response time prediction” to evaluate the feasibility of the proposed knowledge base. The knowledge base builds upon the hypothesis that standard business application systems are to an extent comparable. Consequently, machine learning approaches can find a suitable description of the general dependency of performance and system configuration. In order to test this hypothesis, we instantiated the designed knowledge base by implementing the aforementioned components on each layer. On the analytics layer, the constructed prediction models are evaluated by testing their accuracy.
4.1. Knowledge Base Instantiation
The introduced knowledge base comprises a data layer, an analytics layer and a provisioning layer. In this subsection, we present the chosen components that we implemented on each layer to build an instance of the designed knowledge base. Furthermore, we give insights on the leveraged monitoring data. As source data for the knowledge base, monitoring logs from different implementations of EA standard software are required. For this purpose, we utilized a vast and anonymized amount
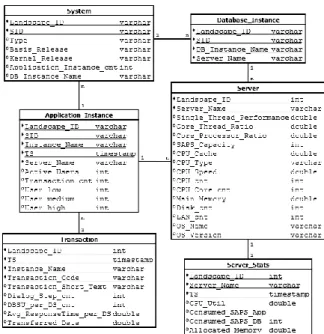
of data that was collected from various instantiations of SAP ERP systems across the globe, which represent widely used standard enterprise applications. Technical system characteristics such as the kernel version or basis release vary and, therefore, were included as attributes in the dataset (cf. Figure 2). The monitoring logs were contained in files using the comma separated values (CSV) format, which we merged and imported into a single relational database. The total data volume comprises runtime information related to 18,927 running SAP application instances distributed across 16,216 differently characterized servers.
Since requests are aggregated by the application software monitor along with performance-related metrics, mean response times related to more than six billion business transaction calls are included on the data layer of the implemented performance knowledge base. Therefore, the given level of data granularity does not intend nor allow for single user activities to be investigated. Instead, the mean response time (in milliseconds) per dialog step was calculated for each investigated hour of system usage and for each type of business transaction. Since this value can be used to express, assess and compare system performance, its accurate prediction would provide valuable decision support for performance engineering activities, e.g. during capacity planning and capacity management exercises. According to the design phase of the knowledge base (c.f. Section 3.1), monitoring data from the dimensions system topology, resource capacity and workload characteristics are required in order to address the given objective.
Figure 2. ER model of the data layer
Based on these dimensions, selected attributes from the total dataset were integrated in a common database schema. Figure 2 shows an excerpt of the entity relationship (ER) model we utilized on the data layer. As the chosen attributes depend on the output provided by application software monitors, this ER model can serve as a basis, but would need to be adapted if used for a different kind of standard software. The data layer, in our case, is technically enabled by the in-memory database SAP HANA (Support Package Stack 10), utilizing 1TB of physically available main memory.
The analytics layer is intended to extract knowledge from the database. Therefore, database views can be created to serve as an input for prediction models. For the scope of this paper, we utilized publicly available libraries, written in the statistics language R, to train and test different kinds of models. For a given hourly workload and system architecture, the models can be used to predict the mean response time per dialog step. A dialog step refers to the smallest unit of work, triggered by end users, and processed by the system under analysis. Therefore, response times include processing times of both the database and application server as well as eventual lock times and queue times [22]. To support response time predictions, on the analytics layer, we integrated an R server with the database and were able to encapsulate analytics logic within stored procedures.
Thus, the steps of both model training and predictions can be automated and triggered from the database server while being executed on a separate machine. Finally, the extracted knowledge needs to be shared across the participating entities to support intra- and inter-organizational collaboration. Therefore, a provisioning layer integrates a web server that has direct access to the database views and stored procedures containing the models.
Hence, models can be trained directly on the respective database view as described in the subsequent section, and end users consume knowledge by predicting response times for varying workloads or system architectures of either planned or existing enterprise applications.
4.2. Model Extraction
Based on the monitored data that has been imported into the knowledgebase, we were able to build various kinds of prediction models. Which model is most suitable depends on the characteristics of the problem, hence, several machine learning prediction models have been considered. In order to evaluate which models can be applied to the given
scenario, we trained the following model types, which may be appropriate according to related work [16], and compared their prediction accuracy:
Regression tree Random forest Evolutionary earning Support vector machine M5P model trees
Gradient boosting machine
As these represent existing machine learning algorithms, which are provided by publicly available libraries, written in R, further details on their functionality will not be presented in this paper, but can be found in the user guide of the respective R-library available via the Comprehensive R Archive network (CRAN) [23].
Often, standard software is customized or extended leading to components that are not comparable across implementations. Therefore, the data basis for model creation needs to be limited to standard business transactions that are used by a large number of customers. Thus, our first tests aimed at identifying a sufficient level of comparability within the dataset in order to limit the predictions to either a specific system type, a particular standard business transaction or a subset of standard business transactions. Our preliminary tests show generally increased prediction accuracy if models are limited to subsets of the same standard transaction having similar workload characteristics. In fact, the prediction accuracy decreases by up to 63% if all transaction types, including non-standard ones, are considered in the training phase of a single model. Therefore, the log records have been classified regarding the performed type of standard transaction, their actual business logic, and the load, which they caused on the application and on the database server.
For the latter, their total number of database service units (DBSU), requested by the application server in the form of selects, updates or deletions, can be used (c.f. Figure 2). Hence, the models, presented in the following, are always limited to a particular standard transaction type
The value that is to be predicted is the mean response time per dialog step in milliseconds for a given hour of application usage. All models were trained using the features presented in Figure 2, which we extracted from the data layer. As a metric for the model’s accuracy, we use the ratio of the mean absolute error (MAE), and the measured mean response time. In the following, we refer to this value as relative error.
In order to guarantee a large volume of training data and to apply our predictions to business transactions that have existing performance
requirements, we extracted a list of the 100 top used standard business transactions across all organizations. Subsequently, three different domain experts were instructed to choose business transactions from the list that are known to be business-critical in terms of their performance for many organizations. We consolidated the results to a new list of most used and most relevant standard business transactions and selected the top 15 transactions to train the above mentioned models on. For each transaction, a separate model was built.
Across the examined business transactions, the mean response time per dialog step varied between 476 ms and 2,366 ms. For each model, we splitted the data set randomly into a training set which accounts to 70 percent of the data volume and a test set which accounts to the remaining 30 percent.
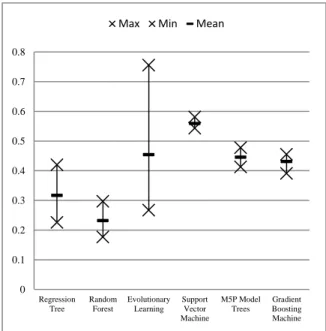
Figure 3 shows the model’s accuracies by comparing their relative errors across all 15 transaction models for each model type. As can be seen in Figure 3, the prediction accuracy highly depends on the type of the model. Overall, the relative error varied between 17.66 and 58.10 %. Models based on evolutionary learning further depend strongly on the type of transaction, resulting in a high variance between 26.69 and 45.40 %. Support Vector machines, M5P and gradient boosting machines did not vary significantly across different business transactions but show a comparably low prediction accuracy resulting in relative errors between 58.10 and 39.06 percent. In contrast, our experiments revealed a relative error of 23.19 percent for random forests, which turned out to be the most suitable type of model for the given scenario.
Figure 3. Relative error per model type 0 0.1 0.2 0.3 0.4 0.5 0.6 0.7 0.8 Regression Tree Random Forest Evolutionary Learning Support Vector Machine M5P Model Trees Gradient Boosting Machine
As random forests combine decisions from multiple regression trees within one model, their accuracy outperforms any single regression tree (See Figure 3). Therefore, we state that, from the above mentioned prediction model types, random forests are most capable to recognize and represent existing performance dependencies within enterprise application system architectures. In our given scenario, most significant features were related to characteristics of the ERP system’s database server (number of CPUs, threads, cores, allocated main memory), followed by workload characteristics such as the number of active users, the number of database requests and the number of dialog steps at the investigated hour of system usage. In contrast, hardware characteristics of the application server were considered to be less important during the training process.
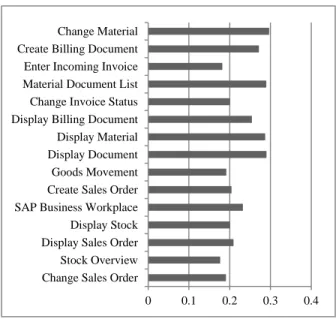
Due to their comparatively low error (cf. Figure 3), we limit further evaluation details to models that were trained using a random forest. Figure 4 shows the relative error for each tested standard business transaction from the above mentioned list, using random forests.
For this model type, the mean relative error accounted to 23.19 percent across the listed standard transactions. Best results were achieved by a random forest that predicted the mean response time for showing stock overviews. Here, a relative error of only 17.66 percent was observed. Although this transaction shows one of the longest response times within our data subset, based on our experiments, no correlation between the actual response time and the prediction accuracy could be identified.
Figure 4. Relative error per standard transaction type (random forest)
In 2004, [24] stated that deviations up to 25 percent are, according to general conditions, within acceptable ranges, results are also comparable to other approaches such as [25], [26].
Since monitoring data from multiple implementations of standard enterprise applications were used to train the models, a variety of different workload and server characteristics is represented within each model. Hence, our experimental results show that standard transactions of different enterprise application systems are comparable. As a consequence, their APM output can be combined and leveraged by machine learning algorithms to discover existing dependencies between response times, system capacities and workload information.
4.3. Discussion
Our evaluation results show how benefits of measurement-based and model-based performance prediction techniques can be combined in order to predict application performance in a cost-efficient yet comparatively accurate manner.
Using the trained models, performance engineers are able to predict response times of planned enterprise applications for a given workload and system topology.
Therefore, data from various APM activities was leveraged to serve as valuable input for training models in order to create knowledge that can be utilized during SPE. Accordingly, the designed knowledge base supports both intra- and inter-organizational collaboration.
Using the output data of elsewhere performed monitoring activities, the cost of applying the approach for a new customer are much lower than for the classical measurement-based approach, which would require dedicated quality assurance systems for any performance tests. Costs for model building arise for the service provider and would be included in the service price for the consumer; however, since economies of scale are utilized, these would be lower than model building costs in the context of a single application system. The cost of the prediction error decreases with a growing volume on the data layer of the knowledge base; furthermore, the service price could be designed to be flexible dependent on the prediction accuracy. Thus, costs for applying the approach are much less than for classical model-based or measurement-model-based approaches since neither expert knowledge nor implemented systems are needed within an organization
On the other hand, performance predictions for workloads and system setups that are not yet covered in the knowledge base might be less accurate in case
0 0.1 0.2 0.3 0.4
Change Sales Order Stock Overview Display Sales Order Display Stock SAP Business Workplace Create Sales Order Goods Movement Display Document Display Material Display Billing Document Change Invoice Status Material Document List Enter Incoming Invoice Create Billing Document Change Material
they do not follow rules reflected in the models. Hence, performance predictions for new software releases will become more accurate over time as these are increasingly used within monitored systems. Another drawback may arise from data protection concerns of participating organizations. Although no sensitive master or transaction data is ever accessed by existing monitoring data collectors, responsible administrators are known to be cautious when it comes to data exchange that is related to core enterprise applications. However, such doubts can be well addressed, since only performance metadata is needed to support analytics. While any identifiers or server names can be anonymized without affecting model accuracy, dynamic analytic privileges can be utilized on the provisioning layer to further limit user access to the data layer.
Besides the evaluated performance prediction, further functionalities are conceivable on the analytics layer including benchmarking services, application health checks, workload consolidations or performance anomaly detections. In any case, the collaborative idea leads to individual decision support and leverages economies of scale by analytical capabilities that need to be implemented once while the resulting knowledge can be leveraged by all participants.
5. Conclusion and Future Work
In this paper, we introduced a novel approach of collaboration aiming at decision support during software performance engineering activities. The approach is enabled by a knowledge base that includes machine learning algorithms in order to extract knowledge from enterprise application monitoring data that was generated beyond organizational borders.
Within the conceptual design, we take advantage of the fact that enterprise applications usually base on standard software components. Within such applications, end users execute standard business transactions that are comparable in many aspects. As instantiations of these systems are implemented around the globe by different organizations, monitoring activities constantly produce a growing amount of log data that follow the same format and refer to the same execution logic.
Therefore, we examined the feasibility to integrate monitoring data from different sources into a common knowledge base in order to train performance prediction models on cross-organizational data subsets. Such response time predictions that are performed on an analytics layer,
can serve as valuable input for performance-affecting design decisions that need to be taken in an early stage of planned software rollouts and changes.
We identified random forests to be the most suitable type of prediction model for the characteristics of the standard enterprise applications we studied. On a real-world data set of 18,927 application instances, a mean relative error of 23.19 percent could be observed for examined standard transactions, which is, according to related work from the field of performance prediction, a sufficient accuracy. Furthermore, the results demonstrate that systems are comparable in these aspects from a statistical point of view. In this manner, the presented approach combines the benefits of accurate measurement-based and early, e.g., during design phase, applicable model-based prediction techniques. Furthermore, the approach brings together performance-related activities of various development and operations teams and, therefore, serves as a contribution to the increasingly utilized DevOps principle.
As the presented evaluation results verified a general feasibility of our approach, multiple interesting directions arise for future research. For instance, an appropriate time frame for keeping historical data in the knowledge base currently remains an open issue
By limiting training data to a particular time frame that excludes entries from obsolete and, therefore, rarely used releases or platforms, prediction accuracy can potentially be further improved. Moreover, further analytical use cases, as mentioned in Section 4.3, can be designed based on existing information that is stored on the data layer. Each use case potentially supports new services that can be provided by the hosting party of the knowledge base. Hence, the design and implementation of an easily usable provisioning layer that delivers the extracted knowledge to the end user will be subject to continuing future efforts, too.
To summarize, our approach presents an opportunity to transfer knowledge gained in operation into the development of system landscapes even beyond organizational borders.
6. References
[1] A. Brunnert, A. van Hoorn, F. Willnecker, A. Danciu, W. Hasselbring, C. Heger, N. Herbst, P. Jamshidi, R. Jung, J. von Kistowski, and others, “Performance-oriented DevOps: A Research Agenda,” arXiv preprint arXiv:1508.04752, 2015.
[2] M. Hüttermann, DevOps for developers. Apress, 2012.
[3] L. Bass, I. Weber, and L. Zhu, DevOps: A Software Architect’s Perspective. Addison-Wesley
Professional, 2015.
[4] S. Sharma and B. Coyne, “DevOps for dummies,” Limited IBM Edition’book, 2013.
[5] D. Westermann, J. Happe, M. Hauck, and C. Heupel, “The performance cockpit approach: A framework for systematic performance evaluations,” in Software Engineering and Advanced Applications (SEAA), 2010 36th EUROMICRO Conference on, 2010, pp. 31–38.
[6] L. Grinshpan, Solving enterprise applications performance puzzles: queuing models to the rescue. John Wiley & Sons, 2012.
[7] A. Beloglazov and R. Buyya, “Energy Efficient Resource Management in Virtualized Cloud Data Centers,” in 10th IEEE/ACM International Conference on Cluster, Cloud and Grid Computing, 2010.
[8] D. Tertilt and H. Krcmar, “Generic performance prediction for ERP and SOA applications.,” in ECIS, 2011.
[9] M. Woodside, G. Franks, and D. C. Petriu, “The future of software performance engineering,” in Future of Software Engineering, 2007. FOSE’07, 2007, pp. 171–187.
[10] D. A. Menasce, “Composing web services: A QoS view,” Internet Computing, IEEE, vol. 8, no. 6, pp. 88–90, 2004.
[11] F. Brosig, N. Huber, and S. Kounev, “Architecture-level software performance abstractions for online performance prediction,” Science of Computer Programming, vol. 90, pp. 71–92, 2014.
[12] V. Hork, P. Libic, L. Marek, A. Steinhauser, and P. Tma, “Utilizing performance unit tests to increase performance awareness,” in Proceedings of the 6th ACM/SPEC International Conference on
Performance Engineering, 2015, pp. 289–300.
[13] J. Kowall and W. Cappelli, “Magic quadrant for application performance monitoring,” Gartner Research ID G, vol. 232180, 2012.
[14] A. R. Hevner, S. T. March, J. Park, and S. Ram, “Design Science in Information Systems Research,” Management Information Systems Quarterly, vol. 28, no. 1, pp. 75–105, May 2004.
[15] S. Balsamo, A. D. Marco, P. Inverardi, and M. Simeoni, “Model-based performance prediction in software development: A survey,” Software
Engineering, IEEE Transactions on, vol. 30, no. 5, pp. 295–310, 2004.
[16] S. Venkataraman, Z. Yang, M. Franklin, B. Recht, and I. Stoica, “Ernest: efficient performance prediction for large-scale advanced analytics,” in 13th USENIX Symposium on Networked Systems Design and Implementation (NSDI 16), 2016, pp. 363–378.
[17] D. J. Lilja, Measuring computer performance: a practitioner’s guide. Cambridge University Press, 2005.
[18] N. Siegmund, S. S. Kolesnikov, C. Kästner, S. Apel, D. Batory, M. Rosenmüller, and G. Saake, “Predicting performance via automated feature-interaction detection,” in Proceedings of the 34th International Conference on Software Engineering, 2012, pp. 167–177.
[19] “About Performance Counters.” Microsoft, 2016 [Online]. Available: https://msdn.microsoft.com/de-de/library/windows/desktop/aa371643(v=vs.85).asp x
[20] A. Sarkar, J. Guo, N. Siegmund, S. Apel, and K. Czarnecki, “Cost-Efficient Sampling for Performance Prediction of Configurable Systems (T),” in Automated Software Engineering (ASE), 2015 30th IEEE/ACM International Conference on, 2015, pp. 342–352.
[21] “Performance Database Collectors.” 2016 [Online]. Available:
https://help.sap.com/saphelp_scm41/helpdata/en/51 /84e93ad578f915e10000000a11402f/frameset.htm
[22] K. Wilhelm, “Capacity Planning for SAP-Concepts and tools for performance monitoring and
modelling,” CMG Journal of Computer Resource Management, no. 104, 2001.
[23] “The Comprehensive R Archive Network.” [Online]. Available: https://cran.r-project.org/
[24] D. S. Liu, K. C. Tan, S. Y. Huang, C. K. Goh, and W. K. Ho, “On solving multiobjective bin packing problems using evolutionary particle swarm optimization,” European Journal of Operational Research, vol. 190, pp. 357–382, Oct. 2008.
[25] C. Rathfelder, B. Klatt, K. Sachs, and S. Kounev, “Modeling event-based communication in component-based software architectures for performance predictions,” Software & Systems Modeling, vol. 13, no. 4, pp. 1291–1317, 2014.
[26] G. Bontempi and W. Kruijtzer, “A data analysis method for software performance prediction,” in Proceedings of the conference on Design, automation and test in Europe, 2002, p. 971.