Clemson University
TigerPrints
All Dissertations Dissertations
12-2016
Functional Analysis of Human Long Non-coding
RNAs and Their Associations with Diseases
Steven Cogill
Clemson University, [email protected]
Follow this and additional works at:https://tigerprints.clemson.edu/all_dissertations
This Dissertation is brought to you for free and open access by the Dissertations at TigerPrints. It has been accepted for inclusion in All Dissertations by an authorized administrator of TigerPrints. For more information, please [email protected].
Recommended Citation
Cogill, Steven, "Functional Analysis of Human Long Non-coding RNAs and Their Associations with Diseases" (2016).All Dissertations. 1850.
FUNCTIONAL ANALYSIS OF HUMAN LONG NON-CODING RNAS AND THEIR ASSOCIATIONS WITH DISEASES
A Dissertation Presented to the Graduate School of
Clemson University
In Partial Fulfillment
of the Requirements for the Degree Doctor of Philosophy Genetics by Steven Cogill December 2016 Accepted by:
Dr. Liangjiang Wang, Committee Chair Dr. Julia Frugoli
Dr. Hong Luo Dr. Anand Srivastava
ABSTRACT
Within this study, we sought to leverage knowledge from well-characterized protein coding genes to characterize the lesser known long non-coding RNA (lncRNA) genes using computational methods to find functional annotations and disease associations. Functional genome annotation is an essential step to a systems-level view of the human genome. With this knowledge, we can gain a deeper understanding of how humans develop and function, and a better understanding of human disease. LncRNAs are transcripts greater than 200 nucleotides, which do not code for proteins. LncRNAs have been found to regulate development, tissue and cell differentiation, and organ formation. Their dysregulation has been linked to several diseases including autism spectrum disorder (ASD) and cancer. While a great deal of research has been dedicated to protein-coding genes, the relatively recently discovered lncRNA genes have yet to be characterized. LncRNA function is tied closely to when and where they are expressed. Co-expression network analysis offer a means of functional annotation of uncharacterized genes through a “guilt by association” approach. We have constructed two co-expression networks using known disease-associated protein-coding genes and lncRNA genes. Through clustering of the networks, gene set enrichment analysis, and centrality measures, we found enrichment for disease association and functions as well as identified high-confidence lncRNA disease gene targets. We present a novel approach to the identification of disease state associations by demonstrating genes that are associated with the same disease states share patterns that can be discerned from transcriptomes of healthy tissues. Using a machine learning algorithm, we built a model to classify ASD
versus non-ASD genes using their expression profiles from healthy developing human brain tissues. Feature selection during the model-building process also identified critical temporospatial points for the determination of ASD genes. We constructed a webserver tool for the prioritization of genes for ASD association. The webserver tool has a database containing prioritization and co-expression information for nearly every gene in the human genome.
DEDICATION
I dedicate my dissertation to my parents, friends, and partner. Without their support and affection, this work would not be possible.
ACKNOWLEDGMENTS
I would like to thank my advisor Dr. Wang for his guidance and support in my research project. I am thankful that he has shared his wealth of knowledge in bioinformatics and academic science with me. I would like to thank Dr. Luo for the opportunity to learn benchtop skills in his lab, Dr. Frugoli for her career and writing advice, and Dr. Srivastava for sharing his human genetics knowledge. I would also like to thank my lab mates, Jose Guevara and Brian Gudenas, for their support. Finally, I would like to thank the faculty, staff, and students at the Clemson University Department of Genetics and Biochemistry and the Greenwood Genetic Center for providing me with the opportunity to pursue my PhD studies.
TABLE OF CONTENTS Page TITLE PAGE ... i ABSTRACT ... ii DEDICATION ... iv ACKNOWLEDGMENTS ... v
LIST OF TABLES ... viii
LIST OF FIGURES ... ix
CHAPTER I. LITERATURE REVIEW OF THE FUNCTIONAL ANNOTATION OF HUMAN LONG NON-CODING RNAS USING COMPUTATIONAL METHODS ... 1
Introduction ... 1
Long non-coding RNAs ... 5
Co-expression network analysis ... 17
Machine learning ... 19
Candidate gene prioritization ... 21
My research ... 23
II. CO-EXPRESSION NETWORK ANALYSIS OF HUMAN LONG NON-CODING RNA AND CANCER GENES ... 31
Introduction ... 32
Methods... 34
Results ... 37
Discussion ... 51
III. CO-EXPRESSION OF HUMAN LONG NON-CODING RNA AND AUTISM RISK GENES IN THE DEVELOPING BRAIN ... 58
Table of Contents (Continued)
Page
Methods... 61
Results ... 65
Discussion ... 76
IV. SUPPORT VECTOR MACHINE MODEL OF DEVELOPMENTAL BRAIN GENE EXPRESSION DATA FOR PRIORITIZATION OF AUTISM RISK GENE CANDIDATES ... 82
Introduction ... 83 Methods... 86 Results ... 95 Discussion ... 103 Conclusions ... 106 Acknowledgements ... 106
V. PRIORITIZATION SYSTEM OF GENES FOR AUTISM RISK (PGAR): AUTISM CANDIDATE GENE PRIORITIZATION SYSTEM USING EXPRESSION PATTERNS ... 111
Introduction ... 112
Database ... 113
Supervised machine learning model ... 114
Gene Co-expression network ... 114
PGAR input and output ... 115
Validation of the prioritization system ... 120
Comparison with other systems ... 121
Conclusions ... 122 VI. CONCLUSIONS... 125 APPENDICES ... 128 A: Additional files... 129 B: Supplementary figures ... 130 C: Supplementary tables ... 131
LIST OF TABLES
Table Page
2.1 Identification of lncRNAs highly co-expressed with known cancer genes . 40 3.1 List of selected biologically significant and highly prioritized for ASD
association lncRNA genes ... 76 4.1 The mean sensitivity, specificity, overall accuracy and Matthews Correlation
Coefficient (MCC) of each model for 50 repetitions of tenfold cross-validations ... 96 4.2 The selected features from the best-first search algorithm ... 99 4.3 The mean percentile rank of known ASD risk genes for three prioritized gene
set sizes for the selected and full feature set SVM models ... 101 4.4 Genes of interest from the prioritization of lncRNA genes with their biotype, SVM output, and confidence score ... 103
LIST OF FIGURES
Figure Page
1.1 LncRNA classification by position ... 9
1.2 Schematic of the functional annotation process ... 11
1.3 Schematic of the molecular mechanism archetypes for lncRNAs ... 15
2.1 WGCNA of cancer genes and lncRNAs ... 41
2.2 Expression and functional term enrichment of the largest Module 1 with high level of expression in blood ... 43
2.3 Network visualization of the largest Module 1 with high level of expression in blood ... 44
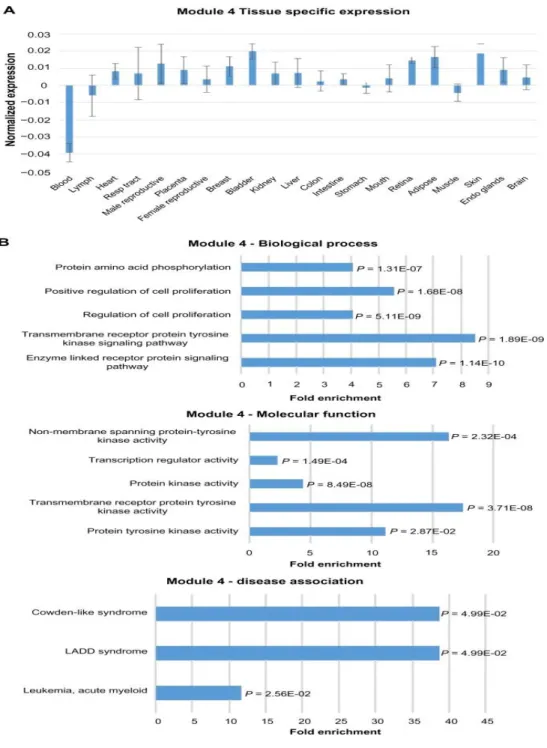
2.4 Expression and functional term enrichment of Module 4 genes with low level of expression in blood ... 47
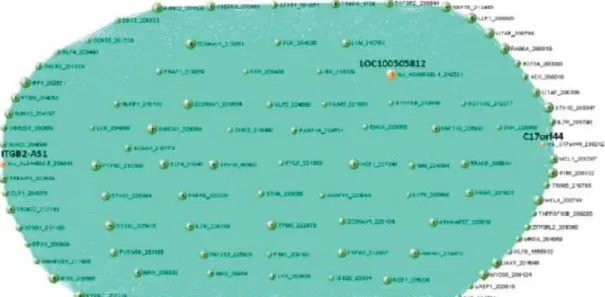
2.5 Network visualization of Module 4 genes with low level of expression in blood ... 48
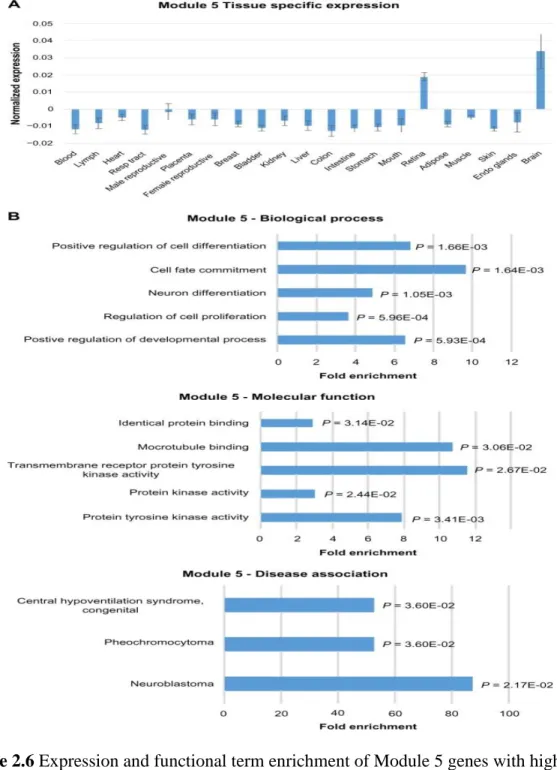
2.6 Expression and functional term enrichment of Module 5 genes with high proportion of lncRNAs and high level of expression in brain tissues ... 49
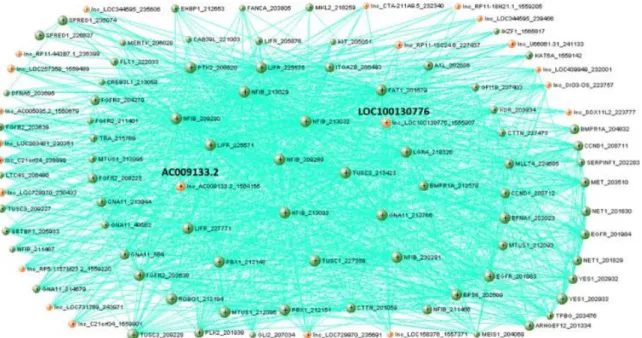
2.7 Network visualization of Module 5 genes with high proportion of lncRNAs and high level of expression in brain tissues ... 50
3.1 Co-expression analysis of BrainSpan dataset ... 66
3.2 Term enrichment analysis of early and late expression module groups ... 71
3.3 Gene expression enrichment analysis of early and late expression module groups ... 72
3.4 Network topology for modules of interest ... 74
4.1 ROC curves of the selected and full feature set SVM models ... 97
4.2 Histogram of ASD risk gene count grouped by percentile rank for the selected and full feature set SVM models for the three gene set sizes ... 101
5.1 Screenshot of the PGAR home page ... 116
5.2 Screenshot of the PGAR results page ... 118
5.3 Screenshot for the PGAR gene profile page. ... 119
5.4 Screenshot of PGAR module summary page... 120 Gene expression enrichment analysis of early and late expression module groups
CHAPTER I – LITERATURE REVIEW OF THE FUNCTIONAL ANNOTATION OF HUMAN LONG NON-CODING RNAS USING COMPUTATIONAL
METHODS
1.1 Introduction
Biological data has expanded both in quantity and complexity from next-generation sequencing and high-throughput methods. Most noteworthy is the global aspect of data. We have begun to work in ‘omics’, looking at systems as a whole, and data at this scale and complexity diminishes the ability of the scientist alone to efficiently and effectively discern actionable knowledge. An example would be the study of BReast Cancer susceptibility gene 1 (BRCA1). Mutations in BRCA1 were discovered in 1990 to be associated with families at high risk for breast and ovarian cancers (Hall et al., 1990). Given its impact on cancer research and relatively early discovery, it has been intensely studied for nearly 30 years (Scalia-Wilbur et al., 2016). Currently there are 12,812 articles pertaining to BRCA1 in Pubmed (2011, accessed on 8/30/16). A scientist with a specific question may be able to find a relevant article or a review which can answer their query or provide an overview of BRCA 1, but a broad query such as identifying a comprehensive list of potential binding partners for BRCA1 and discerning interesting shared characteristics amongst the binding partners would require a comprehensive view of the available literature. While an individual scientist may not be able to read the 12,812 articles, bioinformatics data mining techniques such as text mining and sentiment analysis could provide a solution.
The research environment has become data rich, information poor. The origins of the phrase “data rich, information poor” or otherwise known as the DRIP syndrome is difficult to determine. One of the first mentions of data rich information poor in biological research context is from Williamson (1987) which roughly coincided with the first international medical informatics conference hosted in 1985 (Sewell and Thede, 2012). The phrase itself is in reference to the low cost of data production and the lack of return on this accumulation of data. Return comes in the form of knowledge which gives the data clarity and allows for decision making and predictions. Data in itself is meaningless, and applicable knowledge has to be extracted from it using data mining techniques (Obeidat et al., 2015). This idea became very apparent with widespread use of microarray technologies in the late 90s before there was a suitable infrastructure to handle the data deluge (Schulze and Downward, 2000). Data has begun to accumulate faster than it can be analyzed (Schatz et al., 2010), which has led to the rise of cloud computing, bioinformatics cores, and the incorporation of bioinformatics curricula at research universities (Dai et al., 2012; Lewitter et al, 2009, Welch et al., 2014).
The earliest work in bioinformatics was focused on databases. Following the advent of protein sequencing by Tuppy and Sanger (1951), the Protein Data Bank was formed in 1972 to archive the new sequences (Bernstein et al., 1977). With the advent of the internet, next generation sequencing, and high-throughput methodologies, the number of publically available databases has ballooned to a recent listing of 1,552 databases (Fernandez-Suarez et al., 2014). Biological databases can be categorized by the type of data contained within and how the data was obtained. Biological database data types are
DNA, RNA, protein, expression, pathway, disease, nomenclature, literature, and standard/ontology (Zou et al., 2015). Databases which act as repositories for experimentally derived results are considered primary databases, whereas databases which house data from analysis on this primary data are considered secondary databases (Mewes et al., 2010). An example of a primary database is GenBank, which is a comprehensive collection of all publically available DNA sequences (Benson et al., 2013). An example of a secondary database is the UniProt knowledgebase, which contains annotated protein entries (Bateman et al., 2015). The structuring and archiving of information into accessible formats is an active area of research. One of the challenges that lie in biological database research is structuring data from unstructured data. This is particularly difficult with the more traditional relational databases that store data in interconnected formally-defined tables. Novel approaches are being developed to address the issue. An example is the approach of Lysenko et al. (2016) who applied graph theory (see section 1.3) to the structuring of the database. Databases are so much an active area of bioinformatics research that the journal Nucleic Acids Research releases an annual database issue covering new releases and advances in the field.
Bioinformatics is a multidisciplinary field that stands at the cross-section of mathematics, statistics, biology, and computer science. The emergence of bioinformatics as a major discipline incorporating data mining amongst other tools followed closely with the publishing of the human genome (Lander et al., 2001). Indeed, a formal definition was not proposed until 2001 when Luscombe et al. (2001) describe it as: “Conceptualizing biology in terms of macromolecules (in the sense of
physical-chemistry) and then applying ‘informatics’ techniques (derived from disciplines such as applied maths, computer science, and statistics) to understand and organize the information associated with these molecules, on a large-scale”. Although the definition remains apt, Bioinformatics is pluralistic, and can be further broken down into three sub-disciplines. The first is the development of algorithms which relies heavily on mathematics. Commonly, this field tries to reduce the complexity of existing algorithms, and one common area this is applied to is in image processing. An example is the study done by Zhao et al. (2016) where they developed a variation on principal component analysis for faster processing of cryo-electron microscopy images. The second sub-discipline is the analysis and interpretation of biological data which may also be considered computational biology and relies on biological training. An example of this type of study would be co-expression network analysis (see section 1.3). The third sub-discipline is the development of tools, which relies heavily on computer science. An example of this type of study would be the development of a disease gene prioritization systems (see section 1.5). Additionally, bioinformatics studies may show overlap between these different sub-disciplines. The definition of a bioinformatician is also pluralistic as well. Many would emphasize computational aspects over the biological aspects and vice versa. A recent survey by Bartlet et al. (2016) amongst bioinformaticians in the United Kingdom found that there was a large cultural divide amongst the different disciplines of bioinformatics and that the backgrounds of key members varied greatly as well. Although it is evolving, bioinformatics is a field that has allowed for extraction of useful knowledge from the data deluge.
1.2 Long non-coding RNAs
The evolution and quantity of lncRNAs in the human genome
While only 2% of the human genome is made up of protein-coding regions, it is estimated that nearly 75% of the entire genome is transcribed (Djebali et al., 2012). When the genome was first sequenced, the genome size and the number of protein coding genes showed little to no correlation with organismal complexity. It has since been found that the complexity of an organism is actually more closely associated with the number of non-coding RNA genes (Taft et al., 2007, Necsulea et al., 2014).
Non-coding RNA genes are transcribed but not translated. Non-coding RNAs lack an open reading frame (ORF) with coding potential. Determining the coding potential of a transcript is a multi-step process. The GENCODE consortium (Harrow et al., 2012), whose lncRNA annotations were used for a majority of the studies in this dissertation, first compare the transcript to known sequences using the Basic Local Alignment Search Tool n (BLASTn) (Altschul et al., 1990) to cluster the transcripts and then compare the clusters to existing non-coding RNA families in RFAM (Nawrocki et al., 2015). Next they determine the length of the longest potential ORF if one is present. If the length of the ORF is greater than 35% of the transcript length then the transcript is determined to have coding potential. They also look for homology between potential proteins coded within the ORF and any known Protein families in Pfam (Finn, R. 2016). The last aspect of coding potential that is considered by the consortium is codon substitution frequency within the potential ORF. The PhyloCSF method performs multiple sequence alignments and measures conservation based upon the frequencies of synonymous codon
substitutions, conservative amino acid substitutions, and missense and non-sense substitutions, and this has been demonstrated as being effective in determining coding potential as non-coding sequences have lower conservation (Lin et al., 2011). Most groups which attempt to identify lncRNAs within the human genome employ a methodology similar to that of the GENCODE consortium for determining the coding potential of ORFs within transcripts. For example, the lncRNA gene identification study of Iyer et al. (2015) used the Coding Potential Assessment Tool (CPAT) to determine coding potential. CPAT employs a logistic regression model accounting for ORF size, Fickett Testcode Statistic (Fickett, 1982), and hexamer usage bias, which are similar features to those accounted for in the GENCODE method (Wang et al., 2013). Another interesting method of note for determining coding potential is ribosome profiling. It has been found that ribosomes can potentially bind long non-coding RNAs (lncRNAs), but this does not lead to translation (Guttman et al., 2013). The ribosome profiling can distinguish between a coding and a non-coding transcript based upon the sharpness of ribosome release e.g. coding transcripts release once they reach the stop codon where as non-coding transcripts have a much more variable release point (Guttman et al., 2013). Until the early 90s, the functions of RNAs were relegated to messenger RNAs (mRNAs), which is the intermediate between DNA and proteins, and the housekeeping RNAs such as transfer RNAs and ribosomal RNAs which are constitutively expressed and help maintain the base functionality of the cell (Yang et al., 2016). Non-coding RNAs are classified based upon their size with small non-coding RNAs (sncRNA) being less than 200 nucleotides in length, and lncRNAs being greater than 200 nucleotides in
length (Kapranov et al., 2007). The theory of lncRNAs as regulators was proposed in 1961 by Jacob and Monod (Jacob and Monod, 1961; Kung et al., 2013). The first discovery in 1990 of an lncRNA with a regulatory role was that of H19, which regulates in a cis fashion the expression of insulin like growth factor 2 and plays a role in embryonic development (Brannan et al., 1990; Gabory et al., 2006). This was followed closely in 1992 by the discovery of X-inactive specific transcript (Xist) which is key in the inactivation of the X chromosome (Brockdorff et al., 1992; Brown et al., 1992). With the discovery of the regulatory role lncRNAs, it was hypothesized that mRNAs may serve dual functions (Karapetyan et al., 2013). In this instance, genes whose transcripts undergo alternative splicing could code for both messenger RNAs (mRNAs), which are translated to proteins, and lncRNAs serving an alternative function. While there have been recent examples, there are currently very few examples of genes demonstrating this behavior (Karapetyan et al., 2013). While the roles of sncRNAs have been well characterized over the last 10 years, lncRNAs remain poorly characterized (Clerget et al., 2015; Xu et al., 2016).
LncRNAs share many similarities to mRNAs in that they can have a 5’ cap and 3’ polyadenylation, undergo alternative splicing, and are transcribed by RNA polymerase II (Ulitsky and Bartel, 2013). Currently the GENCODE project, which seeks to identify all genes within the human genome, lists 15,941 lncRNA genes (Harrow et al., 2012). However, it is believed that lncRNA genes are more numerous than protein coding genes, and a recent computational study by Iyer et al. (2015) detected 58,648 lncRNA genes. Discrepancies in the estimated number of lncRNA genes arises from differences in
methodologies. GENCODE is widely used and considered by some to be the standard of gene annotations for the human genome. Examples supporting this claim are its use in the building of the BrainSpan dataset (Hawrylycz et al., 2012) and its use in the University of California Santa Cruz genome browser (Kent et al., 2002). Given its use as a resource and need for highest accuracy, the GENCODE consortium is conservative in its estimates, and they employ a manual curation through the HAVANA group which looks at the genome itself rather than mapping the transcripts as outlined above (Harrow et al., 2012). Another discrepancy is the amount of RNA seq data that is produced. While Iyer et al. (2015) produced the largest human lncRNA discovery list to date, they also used ~100 fold greater RNA seq data than previous studies that included data from tumor tissues and cancer cell lines. Another key difference between lncRNA discovery studies is the handling of single exon lncRNAs. Earlier versions of GENCODE did not include them within their list of lncRNAs due to their unreliability in accurately being mapped and determined definitively to be non-coding, but Iyer et al., included them within their study.
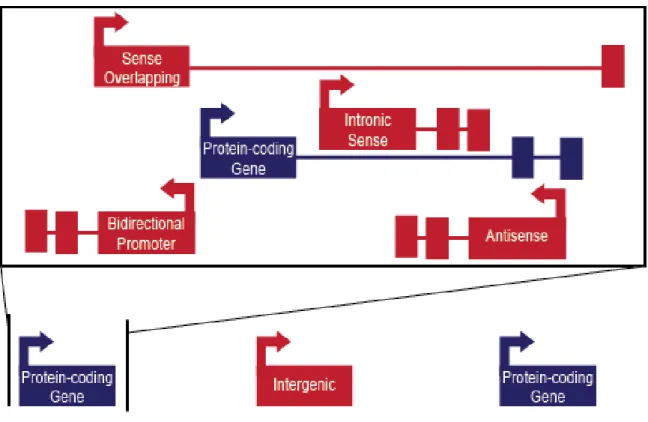
LncRNAs are classified by their genomic location into four categories: sense overlapping, intronic sense, bi-directional promoter, antisense, and intergenic or intervening (Figure 1.1) (Ma et al., 2013). Intergenic lncRNAs otherwise known as long intergenic/intervening RNAs (lincRNAs), as their name implies, lie between protein coding genes and comprise 7,539 of the 15,767 (48%) lncRNAs listed in GENCODE (Harrow et al., 2012). Sense overlapping lncRNAs contain a protein coding gene within their coding region on the same strand. Antisense lncRNAs overlap exon or introns of
protein-coding genes on the opposing strand. Intronic sense lncRNAs are located within the introns of protein-coding genes on the same strand. Bidirectional promoter lncRNAs overlap the promoter of a protein-coding gene on the opposing strand.
Figure 1.1 Positional classification of lncRNA genes. Protein-coding genes are shown in blue and lncRNA genes are shown in red. For each gene, the arrows indicate strand placement, the thick lines indicate exons, and the thin lines indicate introns. The box is an expanded view of the region surrounding the protein coding gene. Adapted from Derrien et al. (2012).
In a landmark study, Nesculea et al. (2014) demonstrated that evolutionarily, lncRNA genes have poor interspecies conservation across exons in comparison to protein-coding genes, but their splice sites and promoter regions are more conserved than protein-coding genes. They also found that lncRNAs have higher time and tissue specific expression, and lncRNAs that are found to be conserved from lower organisms have been
primarily associated with embryogenesis based on the higher likelihood of their promoter regions to contain HOX transcription factor binding sites. Collectively, this indicates a rapid evolution of lncRNAs and implicates the more recent lncRNAs in the formation of the complex organs in higher organisms. In perhaps one of the most complex organs, the human brain, lncRNAs have shown elevated expression relative to other tissues (Derrien et al., 2012).
Functional Annotation
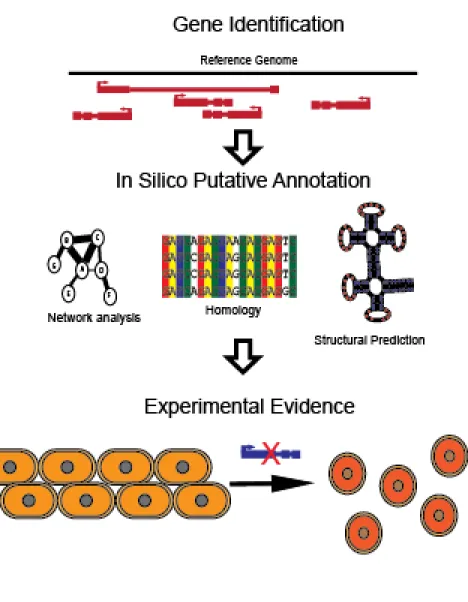
After the identification of the numerous lncRNAs within the genome, the next step in gaining a deeper understanding of their role is to determine their functions (Figure 1.2). A genome annotation for a gene is a description of the gene, its product, which can be either RNA or protein, and the function of that product (Koonin and Galperin, 2003). The description is further refined by gene ontology, which seeks to apply a structured vocabulary to biological processes, cellular components, and molecular functions associated with a given gene. This concept was proposed by the Gene Consortium in 1998 for model organism databases (Ashburner et al., 2000). The hierarchies have been adopted and expanded on by multiple term enrichment software packages to allow for more fields such as disease associations and keywords (see more in Section 1.3). The general process of functional gene annotation is first the identification of the gene within the genome. This is followed by in silico annotation which seeks to associate a putative function for the gene product. The third step of the process is the experimental validation of the annotation. While automated annotation cannot account for all caveats and can display inconsistencies (Devos and Valencia, 2001; Schnoes et al., 2009; Brenner, 1999),
the putative functional assignment provided by the computational analysis can guide the experimental aspect as well as prioritize targets warranting further study (Koonin and Galperin, 2003). In addition, manual annotation errors can still arise and in larger datasets, they tend to persist longer (Percudani et al., 2013).
Figure 1.2 Schematic of the functional annotation process. This is a step by step process of the functional annotation of genes. The first step shows the mapping of transcripts to a reference genome. The second steps indicates some of the potential computational methods that are used to annotate the gene. The final step is the experimental validation of function. An example of this being the effect of the knockout of a gene, which affects the morphology of the cell.
Functional annotation is the precursor step to understanding how genes interact on a systems level, and lncRNA genes present interesting challenges in terms of annotation. The first is that although the number of lncRNA genes is comparable if not greater than protein coding genes (see above), very few of the lncRNA genes lack functional annotation (Laurent et al., 2015). The lncRNA database, which derives its lncRNA entries from literature searches, only has 184 entries for human lncRNAs (Quek et al., 2015). With such a small fraction of lncRNAs with known function, comparative analysis provides little insight into function.
The second challenge is that, in contrast to sncRNAs whose function are closely related to their sequence (Clerget et al., 2015), lncRNA function can be dependent on sequence or derived from structure. For example the function of lncRNA referred to as highly upregulated in liver cancer (HULC) is dependent upon its structure. It has been found to have a competitive endogenous function in that it binds and sequesters the miRNA, miR-372 (Wang et al., 2010). The well-studied HOX transcript antisense RNA (HOTAIR) has been shown to have structurally dependent binding to polycomb repressive complex 2 (PCR2) and lysine-specific histone demythylase 1A (LSD1) (Huang et al., 2014). These are just two examples of the dichotomy of function demonstrated by lncRNAs.
The annotation of lncRNAs is further complicated by a lack of conservation. While protein-coding genes show high levels of conservation in their sequences, lncRNAs only demonstrate small and difficult to discern ultra-conserved regions (Johnsson et al., 2014). These considerations rule out traditional similarity methods that
are employed to determine function. However similarity methods such as network analysis can be applied between the expression patterns of well-studied protein-coding genes and lncRNA genes.
The molecular mechanisms of lncRNAs
Although many lncRNAs have been discovered, there various functions are still being determined (Kung et al., 2013). To provide organization to the known functions of lncRNAs, Wang and Chang (2011) proposed four archetypes of molecular mechanisms employed by lncRNAs: signal, decoy, guide, and scaffold (Figure 1.3), and here I use these archetypes to further describe the function of lncRNAs
As mentioned previously, lncRNA have highly specific temporal spatial expression patterns in comparison to protein-coding genes. As signals, lncRNAs can respond to stimuli and initiate biological processes or provide feedback as to the current state of the cell. As an example of an lncRNA initiating a biological process, Xist is activated during development to inactivate the X chromosome (Brockdorff et al., 1992; Brown et al., 1992). As an example of cell state feedback, prostate cancer antigen 3 (PCA3) is a lncRNA that is only expressed in prostate cancer cells (Bussenmakers et al., 1999; Hessels et al., 2003). These links to biological processes and cell state based on their expression allow us an avenue into the functional annotation of lncRNAs through shared expression patterns with the well-characterized protein coding genes. Another mechanism of lncRNAs is as a decoy. This again points to the dichotomy of function of lncRNAs based on either sequence or structure as decoys bind and attenuate the function
of their target. An example of sequence based decoy function are the competitive endogenous long non-coding RNAs which share binding sites with miRNAs. These lncRNAs essentially act as a sponge to ‘soak up’ through binding and attenuate the function of miRNAs (Thompson and Dinger, 2016). This role is critical and in dysregulation can lead to disease states. Recently, Liu et al. (2016) discovered that the lncRNA Ras suppressor protein 1 pseudogene 2 (RSR1P2) competitively binds the micro RNA let-7a in a process that promotes cervical cancer. An example of a structure based decoy is the lncRNA Growth arrest-specific 5, which binds to and represses the glucocorticoid receptor (Kino et al., 2010). LncRNAs classified as guides effectively direct protein functions to designated targets. The previously mentioned HOTAIR is an example of an lncRNA which employs this mechanism. It binds both PRC2 and LSD1 which are chromatin modifying enzymes and targets them to HOX gene loci to repress their expression (Huang et al., 2014). The final mechanism archetype is scaffold. Given the large number of potential secondary structures for lncRNAs (Wan, et al., 2014) and the 6%-8% frequency of RNA binding proteins (Jingna et al., 2015), lncRNAs are particularly effective in the formation of protein complexes. While HOTAIR also employs this mechanism archetype, probably the most well-known example would be ribosomal RNAs. The full diversity of lncRNA function remains to be determined, which is why lncRNAs are currently one of the most active areas of research.
Figure 1.3 Schematic of the molecular mechanism archetypes for lncRNAs. The diagram shows lncRNAs acting as signals, decoys, guides, and scaffolds within both the cytoplasm and nucleus of the cell. Adapted from Wang and Chang (2011).
LncRNAs in human disease
Given characterization of lncRNAs above, it is not surprising that lncRNAs are associated with multiple diseases. The lncRNADisease database contains entries for experimentally determined lncRNAs associated with disease based upon literature
searches (Chen et al., 2013). They currently have 478 lncRNA entries and they have found associations with 166 diseases. Although it may be reflective of the degree to which diseases receive focus, lncRNAs have been found to have particularly critical roles in cardiac diseases and cancers. One example of a critical lncRNA in cardiac disease is tie-1 AS regulates the expression of tyrosine kinase with immunoglobulin-like and EGF-like domains 1 (tie-1). Tie-1 helps maintain cell junctions and when overexpressed, tie-1 leads to impairment of vascular development (Li et al., 2010). Several examples of cancer associated lncRNAs exist. One previously mentioned example is HOTAIR, which has been shown to be overexpressed in and contribute to breast cancer (Gupta et al., 2010). Another interesting cancer associated lncRNA is metastasis-associated lung adenocarcinoma transcript 1 (MALAT1). It has been associated with 16 different cancers, and its overexpression correlates with metastasis and thus poor prognosis (Wei and Niu, 2015). These lncRNAs play critical roles in the progression of cancers and offer potential treatment targets, however, lncRNAs are particularly sensitive to alterations in cell state and therefore offer excellent means of diagnosis and prognosis (Xiong et al., 2016). The previously mentioned PCA3 is one such example. The role of lncRNAs in autism spectrum disorders (ASD) is still being determined, however given that lncRNAs impact development and show elevated expression in the brain (see above), they are likely contributors. This is further supported by the Ziats and Rennert (2013) study which detected 222 differentially expressed lncRNAs between ASD and control brain samples.
1.3 Co-expression network analysis
Network analysis is based upon graph theory, one of the disciplines in discrete mathematics. The first instance of the application of graph theory was in 1736 by the mathematician Euler. It is commonly used to map networks. In networks, nodes or vertices are entities such as genes, which are connected by edges. This connection implies a relationship. The nature of this relationship determines whether the network is directed or undirected. Directed networks imply causality. An example would be in a gene regulatory network. If gene A upregulates gene B then the directionality would be from A to B, however this does not imply that when gene B is downregulated, gene A is upregulated. In undirected networks, there is no causality or direction. For the previous example in an undirected network, gene A and gene B would simply share a connection. Mapping of biological networks is a common practice. Graph theory offers a semantic view of data and has a wide variety of applications. It has been used to map and understand brain function (Mears and Pollard, 2016), describe evolution (Shakarian et al., 2012) and design and discover drugs (Takigawa and Mamitsuka, 2013). The idea of the co-expression networks evolved from the work of Butte and Kohane (1999), who initially proposed the employment of graph theory to biological networks. Bulle and Kohane were the first to point to the idea that nodes within biological networks can be connected via correlations. This eventually led to the idea of co-expression networks. Their idea was that if a correlation measured via any correlation measurement was above a threshold, then an edge or connection was established.
Co-expression networks are constructed through the measure of correlation between expression profiles for two genes. Examples of correlation measures include Pearson product moment correlation and Spearman correlation. Once this value has been determined then a connection is established either through a hard threshold such as ranking the interactions and taking a certain high percentile or by applying a weighted or soft threshold where the connectivity is a continuous measure (Langfelder and Horvath, 2008). Genes can then be clustered into what is referred to as modules based on their similarities in expression profiles. These modules can be measured for enrichment of terms, gene biotypes (i.e. lncRNAs, protein-coding genes, etc.) or any tag that can be assigned to the individual genes in comparison to a background. Therefore, genes of known function, such as many human protein-coding genes can be used to characterize genes of unknown function such as lncRNAs. Network analysis allows us to look for topology to determine the nature of interactions. Network topology refers to statistical measures which describe the distribution of nodes and edges. One commonly employed topology measure is the degree distribution. This measures the distribution of connections per node. For example in scale-free networks, plotting of the degree distribution should follow a linear pattern. These topologies can be overlaid to determine the strength of the network and note any changes between overlays. Network analysis also allows for a measure of centrality, which is the degree of the node or otherwise stated the number of connections or the summation of the connection weights for weighted networks. Genes showing high connectivity or centrality are assumed to be critical to the process being studied (Serin et al., 2016).
Co-expression network analysis is a “guilt by association” approach that has been widely employed in research (Serin et al., 2016). The first gene co-expression network analysis was performed by Carter et al. (2004) to identify critical genes in the determination of cell state. Giuletti et al. (2016) built a co-expression network to identify critical genes in the development of pancreatic ductal adenocarcinoma. Lv et al. (2016) utilized a co-expression network to identify nitrogen responsive long intergenic non-coding RNAs (lincRNAs) in maize. Oliver et al. (2014) applied a co-expression network to disease gene prioritization for epileptic encephalopathy. These are just a few examples of the wide applications of this approach. The key assumption of co-expression network analysis is that over a range of samples, expression patterns will be shared by genes in the same pathways, between interacting partners, and genes that share functions.
1.4 Machine learning
Machine learning is a field comprised of methods for the identification of patterns from complex data to complete a given task. The idea of machine learning was first proposed by Alan Turing (1950) in his famous Turing test, in which he proposed that it may be possible for a machine learn to the point that it would be impossible for an interviewer to discern whether they were talking to a machine or a person. The first implementation of machine learning was the perceptron machine (Rosenblatt, 1958), which later became a binary classification algorithm that adjusts its decision boundary dependent on input data. This was shortly followed by the KNN algorithm which classify unknown instances by employing a distance metric and determining the classification of
the closest instances from the training set (Cover and Hart, 1967). The adoption of machine learning into the field biological science was heralded by Ted Shortliffe, who was the first to employ it to solve biological problems (Shortliffe, 1973).
Machine learning is becoming ubiquitous as it is employed in nearly every facet of business and technology (Jordan and Mitchell, 2015). In biology, its ability to make classifications based on large complex datasets make a valuable asset. The identification of a suitable machine learning problem can be the most time-consuming in the field of bioinformatics and requires domain-specific knowledge. Machine learning requires a task, a means of scoring the performance of the algorithm to perform this task, and experience upon which to learn. The experience itself is data, and the nature of this data determines the type of machine learning problem. If the data is unlabeled, then the task is unsupervised. Common tasks include clustering such as in a co-expression network, rule association, and dimensionality reduction. Rule association is the search for reliable association between fields in data. It is commonly used for sales transactions, in that if someone buys product A then they are likely to buy product B as well. A more pertinent example within biology would be the mining of a transcriptome to find that if genes are upregulated in tissue A, then they are down regulated in tissue B. Dimensionality reduction, as the name implies, are the methods for reducing the number of dimensions within data. This reduction allows for easier training of models and can decrease the probability of overfitting of models (high performance in training but poor real world performance). For example, Kim et al. (2016) recently applied self-organizing maps,
which are a form of artificial neural networks, to ultrasonography images. The group found patterns which led to the discernment of appendicitis.
However, if the data is labeled, for example disease versus non disease gene, then the machine learning algorithm is said to be supervised learning. The most common task for supervised machine learning is classification. These tasks seek to devise a model based upon examples with known classes to determine the class of unknown entities. Support vector machine (SVM) is a popular algorithm for machine learning. It is well suited to biological data as it deals well with high dimensionality and numerical versus categorical data (Cortes and Vapnik, 1995; Kourou et al., 2014). It has been applied to diagnosing attention deficit hyperactive disorder using neuropsychological data (Bledsoe et al., 2016), diagnosing gastric cancer using serum biomarkers (Tong et al., 2016), and determining the onset of Alzheimer’s disease using magnetic resonance imaging (Wei et al., 2016). The algorithm can be used for binary classifier that seeks to find a decision boundary between two groups plotted with their features acting as dimensions. The decision boundary that is found has the widest possible margin, which is the greatest distance from the closes training instances on either side of the decision boundary.
1.5 Candidate gene prioritization
Gene prioritization servers are particularly useful. Most disorders that are studied are complex in that they are multigenic. For example, there are over 400 genes associated with autism spectrum disorder (ASD) (Abrahams et al., 2013). When attempting to find genes associated with a disorder, association studies can lead to large gene lists. This
becomes a difficulty because each of those genes within the list is challenging to validate and test. Another difficulty in dealing with complex diseases is the extent of interaction. Two hypotheses are considered for complex diseases, one is the common disease common variant hypothesis, which argues that there exist many alleles with low penetrance which impact the expression of the disease. A counter to this hypothesis is the common disease rare variant hypothesis which argues that rare alleles with high penetrance lead to expression of the disease (Schork et al., 2009). While both hypotheses can be considered equally valid depending on the disease in question, disease prioritization servers operate on the common disease rare allele hypothesis. These systems are designed to prioritize gene lists based upon their likelihood to be associated with a given disease. Often these systems will utilize data from several sources including expression data, literature, physical interactions, and annotations. One guiding principle of prioritization systems is that disease genes are convergent on pathways which has been verified for ASD (Parikshak et al., 2013), and disruption of these pathways lead to disease. Therefore if a prioritization can identify genes within a shared pathway of disease genes, then these genes can be implicated in the disorder. GeneMANIA is an interesting example of a prioritization server. The user supplies their own gene list and genes with the highest association through analysis of co-expression, interactions, pathways, and co-localization, are returned to the user (Warde-Farley et al., 2010). The ENDEAVOUR system employs a similar methodology. Users submit a training set which is then passed through multiple models to allow for the prioritization of a given candidate gene list (Tranchevent et al., 2008).
1.6 My research
In chapter 2, we demonstrate the application of co-expression networks to determining the role of lncRNAs in cancer. In chapter 3 we employed co-expression network analysis to characterize the role of lncRNAs in neural development and autism spectrum disorders. In chapter 4, we apply the SVM algorithm to predict and prioritize ASD risk genes. In chapter 5, we show the construction of PGAR, a system incorporating co-expression analysis and machine learning results from previous studies (chapters 3 and 4) to prioritized genes for their association with ASD.
References
Abrahams, B. et al. (2013) SFARI Gene 2.0: A community-driven knowledgebase for the autism spectrum disorders (ASDs). Mol Autism, 4, 36.
Altschul, S. et al. (1990) Basic local alignment search tool. J. Mol. Biol, 215, 403-410. Ashburner et al. (2000) Gene ontology: tool for the unification of biology Nat Genet, 25,
25-29.
Bartlett, A. et al. (2016) Generations of interdisciplinarity in bioinformatics. New Genet Soc, 35, 186-209.
Bateman, A. et al. (2015) UniProt: A hub for protein information. Nucleic Acids Res, 43, D204-212.
Benson, D. et al. (2013) GenBank. Nucleic Acids Res, 41, D36-D42.
Bernstein, F. et al. (1977) The protein data bank: A computer-based archival file for macromolecular structures. J Mol Biol, 112, 535-542.
Bledsoe, J. et al. (2016) Diagnostic classification of ADHD versus control: Support vector machine classification using brief neuropsychological assessment. J Atten Disord, [Epub ahead of print].
Brannan, C. et al. (1990) The product of the H19 gene may function as an RNA. Mol Cell Biol, 20, 28–36.
Brenner, S. (1999) Errors in genome annotation. Trends Genet, 15, 132-133.
Brockdorff, N. et al. (1992) The product of the mouse Xist gene is a 15 kb inactive X-specific transcript containing no conserved ORF and located in the nucleus. Cell, 71, 515-526.
Brown C. et al. (1992) The human XIST gene: analysis of a 17 kb inactive X-specific RNA that contains conserved repeats and is highly localized within the nucleus. Cell, 71, 527–542.
Bussemakers, M. et al. (1999) DD3: A new prostate-specific gene, highly overexpressed in prostate cancer. Cancer Res, 59, 5975–5979.
Butte, A and Kohane, I. (1999) Unsupervised knowledge discovery in medical databases using relevance networks. Proc AMIA Symp, 711-715.
Carter, S. et al. (2004) Gene co-expression network topology provides a framework for molecular characterization of cellular state. Bioinformatics 20, 2242-2250.
Chen, G. et al. (2013) LncRNADisease: A database for long-non-coding RNA-associated diseases. Nucleic Acids Res, 41, D983-D986.
Clerget, G. et al. (2015) Small non-coding RNAs: A quick look in the rearview mirror. Methods Mol Biol, 1296, 3-9.
Cortes, C. and Vapnik, V. (1995) Support-vector networks. Machine Learning, 20, 273-297.
Cover, T., & Hart, P. (1967). Nearest neighbor pattern classification. IEEE transactions on information theory, 13, 21-27.
Dai, L. et al. (2012) Bioinformatics clouds for big data manipulation. Biol Direct, 7, 43. Derrien, T. et al. (2012) The GENCODE v7 catalog of human long noncoding RNAs: Analysis of their gene structure, evolution, and expression. Genome Res, 22, 1775–1789. Devos, D. and Valencia, A. (2001) Intrinsic errors in genome annotation. Trends Genet, 17, 429-431.
Fernandez-Suarez, X. et al. (2014) The 2014 Nucleic Acids Research Database Issue and an updated NAR online Molecular Biology Database Collection. Nucleic Acids Res, 42, D1–D6.
Fickett, J. (1982) Recognition of protein coding regions in DNA sequences. Nucleic Acids Res, 10, 5303-5318.
Finn, R. et al. (2016) The Pfam protein families database: Towards a more sustainable future. Nucleic Acids Res, 44, D279-D285.
Gabory, A. et al. (2006) The H19 gene: regulation and function of a non-coding RNA. Cytogenet Genome Res, 113, 188-93.
Giulietti, M. et al. (2016) Weighted gene co-expression network analysis reveals key genes involved in pancreatic ductal adenocarcinoma development. Cell Oncol (Dordr), [Epub ahead of print].
Gupta, R. et al. (2010) Long non-coding RNA HOTAIR reprograms chromatin state to promote cancer metastasis. Nature 464, 1071-1076.
Guttman, M. et al. (2013) Ribosome profiling provides evidence that large non-coding RNAs do not encode proteins. Cell, 154, 240-51.
Hall, J. et al. (1990) Linkage of early-onset familial breast cancer to chromosome 17q21. Science, 250, 1684-1689.
Harrow, J. et al. (2012) GENCODE: The reference human genome annotation for the ENCODE project. Genome Res, 22, 1760-1774.
Hawrylycz, M. et al. (2012) An Anatomically Comprehensive Atlas of the Adult Human Brain Transcriptome. Nature, 489, 391-399.
Hessels, D. et al. (2003) DD3(PCA3)-based molecular urine analysis for the diagnosis of prostate cancer. Eur Urol, 44, 8–16.
Huang da, W. et al. (2009) Systematic and integrative analysis of large gene lists using DAVID bioinformatics resources. Nat Protoc, 4, 44-57.
Huang, L. et al. (2014) Overexpression of long noncoding RNA HOTAIR predicts a poor prognosis in patients with cervical cancer. Arch Gynecol Obstet, 290, 717-723.
Iyer, M. et al. (2015) The landscape of long noncoding RNAs in the human transcriptome. Nat Genet, 47, 199-208.
Jacob F. and Monod J. (1961) Genetic regulatory mechanisms in the synthesis of proteins. J Mol Biol, 3, 318–356.
Jinga, S. et al. (2015) Computational Prediction of RNA-Binding Proteins and Binding Sites. Int J Mol Sci, 16, 26303–26317.
Johnsson, P. et al. (2014) Evolutionary conservation of long non-coding RNAs; sequence, structure, function. Biochim Biophys Acta, 1840, 1063-1071.
Jordan, M. and Mitchell, T. (2015) Machine learning: Trends, perspectives, and prospects. Science, 349, 255-60.
Kapranov, P. et al. (2007) RNA maps reveal new RNA classes and a possible function for pervasive transcription. Science, 316, 1484-1488.
Karapetyan, A. et al. (2013) Regulatory roles for long ncRNA and mRNA. Cancers (Basel), 5, 462-490.
Kent, W. et al. (2002) The human genome browser at UCSC. Genome Res, 12, 996-1006. Kim, K. et al. (2016) Automatic extraction of appendix from ultrasonography with self-organizing map and shape-brightness pattern learning. Biomed Res Int, [Epub ahead of print].
Kino, T. et al. (2010) Noncoding RNA gas5 is a growth arrest- and starvation-associated repressor of the glucocorticoid receptor. Sci Signal, 3, ra8.
Koonin, E. and Galperin, M. (2003) Sequence - Evolution - Function: Computational approaches in comparative genomics. Boston: Kluwer Academic. Chapter 5, Genome Annotation and Analysis.
Kourou, K. et al. (2014) Machine learning applications in cancer prognosis and prediction. Comput Struct Biotechnol J, 13, 8-17.
Kung, J. et al. (2013) Long noncoding RNAs: past, present, and future. Genetics, 193, 651-669.
Lander, E. et al. (2001) Initial sequencing and analysis of the human genome. Nature, 409, 860-921.
Langfelder, P. and Horvath, S. (2008) WGCNA: an R package for weighted correlation network analysis. BMC Bioinformatics, 9, 559.
Laurent, G. et al. (2015) The landscape of long non-coding RNA classification. Trends Genet. 31, 239-251.
Lewitter, F. et al. (2009) The need for centralization of computational biology resources. PLoS Comput Biol, 5, e1000372.
Li, K. et al. (2010) A noncoding antisense RNA in tie-1 locus regulates tie-1 function in vivo. Blood, 115, 133-139.
Lin, M. et al. (2011) PhyloCSF: A comparative genomics method to distinguish protein coding and non-coding regions. Bioinformatics, 27, i275-i282.
Luscombe, N. et al. (2001) What is bioinformatics? A proposed definition and overview of the field. Methods Inf Med, 40, 346-358.
Lv, Y. et al. (2016) Genome-wide identification and functional prediction of nitrogen-responsive intergenic and intronic long non-coding RNAs in maize (Zea mays L.). BMC Genomics, 17, 350.
Lysenko, A. et al. (2016) Representing and querying disease networks using graph databases. BioData Min, 9, 23.
Ma, L. et al. (2013) On the classification of long non-coding RNAs. RNA Biol, 10, 925-933.
Mears, D. and Pollard, H. (2016) Network science and the human brain: Using graph theory to understand the brain and one of its hubs, the amygdala, in health and disease. J Neurosci Res, 94, 590-605.
Mewes, H. et al. (2010) MIPS: Curated databases and comprehensive secondary data resources in 2010. Nucleic Acids Res, 39, D220-D224.
Nawrocki, E. et al. (2015) Rfam 12.0: Updates to the RNA families database. Nucleic Acids Res, 43, D130-D137.
Necsulea, A. et al. (2014) The evolution of lncRNA repertoires and expression patterns in tetrapods. Nature, 505, 635-640.
Obeidat, M. et al. (2015) DRIP – Data rich, information poor: A concise synopsis of data mining. Universal Journal of Management, 3, 29-35.
Oliver, K. et al. (2014) Harnessing gene expression networks to prioritize candidate epileptic encephalopathy genes. PloS One, 9, e102079.
Parikshak, N. et al. (2013) Integrative functional genomic analyses implicate specific molecular pathways and circuits in autism. Cell, 155, 1008-1021.
Percudani, R. et al. (2013) Ureidoglycolate hydrolase, amidohydrolase, lyase: how errors in biological databases are incorporated in scientific papers and vice versa. Database (Oxford), 2013, bat071.
PubMed Health [Internet]. Bethesda (MD): National Library of Medicine (US); [updated
2011 Jan 1; cited 2011 Jan 6]. Available from:
http://www.ncbi.nlm.nih.gov/pubmedhealth/
Quek, X. et al. (2015) LncRNAdb v2.0: Expanding the reference database for functional long noncoding RNAs. Nucleic Acids Res, 43, D168-D173.
Rosenblatt, F. (1958). The perceptron: a probabilistic model for information storage and organization in the brain. Psychological review, 65, 386.
Sanger, F. and Tuppy, H. (1951) The amino-acid sequence in the phenylalanyl chain of insulin. I. the identification of lower peptides from partial hydrolysates. Biochem J. 49, 463-481.
Scalia-Wilbur, J. et al. (2016) Breast cancer risk assessment: Moving beyond BRCA 1 and 2. Semin Radiat Oncol, 26, 3-8.
Schatz, M. et al. (2010) Cloud computing and the DNA data race. Nat Biotechnol, 28, 691–693.
Schork, N. et al. (2009) Common vs. Rare Allele Hypotheses for Complex Diseases. Curr Opin Genet Dev, 19, 212–219.
Schulze, A. and Downward, J. (2000) Analysis of gene expression by microarrays: Cell biologist’s gold mine or minefield? J Cell Sci, 113, 4151-4156.
Schnoes, A. et al. (2009) Annotation error in public databases: Misannotation of molecular function in enzyme superfamilies. PLoS Comput Biol, 5, e1000605.
Serin, E. et al. (2016) Learning from co-expression networks: Possibilities and challenges. Front Plant Sci, 7, 444.
Sewell, J., & Thede, L. (2012). Informatics and nursing: Opportunities and challenges (4th ed.). Philadelphia: Lippincott,Williams &Wilkins.
Shakarian, P. et al. (2012) A review of evolutionary graph theory with applications to game theory. Biosystems, 107, 66-80.
Shortliffe, E. et al. (1973) An artificial intelligence program to advise physicians regarding antimicrobial therapy. Comput Biomed Res, 6, 544-560.
Taft, R. et al. (2007) The relationship between non-protein-coding DNA and eukaryotic complexity. Bioessays, 29, 288-299.
Takigawa, I. and Mamitsuka, H. (2013) Graph mining: procedure, application to drug discovery and recent advances. Drug Discov Today, 18, 50-57.
Thompson, D. and Dinger, M. (2016) Endogenous microRNA sponges: evidence and controversy. Nat Rev Genet, 17, 272-283.
Tong, W. et al. (2016) Serum biomarker panels for diagnosis of gastric cancer. Onco Targets Ther, 9, 2455-2463.
Tranchevent, L. et al. (2008) Endeavour update: a web resource for gene prioritization in multiple species. Nucleic Acids Res, 36, W377-W384.
Turing, A. (1950) Computing machinery and intelligence. Mind, 59, 433-460.
Ulitsky, I. and Bartel, D. (2013) LincRNAs: genomics, evolution, and mechanisms. Cell, 154, 26-46.
Wan, Y. et al. (2014) Landscape and variation of RNA secondary structure across the human transcriptome. Nature, 505, 706-709.
Wang, J. et al. (2010) CREB up-regulates long non-coding RNA, HULC expression through interaction with microRNA-372 in liver cancer. Nucleic Acids Res, 38, 5366-5383.
Wang, K. and Chang, H. (2011) Molecular mechanisms of long noncoding RNAs. Mol Cell, 43,904-914.
Wang, L. et al. (2013) CPAT: Coding-Potential Assessment Tool using an alignment-free logistic regression model. Nucleic Acids Res, 41, e74.
Warde-Farley, D. et al. (2010) The GeneMANIA prediction server: Biological network integration for gene prioritization and predicting gene function. Nucleic Acids Res, 38, W214-W220.
Wei, R. et al. (2016) Prediction of conversion from mild cognitive impairment to Alzheimer's disease using MRI and structural network features. Front Aging Neurosci, 8, 76.
Wei, Y. and Niu, B. (2015) Role of MALAT1 as a Prognostic Factor for Survival in Various Cancers: A Systematic Review of the Literature with Meta-Analysis. Dis Markers, [Epub].
Welch, L. et al. (2014) Bioinformatics curriculum guidelines: Toward a definition of core competencies. PLoS Comput Biol. 10, e1003496.
Williamson, E (1987) Management information: Avoiding the data rich, information poor syndrome. Mich Hosp, 6, 19-23.
Xiong, X. et al. (2016) Long non-coding RNAs: An emerging powerhouse in the battle between life and death of tumor cells. Drug Resist Updat, 26, 28-42.
Xu, J. et al. (2016) A comprehensive overview of lncRNA annotation resources. Brief Bioinform, [Epub ahead of print].
Yang, J. et al. (2016) Non-coding RNAs: An introduction. Adv Exp Med Biol, 886, 13-32. Zhao, Z. et al. (2016) Fast steerable principal component analysis. IEEE Trans Comput Imaging, 2, 1-12.
Ziats, M. and Rennert, O. (2013) Aberrant expression of long noncoding RNAs in autistic brain. J Mol Neurosci, 49, 589-593.
Zou, D. et al. (2015) Biological databases for human research. Genomics Proteomics Bioinformatics, 13, 55-63.
CHAPTER II - CO-EXPRESSION NETWORK ANALYSIS OF HUMAN LNCRNAS AND CANCER GENES
Steven Cogill and Liangjiang Wang
Department of Genetics and Biochemistry, Clemson University, Clemson, SC 29634, USA
Published: Cancer Inform, 13, 49–59 (2014)
Abstract
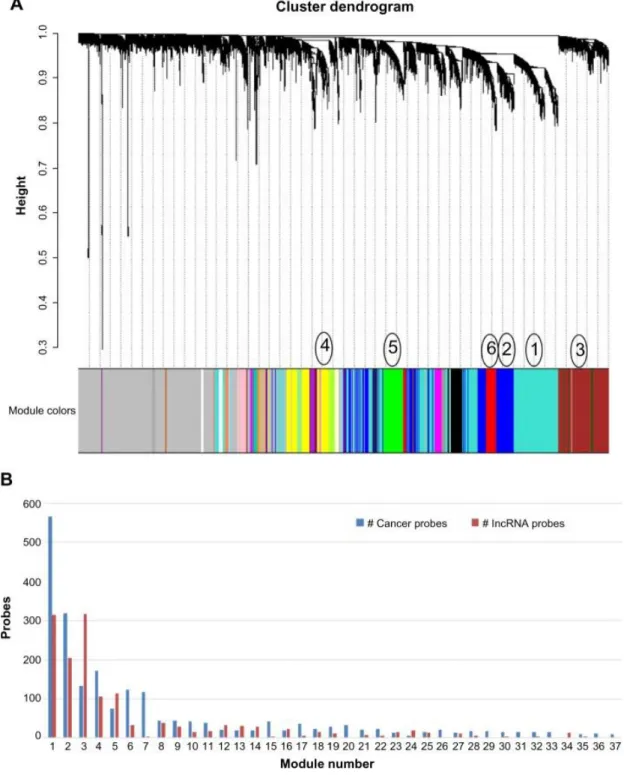
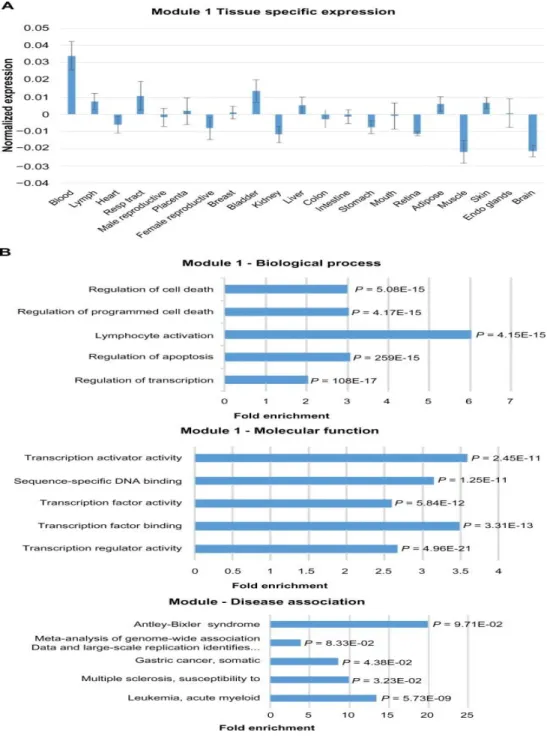
We used gene co-expression network analysis to functionally annotate long noncoding RNAs (lncRNAs) and identify their potential cancer associations. The integrated microarray dataset from our previous study was used to extract the expression profiles of 1,865 lncRNAs. Known cancer genes were compiled from the Catalogue of Somatic Mutations in Cancer and UniProt databases. Co-expression analysis identified a list of previously uncharacterized lncRNAs that showed significant correlation in expression with core cancer genes. To further annotate the lncRNAs, we performed a weighted gene co-expression network analysis, which resulted in 37 co-expression modules. Three biologically interesting modules were analyzed in depth. Two of the modules showed relatively high expression in blood and brain tissues, whereas the third module was found to be downregulated in blood cells. Hub lncRNA genes and enriched functional annotation terms were identified within the modules. The results suggest the utility of this approach as well as potential roles of uncharacterized lncRNAs in leukemia and neuroblastoma.
2.1 Introduction
Long noncoding RNAs (lncRNAs) are a major class of noncoding RNAs and exceed 200 nucleotides in length. Originally suspected of being the result of transcriptional noise, lncRNAs have been shown to have a broad range of functions including transcriptional regulation, mediating protein interactions, and influencing mRNA splicing (Cech and Steitz, 2014). The ENCODE project has demonstrated that 74.7% of the human genome is transcribed, and more than 9,000 lncRNAs have been annotated (Djebali et al, 2012; Derrien et al., 2012). A large number of lncRNAs have also been identified in many other organisms. For instance, the FANTOM3 annotation project has discovered 34,030 lncRNA transcripts in the mouse genome (Maeda et al., 2006). These studies have led to the projection that there may be more lncRNAs than protein-coding genes. The roles in biological processes and mechanism of action for the majority of lncRNAs have not yet been determined (Calibi et al., 2011; Wang and Tran, 2013). For functional annotation, a weighted gene co-expression network analysis (WGCNA) of lncRNAs with well-annotated protein-coding genes offers an approach for insight into the biological roles of lncRNAs (Langfelder and Horvath, 2008).
A definitive link between cancer and lncRNAs has been established through disease state studies and their functions in development and cellular differentiation (Cheetham et al., 2013; Iyengar et al., 2014; Zhu et al., 2014). Examples of well-studied lncRNAs associated with cancer include HOX antisense intergenic RNA (HOTAIR), prostate cancer antigen 3 (PCA3) and metastasis-associated lung adenocarcinoma
transcript 1 (MALAT1). HOTAIR interacts with Polycomb Recessive Complex 2 (PRC2) and the LSD1/CoREST/ REST complex to modify histones, which results in silencing at multiple sites (Rinn et al., 2007; Tsai et al., 2010). PCA3 in contrast has no known function but acts as an effective noninvasive diagnostic marker for prostate cancer (Bussenmakers et al., 1999; Hessels et al., 2003). MALAT1, which was first discovered in a differential expression study of non–small-cell lung cancer tumors, has been linked to 16 different cancer types including cervical cancer and hepatocellular carcinoma (Ji et al., 2003; Chen et al., 2013; Guo et al., 2010; Luo et al., 2006). These three lncRNAs share the common feature found in most cancer associated lncRNAs, which are overexpressed in cancerous tissues (Bussemakers et al., 1999; Luo et al., 2006; Huang et al., 2014). The significant changes in expression levels aid in determining the function of these cancer-associated lncRNAs, which have become important for diagnosis and prognosis of cancers.
This study is unique in the application of co-expression analysis to normal (noncancerous) tissues to determine lncRNA and cancer gene associations. Previous studies have focused on differential expression between normal and cancerous tissues. An example is the genome-wide differential and co-expression analysis of hepatoblastoma tissues (Dong et al., 2014). Bipartite network analysis has also been performed to predict lncRNA–disease associations (Yang et al., 2014). In this study, we use a previously compiled dataset consisting of 2,968 microarray expression profiles across a wide spectrum of tissues (Wang et al., 2010). All expression profiles in this dataset were obtained using publicly available data from the Affymetrix HG-U133 Plus 2.0 Array
platform, which provides suitable genome coverage for known protein-coding genes with 98.6% of our cancer gene list being represented in the array probes. This microarray platform also contains probes for 1,970 lncRNAs (Zhang et al., 2012). By utilizing the available data for co-expression analysis, we have examined the previously uncharacterized lncRNAs for their potential role in cancer and functional annotation.
2.2 Methods
Gene lists
A core and an extended gene list of known cancer genes were compiled for this study (Additional file A-1). The core list comprised the known causal cancer genes from the Catalogue of Somatic Mutations in Cancer (COSMIC) Cancer Gene Census List from the Wellcome Trust Sanger Institute (Futreal et al., 2004). Redundant genes and genes that do not have protein-level expression were removed from the list. The UniProt knowledgebase was used to determine if there was evidence of protein-level expression (UniProt Consortium, 2014). The core list consisting of 472 protein-coding cancer genes was used to select microarray probes for the co-expression analysis of cancer genes and lncRNAs. To expand the core list for all plausible cancer genes, additional cancer genes not present within the core list were added to create the extended gene list (Additional file A-1). A custom search query was used to search the UniProt knowledgebase for additional cancer genes. Among the search criteria was a requirement for evidence of protein-level expression. The extended list consisting of 951 protein-coding cancer genes was used to select microarray probes for the WGCNA. The lncRNAs used in this study
(Additional file A-1) have at least one corresponding probe on the Affymetrix HG-U133 Plus 2.0 Array.
Microarray Expression Data
The microarray gene expression dataset was compiled in our previous study (Wang et al., 2010). The dataset had 2,968 microarray gene expression profiles generated using the Affymetrix HG-U133 Plus 2.0 Array with 54,675 probe sets. A data integration method was developed to combine the expression profiles from 131 different microarray studies into a single dataset (Wang et al., 2010). Most human tissue types were represented in the integrated microarray dataset, and the high quality of the dataset was demonstrated by examining tissue-specific gene expression patterns as well as for identifying co-expressed genes.
Co-expression analysis of cancer genes and lncRNAs
For each cancer gene probe in the core list, co-expression was calculated against all lncRNA probes individually using the microarray expression data. Co-expression was measured by Pearson product–moment correlation with Microsoft Excel (2013). The top 10 absolute correlation values were kept. P-values were calculated using R 3.0.2 (R Core Team, 2013).Due to the high degrees of freedom, the P-value after Bonferroni correction for multiple testing in each correlation measurement returned a significance of <6.53E-13. Cancer gene and lncRNA function were retrieved from the NCBI Gene database (Maglott et al., 2011).Cancer gene disease associations were provided in the COSMIC Cancer Gene Census List (Futreal, 2004).