Northumbria Research Link
Citation: Ahmed, Junaid, Gao, Bin and Woo, Wai Lok (2020) Sparse Low-Rank Tensor Decomposition
for Metal Defect Detection Using Thermographic Imaging Diagnostics. IEEE Transactions on
Industrial Informatics. ISSN 1551-3203 (In Press)
Published by: IEEE
URL: https://doi.org/10.1109/tii.2020.2994227 <https://doi.org/10.1109/tii.2020.2994227>
This
version
was
downloaded
from
Northumbria
Research
Link:
http://nrl.northumbria.ac.uk/id/eprint/43955/
Northumbria University has developed Northumbria Research Link (NRL) to enable users to access
the University’s research output. Copyright © and moral rights for items on NRL are retained by the
individual author(s) and/or other copyright owners. Single copies of full items can be reproduced,
displayed or performed, and given to third parties in any format or medium for personal research or
study, educational, or not-for-profit purposes without prior permission or charge, provided the authors,
title and full bibliographic details are given, as well as a hyperlink and/or URL to the original metadata
page. The content must not be changed in any way. Full items must not be sold commercially in any
format or medium without formal permission of the copyright holder. The full policy is available online:
http://nrl.northumbria.ac.uk/pol
i cies.html
This document may differ from the final, published version of the research and has been made
available online in accordance with publisher policies. To read and/or cite from the published version
of the research, please visit the publisher’s website (a subscription may be required.)
Abstract— With the increasing use of induction thermography (IT) for non-destructive testing (NDT) in the mechanical and rail industry, it becomes necessary for the manufactures to rapidly and accurately monitor the health of specimens. The most general problem for IT detection is due to strong noise interference. In order to counter it, general post-processing is carried out. However, due to the more complex nature of noise and irregular shape specimens, this task becomes difficult and challenging. In this paper, a low-rank tensor with a sparse mixture of Gaussian (MoG) (LRTSMoG) decomposition algorithm for natural crack detection is proposed. The proposed algorithm models jointly the low rank tensor and sparse pattern by using a tensor decomposition framework. In particular, the weak natural crack information can be extracted from strong noise. Low-rank tensor based iterative sparse MoG noise modeling is carried out to enhance the weak natural crack information as well as reducing the computational cost. In order to show the robustness and efficacy of the model, experiments are conducted for natural crack detection on a variety of specimens. A comparative analysis is presented with general tensor decomposition algorithms. The algorithms are evaluated quantitatively based on signal-to-noise-ratio (SNR) along with the visual comparative analysis. Index Terms— Inductive thermography, tensor decomposition, joint low-rank sparse tensor decomposition, weak signal detection.
I. INTRODUCTION
EFECT detection encountered in manufacturing industry using the imaging diagnostic is in high demand. The authors in [1], worked on the radiography images for the metallic specimen with weld type defect detection. In [2], solar wafer images to detect defects on the multi-crystalline structure using the wavelet analysis was proposed. Imaging diagnostic using Haar wavelets was proposed for hot-rolled steel defects analysis and quantification [3]. These recent work show that the imaging diagnostic plays an important role in the science and manufacturing industry to detect occurring defects [4]. In the non-destructive testing (NDT) and structural health monitoring (SHM) application, thermography [5] is a commonly used technique
and method, owing to its unique characteristics of fast, wide and non-contact inspection.
The inductive thermography (IT) based imaging diagnostic has been widely used in the NDT and SHM applications for metal defect detection and quantification [6], [7]. Bai et al. [8], [9] applied IT for metallic specimen type of defect detection. The metal defects were detected by separating the anomalous thermal patterns. Chang et al. [10] utilized the inductive thermography for metal specimen image damage detection and separation. For crack detection on metallic specimen, Genest et al. [11] used the inductive thermography. Jackal and Netzelmann [12] utilized the IT to study the external influence of the magnetic field for the thermal contrast of crack type defects. For the defect detection and analysis in the thermal imaging diagnostic system, the IT utilizes the heating principle by the eddy current on the defect region. The change in temperature on the defect profile produces temperature contrast between the defect and non-defect area. This is the general idea behind the use of thermal imaging diagnostic system. More application of IT can be found in [13]–[16] which include, small defects on irregular shapes, micro cracks due to fatigue, corrosion detection of blisters in the coating environment.
In order to scan and process large- and long-size specimen, motion and scanning based thermographic methods are considered effective. However, in case of eddy current pulse thermographic approach, the method may suffer from the skin effect and uneven heating [17],[18]. The problem of defect detection becomes more difficult when the defects are with irregular shape and in sub-surface. The initial investigations into the dynamic motion based scanning thermographic approach were presented in [19]. The authors applied the induction coil based line heating scanning principle to detect the sub-surface defects. The simulation study incorporating the motion were carried out for the parameter selection. In addition, the experimental studies were presented as a validation. In [20], the authors proposed a robotic arm based scanning approach for large composite specimen using low power excitation thermography. The simulation as well as experimental studies were presented to justify and validate the approach. Further, the existing post-processing algorithms were tested and analyzed. In [18], the authors proposed a dynamic motion based approach with scanning eddy current pulse thermography. The proposed approach gives the benefit of enhanced detection area along with enhanced defect detection efficiency. In [21], the authors proposed a joint scanning laser thermography approach to detect flat bottom holes in carbon fiber reinforced polymer. A scanning scheme along with the reconstruction approach is proposed to increase the defect detection efficiency of the existing state-of-the-art thermographic post-processing algorithms. The dynamic motion based approaches induce new insights of enhanced area and fast inspection into the induction heating based thermography. However, the advanced and problem oriented post-image processing is ever more
Sparse Low-Rank Tensor Decomposition for Metal Defect Detection
Using Thermographic Imaging Diagnostics
Junaid Ahmed, Bin Gao
(Corresponding Author),
Senior Member, IEEE
, Wai lok Woo,
Senior Member, IEEE
D
This paragraph of the first footnote will contain the date on which you submitted your paper for review. It will also contain support information, including sponsor and financial support acknowledgment. For example, “This work was supported in part by the U.S. Department of Commerce under Grant BS123456.”
Junaid Ahmed and Bin Gao are with the School of Automation Engineering, University of Electronic Science and Technology of China (e-mail: [email protected] and bin_gao@ uestc.edu.cn).
Wai Lok Woo is with the Department of Computer and Information Sciences, Northumbria University, U.K.
necessary to cope with their shortcomings and enhance their detection capability.
The thermographic images in the raw form contain a lot of noise and the defect information is not clear. To tackle this problem feature extraction, sparse representation and other post image processing techniques are used to reduce the noise the extract the defects information [22]–[25]. Generally, the sparse representation and decomposition based algorithms are utilized to detect the defects using IT. Gao et al. [26] utilized the concept of variational Bayes decomposition and non-negative matrix decomposition to extract the features and defect information. Li et al. [27] proposed a defect detection process utilizing the closed loop pre and post-processing approach using IT. Gao et al. [28] proposed a variational Bayes approach with sub-group adaptive fine-tuning of sparse component for defect detection using IT. Xiao et al. [29] proposed a spatial-time-fusion algorithm for defect detection using IT. The proposed algorithm utilizes the independent component analysis to extract features and then from those features the automatic embedding using a genetic algorithm is done for defect profile extraction. Wang et al. [30] proposed a thermal pattern based contrast enhancing algorithm for defect detection using IT. The proposed algorithm utilizes the optical flow based approach to extract the features and further principal component analysis is carried out to improve the contrast of the thermal sequences.
In general, the sparse representation based matrix decomposition algorithms converts the whole thermographic sequences into the single matrix for decomposition and thus can only represent the single variability factor of the data. As the structure of the thermographic data is multi-factor, matrix decompositions cannot fully extract the information in such data [31]. In [32], CANDECOMP/PARAFAC
-alternating least square
(
CP_ALS) algorithm is proposed. This is a baseline algorithm used in the tensor decomposition approach. Andrew et al. [33] proposed an algorithm for multi-spectral imaging in video surveillance applications called online stochastic framework for tensor decomposition (OSTD). In [34], authors proposed a novel tensor based algorithm for background modeling by utilizing the core matrix in the tensor singular value decomposition (t-SVD) called improved robust tensor principal component analysis (IRTPCA).The tensor based algorithms generally suffer from high computational cost due to the multiple-array and multi-factor data. These algorithms generally consider noise with Gaussian distribution. However, for the case of thermal IT data, this consideration is not fully justified. In [35], [36], it was validated that noise follows a more complex distribution in thermal data. To efficiently tackle the problem of speed limitation and noise, we propose a low-rank tensor with sparse mixture of Gaussian (MoG) decomposition (LRTSMoG) algorithm for metal type defect detection by IT system. A tensor tri-decomposition based model is proposed. The model is solved iteratively for the low-rank and sparse components. For the low-low-rank component, a more fast and robust improved tensor nuclear norm based tensor singular value thresholding (t-SVT) [37] algorithm is proposed and for the sparse modeling, robust MoG [38] algorithm is proposed. The proposed LRTSMoG model inherits the properties of multi-factor tensor decomposition along with sparse MoG noise modeling. By modeling the low rank and sparse data iteratively in a tensor decomposition framework, we can process large thermal sequences data with less computation and model the noise more efficiently which helps to recover the defect information more accurately and with better resolution. The proposed model is tested for cracks on metallic specimen with irregular shape defects. A variety of metallic specimen are selected such as pipeline and axle with irregular shape having
artificial as well as natural defect profiles to validate its robustness and efficiency. Along with the visual results, the event-based signal-to-noise ratio (SNR) [39] and precision and recall based F-score [30] is also used for the quantitative analysis. To show the efficacy of the proposed model a comparison is also presented with recent and state-of-the-art tensor decomposition algorithms.
The rest of this paper has been organized as follows: The proposed algorithm is described in Section 2. The experimental setup and information about the specimen are given in Section 3. Results and discussions are elaborated in Section 4. Finally, conclusions are drawn in Section 5.
II. THE PROPOSED METHODOLOGY A. Proposed Algorithm
Let 𝑋 ∈ ℝ𝑛1×𝑛2×𝑘 be the data tensor containing the thermographic
image sequence. Here (𝑛1, 𝑛2) denote the spatial resolution of the tensor and 𝑘 represent the 𝑘𝑡ℎ three-way tensor. It can be decomposed into the low rank component 𝐿 ∈ ℝ𝑛1×𝑛2×𝑘, sparse component 𝑆 ∈
ℝ𝑛1×𝑛2×𝑘 and noise component 𝑁
𝑜∈ ℝ𝑛1×𝑛2×𝑘 as follows:
𝑋 = 𝐿 + 𝑆 + 𝑁𝑜 (1) The general low-rank sparse tri-decomposition optimization problem [40] can be formulated as:
min 𝐿,𝑆 {𝑠‖𝐿 𝑘‖ ∗+ 𝛬‖𝑆 𝑘‖ 2+ ‖𝑋 𝑘− 𝐿𝑘− 𝑆𝑘‖ 𝐹 2 } (2)
where 𝛬 is the regularizing parameters for 𝑆, ‖. ‖2 represents the 𝑙2 norm, ‖. ‖∗ represents the tensor nuclear norm for low rank term 𝐿, 𝑠 is the regularizing parameter for 𝐿, ‖. ‖𝐹 represents the Frobenious norm and 𝑘 represents the 𝑘𝑡ℎ three-way tensor. The problem in (2) is a two-fold problem. It is jointly solved for the low rank and sparse terms. First, we decompose the problem of (2) into two sub-problems for a better understanding.
(𝐿)𝑘= 𝑎𝑟𝑔 min 𝐿 {‖𝐿 𝑘− (𝑋𝑘− 𝑆𝑘−1)‖ 𝐹 2 + 𝑠‖𝐿𝑘‖ ∗} (3) (𝑆)𝑘= arg 𝑚𝑖𝑛 𝑆{‖(𝑋𝑘− 𝐿𝑘) − 𝑆𝑘‖𝐹 2 +𝛬‖𝑆𝑘‖ 2 2 } (4) Eqn. (3) is a classic convex optimization problem and it can be solved by using the tensor singular value thresholding algorithm[37]. For (4), we solve it by using the MoG matrix factorization [38].
1) Tensor Nuclear Norm (TNN) based singular value thresholding
(SVT): For the problem of (3), we propose an improved tensor nuclear
norm based algorithm.
a) Tensor singular value thresholding: Based on TNN a singular value thresholding can be performed to solve for (3). Let 𝑋𝑘− 𝑆𝑘−1= 𝑌𝑘, the problem is (3) can be reformulated as:
Table. I Tensor nuclear norm based tensor singular value thresholding algorithm (t-SVT)
1. Input Data 𝒀 ∈ ℝ𝒏𝟏×𝒏𝟐×𝒌,s>0
2. Compute fast fourier transform (fft) of 𝒀: 3. Compute 𝒀̅ = 𝐟𝐟𝐭(𝐘, [ ], 𝟑),
4. Perform matrix SVT on each frontal slice of 𝒀̅ :
𝐟𝐨𝐫 𝒊 = 𝟏, ⋯ , [𝒌 + 𝟏 𝟐 ] 𝐝𝐨 [𝑼, 𝑺, 𝑽] = 𝑺𝑽𝑫(𝒀̅𝒊); 𝑾𝒊= 𝑼 ∙ (𝑺 − 𝒔) +∙ 𝑽𝑻; 𝐞𝐧𝐝 𝐟𝐨𝐫 𝐟𝐨𝐫 𝒊 = [𝒌 + 𝟏 𝟐 ] + 𝟏, ⋯ , 𝒌 𝐝𝐨 𝑾𝒊= 𝐜𝐨𝐧𝐣(𝑾(𝒌−𝒊+𝟐)); 𝐞𝐧𝐝 𝐟𝐨𝐫 5. Compute output; 𝐋 = 𝐢𝐟𝐟𝐭(𝐖, [ ], 𝟑).
(𝐿)𝑘= 𝑎𝑟𝑔 min 𝐿 {‖𝐿 𝑘− 𝑌𝑘‖ 𝐹 2 + 𝑠‖𝐿𝑘‖ ∗} (5) According to [37], the problem in (5) has a closed form solution which is based on the definition of TNN. Let 𝑌 = 𝒰 ∗ 𝒮 ∗ 𝒱𝑇 represent the tensor SVD of 𝑌. 𝒰 represent the left singular tensor, 𝒮 represents the diagonal singular value tensor, 𝒱𝑇 shows the right singular tensor, and
∗ represents the tensor product. For each 𝑠>0, the tensor singular value thresholding operator can be given as:
𝐷𝑠(𝑌) = 𝒰 ∗ 𝒮𝑠∗ 𝒱𝑇, (6) where
𝒮𝑠= ifft((𝒮̅ − 𝑠)+,[ ], 3) (7) where ′ifft′ is the inverse fast fourier transform, 𝒮̅ represents those singular values from 𝒮 greater than 𝑠, 𝑠 represents the soft-thresholding operator. From (7) it can be observed that the entries of 𝒮̅ are real. Above (𝒮̅ − 𝑠)+ shows that only positive values are considered for evaluation. It should be noted here that this operator performs the soft-thresholding to singular values of 𝒮̅ (not 𝒮) of the frontal slice of 𝑌̅, which is effectively shrinking to zero. The tensor SVT can be called the proximity operator of TNN and further proofs and definition can be found in [37]. The steps of the TNN based tensor t-SVT algorithm are given in Table I.
1) Sparse Decomposition with MoG Distribution: For the other part
of the problem in (4), we solve it by the sparse decomposition algorithm of [38]. Let 𝑋𝑘− 𝐿𝑘= 𝐷𝑘 and 𝑆𝑘= 𝑃𝑄𝑇. Here 𝑃 𝑎𝑛𝑑 𝑄 are the basis and coefficient matrices for 𝑆. The problem in (4) can be reformulated as:
(𝑃𝑄𝑇)𝑘= arg 𝑚𝑖𝑛
𝑃,𝑄{‖𝐷𝑘− 𝑃𝑄𝑇‖𝐹 2
+𝛬𝑝‖𝑃‖22+𝛬𝑞‖𝑄‖22} (8) In the maximum likelihood estimation (MLE) formulation, the problem in (8) can be expressed as:
𝑑𝑖𝑗= (𝑝𝑖)𝑇 𝑞𝑗+ 𝑒𝑖𝑗 (9) where 𝑝𝑖, 𝑞𝑗∈ 𝑅𝑟 represent the 𝑖𝑡ℎ 𝑎𝑛𝑑 𝑗𝑡ℎ row vectors of 𝑃 𝑎𝑛𝑑 𝑄 respectively and 𝑒𝑖𝑗 is the noise component residing in 𝑑𝑖𝑗. In the literature, it is generally assumed the noise has a Gaussian/Laplacian distribution, but in real scenarios, this assumption is not always true [41], [42]. Idea of tensor MoG based low rank sparse decomposition is to provide a MoG noise distribution for each slice 𝑘 in the thermal tensor data. Here, the tensor we have has a three-way structure. For each slice of tensor data 𝑑𝑘, the MoG parameters include 𝛱𝑘= {𝜋𝑗𝑘}𝑗=1 𝐽 , 𝛴𝑘= {𝛿 𝑗𝑘 2 }𝑗=1𝐽 𝑎𝑛𝑑 {𝑁𝑗𝑘}𝑗=1 𝐽
. So from the MAP theory, the probabilistic model for the Tensor MoG can be given as:
𝑑𝑖𝑘~ ∏ 𝒩(𝑑 𝑖 𝑘|(𝑝 𝑖)𝑇𝑞, 𝛿𝑗2 )𝑧𝑖𝑗 𝑘 𝐽 𝑗=1 , 𝑧𝑖𝑘~𝑀(𝑧𝑖𝑘|𝛱) (10)
where 𝑑𝑖𝑘 is the 𝑖𝑡ℎ pixel of the 𝑑𝑘 and 𝑀 denoted the multinomial distribution. These natural conjugate priors have Inverse-Gamma and Dirichlet distribution as:
𝛿𝑗2~Inv − Gamma (𝛿𝑗2| 𝑁𝑗𝑘−1 2 − 1, 𝑁𝑗𝑘−1𝛿𝑗𝑘−12 2 ), (11) 𝛱~Dir(𝛱|𝑎), 𝑎 = (𝑁𝑘−1𝜋 1𝑘−1+ 1, ⋯ , 𝑁𝑘−1𝜋𝑘𝑘−1) (12) where 𝑁𝑘−1= ∑ 𝑁 𝑗𝑘−1 𝐽 𝑗=1 , 𝜋𝑗𝑘−1= 𝑁𝑗𝑘−1/𝑁𝑘−1 . It can be observed that the maximum of the above conjugate priors are 𝛴𝑘−1 𝑎𝑛𝑑 𝛱𝑘−1. This enforces the fact that the priors encode the previous learned noise knowledge. The subspace 𝑃, can be modeled to have a Gaussian distribution which can be given as
:
𝑃
𝑖~ 𝒩 (𝑃
𝑖|𝑃
𝑖𝑘−1,
1 𝜌𝐴
𝑖𝑘−1
)
(13)
where 1 𝜌𝐴𝑖
𝑘−1 is the positive semi-definite matrix. Here, the hyper parameters are denoted by 𝛩𝑘−1 and the marginalized latent variable is denoted by 𝑧𝑘 then the posterior distribution of (𝛱, 𝛴, 𝑞, 𝑃) can be given as:
𝑝(𝛱, 𝛴, 𝑞, 𝑃|𝑑𝑘, 𝛩𝑘−1) ∝
𝑝(𝑑𝑘|𝛱, 𝛴, 𝑞, 𝑃)𝑝(𝛴|𝛩𝑘−1)𝑝(𝛱|𝛩𝑘−1)𝑝(𝑃|𝛩𝑘−1)𝑝(𝑞) (14) Further, the minimization problem for(𝛱𝑘, 𝛴𝑘, 𝑞𝑘, 𝑃𝑘) can be given as follows: 𝐿𝑘(𝛱, 𝛴, 𝑞, 𝑃) = − 𝑙𝑛 𝑝(𝑑𝑘|𝛱, 𝛴, 𝑞, 𝑃) + ℜ 𝐹 𝑘(𝛱, 𝛴) + ℜ 𝐵 𝑘(𝑃) (15) where 𝑙𝑛 𝑝(𝑑𝑘|𝛱, 𝛴, 𝑞, 𝑃) = ∑ 𝑙𝑛(∑ 𝜋 𝑘𝒩(𝑑𝑖𝑘|(𝑝𝑖)𝑇𝑞, 𝛿𝑗2) 𝐽 𝑗=1 ) 𝑖 (16) ℜ𝐹𝑘(𝛱, 𝛴) = ∑ 𝒩𝑗𝑘−1( 1 2 𝛿𝑘 𝛿𝑗2 + 𝑙𝑛 𝛿𝑗) − 𝐽 𝑗=1 𝒩𝑘−1∑𝐽𝑗=1𝜋𝑗𝑘−1𝑙𝑛 𝜋𝑗 (17) ℜ𝐵𝑘(𝑃) = 𝜌 ∑ (𝑝𝑖− 𝑝𝑖𝑘−1)(𝐴𝑘−1𝑖 ) −1 𝑙 𝑖=1 (𝑝𝑖− 𝑝𝑖𝑘−1) (18) In above, the first term represents the likelihood term to enforce the learned parameters to adapt to the current slice of the tensor data 𝑑𝑘. The second term is the regularization parameter for the noise term. It helps the current slice with the knowledge from the previous slice to help rectify the noise more efficiently. In the same manner, the last term uses the knowledge from the previous data 𝑃𝑘−1 to help correctly learn the subspace 𝑃 . It actually corresponds to the aahalanobis distance between the 𝑃𝑘 and 𝑃𝑘−1 . The parameters 𝑁𝑘−1 and 𝜌 controls the strength of the priors. The Ea algorithm is used to solve the problem of (14). For each slice of 𝑑𝑘 tensor the E-step and a-step are applied in an alternating manner:
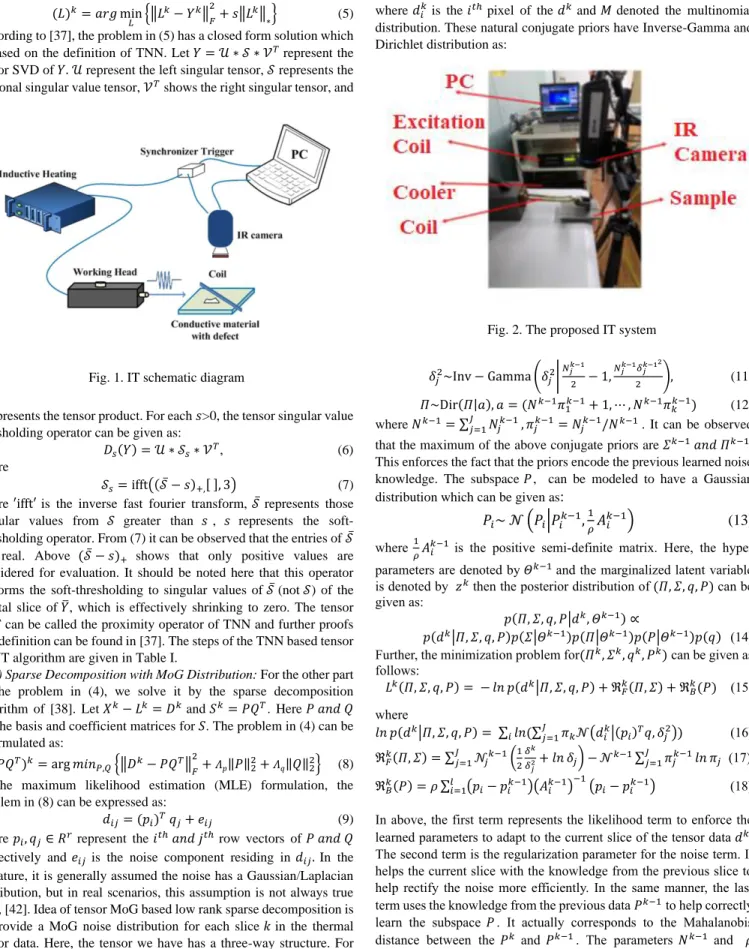
Fig. 1. IT schematic diagram
E-Step: This step calculates the expectation value of the latent variable 𝑧𝑖𝑗𝑘 which is also termed as responsibility parameter 𝛾𝑖𝑗𝑘. The equation for E-step can be formulated as:
𝐸(𝑧𝑖𝑗𝑘) = 𝛾𝑖𝑗𝑘=
𝜋𝑗𝒩(𝑑𝑖𝑘|(𝑝𝑖)𝑇𝑞𝑗, 𝛿𝑗2) ∑𝐽𝑗=1𝜋𝑗𝒩(𝑑𝑖𝑘|(𝑝𝑖)𝑇𝑞𝑗, 𝛿𝑗2)
(19)
M-Step: In this step the MoG parameters 𝛱, 𝛴 are updated. The
parameters are updated by solving the following problem:
𝐿′𝑘(𝛱, 𝛴) = −𝐸
𝑧𝑘𝑙𝑛 𝑝(𝑑𝑘, 𝑧𝑘|𝛱, 𝛴, 𝑞, 𝑃) + ℜ𝐹𝑘(𝛱, 𝛴) (20)
The closed form solution is: 𝜋𝑗= 𝜋𝑗𝑘−1− 𝒩` 𝒩(𝜋𝑗 𝑘−1− 𝜋` 𝑗);𝛿𝑗2= 𝛿𝑗𝑘−1 2 −𝒩` 𝒩(𝛿𝑗 𝑘−12 − 𝛿`𝑗2)(21) 𝒩` = 𝑙; 𝒩`𝑘= ∑ 𝛾𝑙𝑖 𝑖𝑗𝑘; 𝜋`𝑗= 𝒩`𝑗 𝒩`; 𝛿`𝑗2= 1 𝒩`𝑗∑ 𝛾𝑖𝑗 𝑘(𝑑 𝑖𝑘− (𝑝𝑖)𝑇𝑞) 2 𝑙 𝑖 𝒩 = 𝒩 𝑘−1+ 𝒩` ; 𝒩𝑗= 𝒩𝑗𝑘−1+ 𝒩`𝑗 (22) For the coefficient term 𝑞, the following sub-problem of (14) is solved:
𝑚𝑖𝑛𝑞‖𝑤𝑘∙ (𝑑𝑘− 𝑃𝑞)‖𝐹 2
(23) This problem falls in the category of the weighted least square problem whose closed form solution is:
𝑞 = (𝑝𝑇𝑑𝑖𝑎𝑔(𝑤𝑘)2𝑝)−1𝑝𝑇𝑑𝑖𝑎𝑔(𝑤𝑘)2𝑑𝑘 (24) For the term 𝑃, we solve the following sub-problem of (14) given as:
𝐿′𝑘(𝑃) = −𝐸 𝑧𝑝𝑙𝑛 𝑝(𝑑𝑘, 𝑧𝑡|𝛱, 𝛴, 𝑞, 𝑃) + ℜ𝐵𝑘(𝑃) = ‖𝑤𝑘∙ (𝑑𝑘− 𝑃𝑞𝑘)‖ 𝐹 2 + ℜ𝐵𝑘(𝑃) (25) The closed form solution for this problem can be given as:
𝑝𝑖𝑘= (𝜌(𝐴𝑖𝑘−1) −1 + (𝑤𝑖𝑘) 2 𝑞𝑘(𝑞𝑘)𝑇)(𝜌(𝐴 𝑖 𝑘−1)−1𝑝 𝑖𝑘−1 +(𝑤𝑖𝑘) 2 𝑑𝑖𝑘(𝑞𝑘)𝑇) (26) Finally, the updating rule is set as:
(𝐴𝑖𝑘) −1 = 𝜌(𝐴𝑖𝑘−1) −1 + (𝑤𝑖𝑘) 2 𝑞(𝑞𝑘)𝑇; 𝑏𝑖𝑘= (𝜌(𝐴 𝑖 𝑘−1)−1𝑝 𝑖𝑘−1+ (𝑤𝑖𝑘) 2 𝑑𝑖𝑘(𝑞𝑘)𝑇) (27) We have 𝑝𝑖𝑘= 𝐴𝑘𝑖𝑏𝑖𝑘. In order to save the computation time and avoid the matrix inverse in the above equation, the update rule is given as following the matrix inverse equations:
𝐴𝑖𝑘= 1 𝜌(𝐴𝑖 𝑘−1−(𝑊𝑖𝑘) 2 𝐴𝑖𝑘−1𝑞𝑘(𝑞𝑘)𝑇𝐴𝑖𝑘−1 𝜌+(𝑤𝑖𝑘) 2 (𝑞𝑘)𝑇𝐴 𝑖 𝑘−1𝑞𝑘); 𝑏𝑖𝑘= 𝜌𝑏𝑖𝑘−1+ (𝑤𝑖𝑘)2𝑑𝑖𝑘𝑞𝑘 (28) It is worth noting that for updating the 𝑃𝑘 in each step, only (𝐴
𝑖 𝑘−1)
𝑖=1 𝑙 and (𝑏𝑖𝑘−1)𝑖=1𝑙 are evaluated. By doing so, only a fixed amount of memory can be used. Further, from (28), it can be seen that matrix inverse is not used in the updating equations and hence the efficiency of the algorithm gets better. The steps of the proposed algorithm are given in Table II and the flowchart of consecutive steps is shown in Fig. 3.
III. EXPERIMENTAL SETUP A. Experiment set-up and specimen details
The schematic diagram of IT is given in Fig. 1. High-Frequency pulse current is used as the excitation signal which is generated by an induction heating element for a few milliseconds. This continuing current travels to the transmitting coil which is placed above the conducting material. This coil will induce the eddy currents which in turn will generate the resistive heating effect in the conductive material under test. Thermal diffusion phenomenon occurs in the conductive material allowing the heat to flow from the high-temperature area to low temperature area and decays slowly in the material to reach a thermal balance. In this process, if defects are present in the conductive material they will produce disturbances in the thermal diffusion. Consequently, those disturbances in the surface heat distribution represented as the transient temperature time spatial response will be captured by the infrared camera for further analysis.
Fig. 1 shows the basic schematic diagram for the ECPT of IT detection system using the reflection mode configuration. Similar experimental configuration can be found in [25]. In this configuration, the IR camera and the excitation are placed face the same direction and opposite to the specimen under test. In our experimental study, we have used this configuration. More information about different excitation Table. II Low-rank tensor with sparse aoG (LRTSaoG)
Algorithm
Input: the aoG parameters: {𝛱𝑘−1, 𝛴𝑘−1, 𝛮𝑘−1}, model variables : [{𝐴𝑘−1𝑖 }𝑖=1𝑙 ], [{𝑏𝑘−1𝑖 }𝑖=1𝑙 ], [𝑃𝑘−1], tensordata, 𝜖 = 1𝑒 − 6.
Initialization: {𝛱, 𝛴 } = {𝛱𝑘−1, 𝛴𝑘−1} , 𝑞𝑘. 1. While not converged do:
2. Given the data and initializations of sparse component; solve for low rank problem 𝐿𝑘of(3) using the t-SVT algorithm in Table. I.
3. Given the tensor and low-rank data for the sparse component problem 𝑆𝑘 of (4) solve by Ea algorithm.
4. Online E-Step: compute 𝛾𝑖𝑗𝑘 by (19)
5. Online a-Step: compute {𝛱, 𝛴,Ν} by (21) and {𝑞𝑘} by (24). 6. for each {𝑃𝑖𝑘}, 𝑖 = 1,2, . . . , 𝑙. do,
7. compute [{𝐴𝑖𝑘−1} 𝑖=1 𝑙 ], [{𝑏 𝑖𝑘−1}𝑖=1𝑙 ] by (28). 8. compute {𝑃𝑖𝑘} by𝑃𝑖𝑘= 𝐴𝑖𝑘𝑏𝑖𝑘 9. end for 10. 𝑆𝑘= 𝑃𝑘𝑞𝑘𝑇
11. Check for convergence ‖𝐿𝑘− 𝐿𝑘−1‖ ∞≤ 𝜖 ‖𝑆𝑘− 𝑆𝑘−1‖
∞≤ 𝜖 12. End while
Output: 𝐿𝑘, 𝑆𝑘
configurations can be found in [43]. In our experimental study a movable IT excitation source is used for the scanning of the specimen. As the pipeline and irregular shape specimens are quite large as well as in case of unknown defect location, the whole sample needs to be scanned. In our proposed experimental configuration, this is achieved by exciting the IT coil and slowly moving the excitation coil along with IR camera for scanning the sample. A number of repetitive experiments are performed and the best (in terms of SNR) thermal video sequences are chosen for further defect detection analysis. In the comparison results in Fig. 3, the conventional matrix decomposition based algorithm of PCA[44], TSR[45] and FFT[46] are unable to identify the defects because of motion based IT data and produce replicas of detection results. The motion-based IT data are obtained from the specimen numbers (1, 2, 9, 10, 11, 12 and 13).
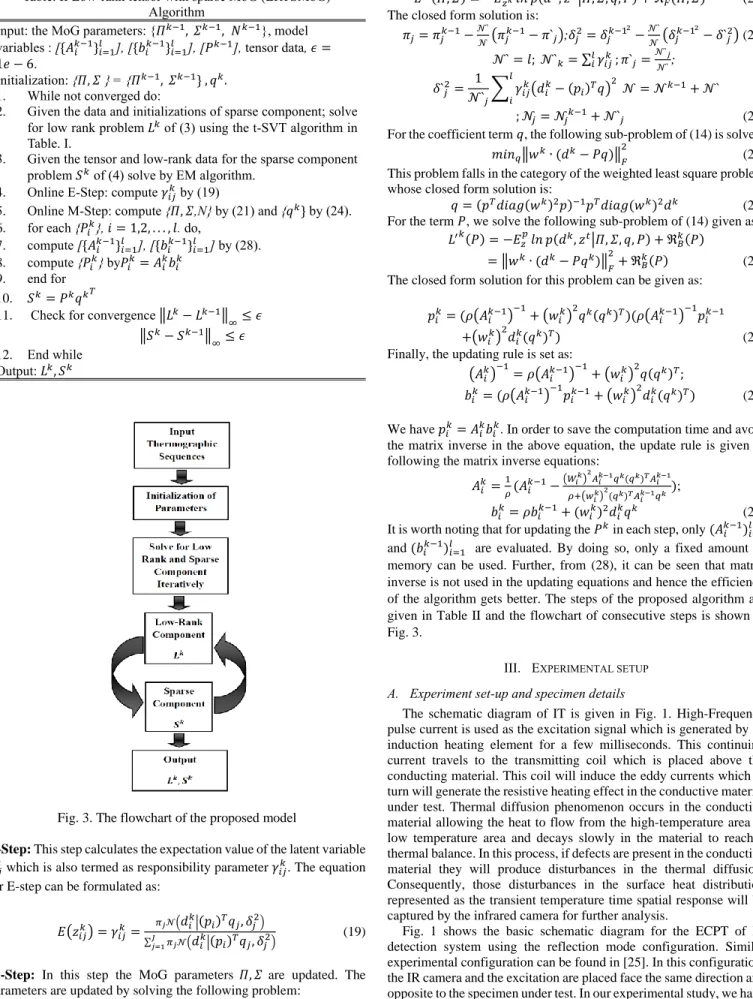
The electromagnetic thermal imaging system is shown in Fig. 2. In our experiments, the coil is used as excitation and is controlled by the excitation source. We use the IR camera (FLIR A655sc) to collect thermal video sequences. The frame rate is set to 100FPS for all the experiments. The reflection mode configuration is used in which the test sample is placed opposite to the IR camera.
In order to verify the proposed method, fourteen different samples with artificial and natural defects are tested. Most of the samples are metallic with ferromagnetic properties, while the weld-joint samples are non-ferromagnetic. All these cracks on the different specimen are irregular shaped. The information of these samples can be found in Table. III. The location of cracks is masked with red rectangle region.
Table. III Information about the sample specimen
Type Sample #1 Sample #2
Pipeline
/ /
Sample #3 Sample #4 Sample #5 Sample #6
Axle
Sample #7 Sample #8
Weld Joint
/ /
IV. EXPERIMENTS ANALYSIS
The visual results are presented along with the quantitative results based on running times and SNR [39]. To show the efficacy of the proposed algorithm the comparative analysis is presented with general IT detection algorithms and other tensor decomposition based algorithms. The algorithms in the comparison include principal component analysis (PCA) [44], thermal signal reconstruction (TSR) [45], pulse phase thermography based on fast Fourier transform (FFT)[46], OSTD[33], and IRTPCA[34].The red rectangles are drawn manually to highlight the position of the defects for analyzing comparative defects detection results. These can be considered as the ground truth for validation. All the experiments are carried out in a corei7 computer with Windows-10 operating system having 8GB RAM. MATLAB2017b software is utilized for all the algorithms evaluation. The comparative results for all specimen are summarized in Table. IV.
The visual results are presented in Fig. 4 in a tabular form. Fig. 4 shows the intensity results from the thermographic data. The thermographic data are converted in the intensity data using the MATLAB (mat2gray) command. The specimen 1 is an irregular shape pipeline with a natural surface defect. Here, the thermographic data is motion based data. From the results it can be seen that replicas of results are generated by the general IT detection based algorithms of PCA, TSR and FFT and the defect information is not very clear. The results from IRTPCA and the proposed algorithm are quite clear for this specimen. The specimen 3 shows the results of defects on an Axle. Here, the defects are surface and natural with irregular shape and length. The general IT detection methods of PCA, TSR and FFT show reasonably good contrast. However, they encounter more false detection results and are unable to detect the defects completely. The IRTPCA performs well for the specimen 3 but for other specimen the results becomes worse due to the strong noise. The proposed algorithm is able to detect the defect more clearly and with better resolution and contrast.
The specimen 7 is the weld type with irregular shape natural defects. Here, the general IT detection algorithm perform well in partially detecting the defect information. The OSTD algorithm is unable to detect defect for specimen 7 and has strong noise and poor resolution. The IRTPCA algorithm has good detection results for specimen 7. The
proposed algorithm given better results with reduction in noise and increase in SNR.
The specimen 10 is an irregular shape specimen with natural defects. Here, the IT thermographic data is the motion based data. From the results of specimen 10 it can be seen that the PCA, TSR and FFT are unable to detect defects and produce false defects along with original defects in terms of replicas due to the motion of IR excitation source and camera. The OSTD and IRTPCA produce reasonable and good results with better SNR. The proposed algorithm gives results with good SNR and resolution.
The specimen 12 is the metallic sample with artificial defects. For specimen 12 the motion based IT experiments are performed. From the results it can be observed that PCA, TSR and FFT algorithm are unable to detect defects clearly. The OSTD and IRTPCA give reasonably better results and are able to detect defects. The proposed algorithm given better defect detection results in terms of resolution and contrast. The complete visual comparison results are given in the supplement file for all the specimen and only one result from each specimen type is presented here.
The quantitative comparison based on SNR and computation time are given in Table. IV. The last row gives the average SNR for all the algorithms along with the average running time in seconds. On average, the PCA [44] algorithm has an SNR of 2.0875 with 59.91 seconds in average running time. For the TSR [45] algorithm, the average SNR is 2.6755 with the average running time of 414.27. For the FFT [46] algorithm, the SNR average is 3.4018 with the computation time average of 110.74. The average SNR for the OSTD [33] algorithm is 2.4141 with the average running time of 1271.25 seconds. The IRTPCA [34] algorithm has a running time of 412.07 seconds with a reasonable SNR of 3.3077. The proposed algorithm gives on average the highest SNR of 7.5195. The proposed algorithm takes around on average 90.97 seconds to be the second-fastest algorithm to the PCA. By optimizing the low rank and sparse data in a tensor model with MoG noise distribution, it can remove the noise and improve the resolution. The proposed algorithm shows better defect detection ability in the inductive thermography based natural crack detection task. The precision and recall based F-score has been evaluated for each algorithm and the results are shown in Table V. The details of F-score can be found in [30]. Looking at the results for specimen type (Axle and Weld Joint), it can be observed from the
Irregular Shape
/
Sample #12 Sample #13 Sample#14
Artificial Crack
comparison that the proposed algorithm has better defect detection accuracy in terms of F-score.
The proposed algorithm utilizes the improved tensor nuclear norm for low-rank analysis along with MoG decomposition for the sparse analysis. The tensor-based algorithms generally suffer from high computational cost due to the multiple-array and multi-factor data. These algorithms generally consider noise with Gaussian distribution. The proposed improved tensor nuclear norm based t-SVT considers the singular values of the frontal slice only in the computation of SVD instead of the whole 3-way data and only half of the singular values are considered for SVD based low-rank tensor estimation which saves
significant computation time with minimal loss of information. Since noise in the thermal data is not necessarily consistent with Gaussian distribution, the conjunction of using the MoG with the tensor decomposition paves the way for better modeling the noise where it is assumed to have a more complex distribution and can be estimated by using a Mixture of Gaussian (MoG) distribution. Thus, it has the capability to extract weak defect information given by low-intensity image pixels embedded in non-Gaussian noise. Thus the use of tensor framework allows the unique properties of tensors for analyzing multivariate data and it is more suitable for long and continuous thermal sequences.
Fig. 4. Comparison analysis for different sample Top Row (Left to Right) OSTD[33], IRTPCA[34], LRTSMoG and Bottom Row (Left to Right) PCA[44], TSR[45]and FFT [46]algorithms
1
3
10
12
Table. IV. Comparison results average SNR (Top) and average time taken (Bottom)
Specimen Type
PCA[44] TSR[45] FFT[46] OSTD[33] IRTPCA[34] LRTSMoG
Pipeline 1.4412 0.3130 3.2616 0.6171 3.3824 4.5846
Axle 1.6111 3.6814 3.2972 3.2119 -0.1589 7.1895 40.79 324.73 58.62 714.27 106.46 40.95 Weld 4.4648 4.1600 2.7747 2.6052 3.5923 8.0774 Joint 12.24 195.66 38.61 260.71 36.92 17.84 Irregular 2.6001 4.9892 6.0266 3.6731 10.9807 14.3127 Shape 67.51 457.38 128.28 1482.95 939.96 120.03 Artificial 1.0564 -0.3937 1.4284 1.1623 0.0173 2.7512 Crack 93.59 664.05 215.60 1074.87 424.76 114.64 Average 2.0875 2.6755 3.4018 2.4141 3.3077 7.5195 59.91 414.27 110.74 1271.25 412.01 90.97
Table. V. Comparative results based on average F-score with average Precision and average Recall
Specimen Type
PCA[44] TSR[45] FFT[46] OSTD[33] IRTPCA[34] LRTSMoG
Pipeline Precision(%) 49.99 49.99 49.99 100 100 100 Recall(%) 75 75 75 100 100 100 F-score(%) 60 60 60 100 100 100 Axle Precision(%) 67.08 64.58 75 75 62.50 91.66 Recall(%) 83.33 66.66 58.33 66.66 33.33 91.66 F-score(%) 73.51 64.76 65 70 33.92 91.66 Weld Precision(%) 87.50 63.33 66.66 50 25 87.50 Joint Recall(%) 100 100 66.66 33 50 100 F-score(%) 92.85 77.5 66.66 50 33.33 92.85 Irregular Precision(%) 50 66.66 83.33 100 100 100 Shape Recall(%) 100 100 100 100 100 100 F-score(%) 66.66 77.77 88.88 100 100 100 Artificial Precision(%) 83.33 70 53.33 55.55 56.66 84.72 Crack Recall(%) 64.28 64.28 73.80 61.90 50 100 F-score(%) 61.10 61.10 71.99 57.43 49.67 91.11 V. CONCLUSION
In this paper, a joint low-rank sparse MoG based tensor decomposition algorithm is proposed. The algorithm is evaluated for natural crack defects on a variety of specimen with irregular shape using inductive thermography. By optimizing the low rank and sparse data in the tri-decomposition framework assuming the noise follows a MoG distribution has boosted the computational speed, resulted in higher accuracy in estimating the complex noise and detecting weaker information defects hidden in the background. The quantitative results based on SNR and visual results have shown that the proposed model performs well in modelling complex noise and quantifying weaker natural crack defects present on the irregular shape specimen. The comparative analysis with tensor based decomposition algorithms proves the efficacy of the proposed model.
VI. REFERENCES
[1] H. Kasban, O. Zahran, H. Arafa, M. El-Kordy, S. M. S. Elaraby, and F. E. Abd El-Samie, “Welding defect detection
from radiography images with a cepstral approach,” NDT E Int., vol. 44, no. 2, pp. 226–231, 2011.
[2] W.-C. Li and D.-a. Tsai, “Wavelet-based defect detection in solar wafer images with inhomogeneous texture,” Pattern
Recognit., vol. 45, no. 2, pp. 742–756, 2012.
[3] S. Ghorai, A. Mukherjee, M. Gangadaran, and P. K. Dutta, “Automatic Defect Detection on Hot-Rolled Flat Steel Products,” IEEE Trans. Instrum. Meas., vol. 62, no. 3, pp. 612–621, 2013.
[4] D. Tsai and J. Luo, “aean Shift-Based Defect Detection in aulticrystalline Solar Wafer Surfaces,” IEEE Trans. Ind.
Informatics, vol. 7, no. 1, pp. 125–135, 2011.
[5] P. Broberg, “Surface crack detection in welds using thermography,” NDT E Int., vol. 57, pp. 69–73, 2013. [6] R. Yang, Y. He, B. Gao, and G. Y. Tian, “Inductive pulsed
phase thermography for reducing or enlarging the effect of surface emissivity variation,” Appl. Phys. Lett., vol. 105, no. 18, p. 184103, Nov. 2014.
[7] B. Gao, A. Yin, G. Tian, and W. L. Woo, “Thermography spatial-transient-stage mathematical tensor construction and material property variation track,” Int. J. Therm. Sci., vol.
85, pp. 112–122, 2014.
[8] L. Bai, B. Gao, G. Y. Tian, W. L. Woo, and Y. Cheng, “Spatial and Time Patterns Extraction of Eddy Current Pulsed Thermography Using Blind Source Separation,”
IEEE Sens. J., vol. 13, no. 6, pp. 2094–2101, 2013.
[9] B. Gao, L. Bai, W. L. Woo, G. Y. Tian, and Y. Cheng, “Automatic defect identification of eddy current pulsed thermography using single channel blind source separation,”
IEEE Trans. Instrum. Meas., vol. 63, no. 4, pp. 913–922,
2014.
[10] L. Cheng, B. Gao, G. Y. Tian, W. L. Woo, and G. Berthiau, “Impact Damage Detection and Identification Using Eddy Current Pulsed Thermography Through Integration of PCA and ICA,” IEEE Sens. J., vol. 14, no. 5, pp. 1655–1663, 2014.
[11] M. Genest, D. C. Dudzinski, L. Dawag, and R. K. Kersey, “Crack detection using induction thermography during high-temperature testing,” in Proc.SPIE, 2013, vol. 8705, pp. 1-6. [12] P. Jäckel and U. Netzelmann, “The influence of external
magnetic fields on crack contrast in magnetic steel detected by induction thermography,” Quant. Infrared Thermogr. J., vol. 10, no. 2, pp. 237–247, 2013.
[13] G. Y. Tian, Y. Gao, K. Li, Y. Wang, B. Gao, and Y. He, “Eddy Current Pulsed Thermography with Different Excitation Configurations for Metallic Material and Defect Characterization,” Sensors (Basel)., vol. 16, no. 6, p. 843, Jun. 2016.
[14] B. Weekes, D. P. Almond, P. Cawley, and T. Barden, “Eddy-current induced thermography—probability of detection study of small fatigue cracks in steel, titanium and nickel-based superalloy,” NDT E Int., vol. 49, pp. 47–56, 2012.
[15] Y. He, G. Tian, a. Pan, and D. Chen, “Impact evaluation in carbon fiber reinforced plastic (CFRP) laminates using eddy current pulsed thermography,” Compos. Struct., vol. 109, pp. 1–7, 2014.
[16] Y. He, G. Y. Tian, a. Pan, D. Chen, and H. Zhang, “An investigation into eddy current pulsed thermography for detection of corrosion blister,” Corrosion Science, vol. 78. pp. 1–6, 2014.
[17] J. Wu et al., “aotion-induced eddy current thermography
for high-speed inspection,” AIP Adv., vol. 7, no. 8, pp. 85-105, 2017.
[18] Y. He, R. Yang, X. Wu, and S. Huang, “Dynamic scanning electromagnetic infrared thermographic analysis based on blind source separation for industrial metallic damage evaluation,” IEEE Trans. Ind. Informatics, vol. 14, no. 12, pp. 5610–5619, 2018.
[19] B. Oswald-Tranta and a. Sorger, “Scanning pulse phase thermography with line heating,” Quant. Infrared Thermogr. J., vol. 9, no. 2, pp. 103–122, 2012.
[20] F. Khodayar, F. Lopez, C. Ibarra-Castanedo, and X. aaldague, “Optimization of the inspection of large composite materials using robotized line scan
thermography,” J. Nondestruct. Eval., vol. 36, no. 2, p. 32, 2017.
[21] Z. He et al., “Joint Scanning Laser Thermography Defect Detection aethod for Carbon Fiber Reinforced Polymer,”
IEEE Sens. J., vol. 20, no. 1, p. 328-336, 2020.
[22] J. Zhu, Q. ain, J. Wu, and G. Y. Tian, “Probability of Detection for Eddy Current Pulsed Thermography of Angular Defect Quantification,” IEEE Trans. Ind.
Informatics, vol. 14, no. 12, pp. 5658–5666, 2018.
[23] P. Zhu, Y. Cheng, L. Bai, and L. Tian, “Local Sparseness and Image Fusion for Defect Inspection in Eddy Current Pulsed Thermography,” IEEE Sens. J., vol. 19, no. 4, pp.
1471–1477, 2019.
[24] B. Gao, X. Li, W. L. Woo, and G. y. Tian, “Physics-Based Image Segmentation Using First Order Statistical Properties and Genetic Algorithm for Inductive Thermography Imaging,” IEEE Trans. Image Process., vol. 27, no. 5, pp. 2160–2175, 2018.
[25] J. Zhu, G. Tian, Q. ain, and J. Wu, “Comparison Study of Different Features for Pocket Length Quantification of Angular Defects Using Eddy Current Pulsed
Thermography,” IEEE Trans. Instrum. Meas., vol. 68, no. 5, pp. 1373–1381, 2019.
[26] B. Gao, W. L. Woo, and S. S. Dlay, “Variational
Regularized 2-D Nonnegative aatrix Factorization,” IEEE
Trans. Neural Networks Learn. Syst., vol. 23, no. 5, pp. 703–
716, 2012.
[27] X. Li, B. Gao, W. L. Woo, G. Y. Tian, X. Qiu, and L. Gu, “Quantitative Surface Crack Evaluation Based on Eddy Current Pulsed Thermography,” IEEE Sens. J., vol. 17, no. 2, pp. 412–421, 2017.
[28] B. Gao, P. Lu, W. L. Woo, and G. Y. Tian, “Variational Bayes Sub-Group Adaptive Sparse Component Extraction for Diagnostic Imaging System,” in ICASSP, IEEE International Conference on Acoustics, Speech and Signal
Processing - Proceedings, 2018, vol. 2018-April, no. 10, pp.
1518–1522.
[29] X. Xiao, B. Gao, W. L. Woo, G. Y. Tian, and X. T. Xiao, “Spatial-time-state fusion algorithm for defect detection through eddy current pulsed thermography,” Infrared Phys.
Technol., vol. 90, pp. 133–145, 2018.
[30] Y. Wang et al., “Thermal Pattern Contrast Diagnostic of
Microcracks With Induction Thermography for Aircraft Braking Components,” IEEE Trans. Ind. Informatics, vol. 14, no. 12, pp. 5563–5574, 2018.
[31] Q. Xie, Q. Zhao, D. aeng, and Z. Xu, “Kronecker-Basis-Representation Based Tensor Sparsity and Its Applications to Tensor Recovery,” IEEE Trans. Pattern Anal. Mach.
Intell., vol. 40, no. 8, pp. 1888–1902, 2018.
[32] T. G. Kolda and B. W. Bader, “Tensor Decompositions and Applications,” SIAM Rev., vol. 51, no. 3, pp. 455–500, 2009. [33] A. Sobral, S. Javed, S. K. Jung, T. Bouwmans, and E. H.
Zahzah, “Online Stochastic Tensor Decomposition for Background Subtraction in aultispectral Video Sequences,”
in Proceedings of the IEEE International Conference on
Computer Vision, 2015, pp. 946–953.
[34] Y. Liu, L. Chen, and C. Zhu, “Improved Robust Tensor Principal Component Analysis via Low-Rank Core aatrix,”
IEEE J. Sel. Top. Signal Process., vol. 12, no. 6, pp. 1378–
1389, 2018.
[35] J. Ahmed, B. Gao, G. Y. Tian, Y. Yang, and Y. C. Fan, “Sparse ensemble matrix factorization for debond detection in CFRP composites using optical thermography,” Infrared
Phys. Technol., vol. 92, pp. 392–401, 2018.
[36] J. Ahmed, B. Gao, and W. L. Woo, “Wavelet Integrated Alternating Sparse Dictionary Matrix Decomposition in Thermal Imaging CFRP Defect Detection,” IEEE Trans.
Ind. Informatics, vol. 15, no. 7, pp. 4033–4043, 2019.
[37] C. Lu, J. Feng, W. Liu, Z. Lin, and S. Yan, “Tensor robust principal component analysis with a new tensor nuclear norm,” IEEE Trans. Pattern Anal. Mach. Intell., vol. 42, no. 4, pp. 925–938, 2020.
[38] H. Yong, D. aeng, W. Zuo, and L. Zhang, “Robust Online aatrix Factorization for Dynamic Background Subtraction,”
IEEE Trans. Pattern Anal. Mach. Intell., vol. 40, no. 7, pp.
1726–1740, 2018.
[39] J. Zhao, B. Gao, W. L. Woo, F. Qiu, and G. Y. Tian, “Crack evaluation based on novel circle-ferrite induction
thermography,” IEEE Sens. J., vol. 17, no. 17, pp. 5637– 5645, 2017.
[40] Z. Zhou, X. Li, J. Wright, E. Candès, and Y. aa, “Stable principal component pursuit,” in IEEE International
Symposium on Information Theory - Proceedings, 2010, pp.
1518–1522.
[41] D. Meng and F. D. La Torre, “Robust matrix factorization with unknown noise,” in Proceedings of the IEEE
International Conference on Computer Vision, 2013, pp.
1337–1344.
[42] X. Cao, Q. Zhao, D. aeng, Y. Chen, and Z. Xu, “Robust low-rank matrix factorization under general mixture noise distributions,” IEEE Trans. Image Process., vol. 25, no. 10, pp. 4677–4690, 2016.
[43] R. Yang and Y. He, “Optically and non-optically excited thermography for composites: A review,” Infrared Phys.
Technol., vol. 75, pp. 26–50, 2016.
[44] N. Rajic, “Principal component thermography for flaw contrast enhancement and flaw depth characterisation in composite structures,” Compos. Struct., vol. 58, no. 4, pp. 521–528, 2002.
[45] S. a. Shepard and a. Frendberg Beemer, “Advances in thermographic signal reconstruction,” in Proc. SPIE 9485,
Thermosense: Thermal Infrared Applications XXXVII, 2015,
vol. 9485, pp. 1–7.
[46] C. Ibarra-Castanedo and X. aaldague, “Pulsed phase thermography reviewed,” Quant. Infrared Thermogr. J., vol. 1, no. 1, pp. 47–70, 2004.
Junaid Ahmed received his B.E. degree in
Telecommunications Engineering from aehran University of Engineering and Technology, Jamshoro, Pakistan (2006-2010), and a.S. degree in Electrical and Electronics Engineering from Eastern aediterranean University (EaU), North Cyprus, Turkey (2014-2015). He is working as Assistant Professor at Sukkur IBA University, Pakistan. He is currently pursuing his Ph.D. degree in Non-Destructive Testing and Structural Health aonitoring using infrared thermography at UESTC, Chengdu, China. His current research interests include wavelet processing; debond damage in CFRP, quantitative non-destructive testing and evaluation, sparse representations and low rank matrix/tensor factorization.
Bin Gao (a’ 12-Sa’ 14) received his B.Sc.
degree in communications and signal processing from Southwest Jiao Tong University (2001-2005), China, aSc degree in communications and signal processing with Distinction (2006-2007) and PhD degree from Newcastle University, UK (2007-2011). He worked as a Research Associate (2011-2013) with the same university on wearable acoustic sensor technology. Currently, he is a Professor with the School of Automation Engineering, University of Electronic Science and Technology of China (UESTC), China. His research interests include sensor signal processing, machine learning, social signal processing, nondestructive testing and evaluation where he actively publishes in these areas. He has published over 60 papers on these topics on various journals and international conference proceedings. He has coordinated several research projects from National Natural Science Foundation of China.
Wai Lok Woo (a’11–Sa’12) received the
B.Eng. degree in electrical and electronics engineering, and the M.Sc. and Ph.D. degrees in statistical machine learning from Newcastle University, U.K., in 1993, 1995, and 1998, respectively. He was the Director of research for the Newcastle Research and Innovation Institute, and the Director of operations for Newcastle University. He is currently a Professor of Machine Learning with Northumbria University, U.K. He has published more than 400 papers on these topics on various journals and international conference proceedings. His research interests include the mathematical theory and algorithms for data science and analytics, artificial intelligence, machine learning, data mining, latent component analysis, multidimensional signal, and image processing. He is a Member of the Institution Engineering Technology. He was a recipient of the IEE Prize and the British Commonwealth Scholarship. He serves as an Associate Editor to several international signal processing journals, including IET Signal Processing, the Journal of Computers, and the Journal of Electrical and Computer Engineering.
![Fig. 4. Comparison analysis for different sample Top Row (Left to Right) OSTD[33], IRTPCA[34], LRTSMoG and Bottom Row (Left to Right) PCA[44], TSR[45]and FFT [46]algorithms](https://thumb-us.123doks.com/thumbv2/123dok_us/793689.2600345/9.918.163.758.300.1086/comparison-analysis-different-sample-right-irtpca-lrtsmog-algorithms.webp)