Remote-sensing the urban area: Automatic building extraction based
on multiresolution segmentation and classification
Neeti Shrivastava1, Praveen Kumar Rai2
1Indian Institute of Remote Sensing, Dehradun, Uttrakhand, India, 2Department of Geography, Banaras Hindu University, Varanasi-221005, Uttar Pradesh, India
Correspondence: Neeti Shrivastava (email: [email protected])
Abstract
Multiresolution segmentation is a new procedure for image object extraction. It allows the segmentation of an image into a network of homogeneous image regions at any chosen resolution. These image objects represent image information in an abstracted form and serve as building blocks for subsequent classifications. An exercise was undertaken to perform and study an object oriented segmentation and classification using high resolution satellite data (Cartosat-1 fused with IRS-1C, LISS IV data) for automatic building extraction in India. The study area covered the administrative area of BHEL (Bharat Heavy Electrical Limited) colony of Haridwar, Uttrakhand ( 29°56'55.51"N to 29°56'11.49"N latitude and 78°05'42.45"E to 78°07'00.9"E longitude). Two approaches were used for feature extraction, namely, applying different spatial filers, and object- oriented fuzzy classification. The merged image was filtered using the different high pass filters like Kirsch, Laplace, Prewitt, Sobel, Canny filtered images. The results showed that the overall accuracy of classified image was 0.93 and the Kappa accuracy was 0.89. The producer accuracy for building, vegetation and shadow were 0.9545, 1.0 and 0.8888 respectively whereas user accuracy for building, vegetation and shadow are 1.0, 0.9375 and 1.0 respectively. The overall classification accuracy based on TTA mask (training and test area mask) was 0.97 while the Kappa accuracy was 0.95. The producer accuracy for building, forest and shadow were 1.0, 1.0 and 0.7144 respectively and the user accuracy for building, vegetation and shadow were 1.0, 0.9375 and 1.0 respectively.
Keywords: automatic building extraction, high resolution data, multiresolution segmentation, object-oriented fuzzy classification, remote sensing, spatial filter
Introduction
Land use in urban areas changes continuously mainly due to the construction of new buildings, roads and other man-made objects. The map content should therefore be regularly updated with the changes. The building region is one of the important land types in land cover classification. The extracted buildings are useful for disaster monitoring and building reconstruction, as well as other applications such as urban planning, telecommunication etc. Urban areas are rapidly changing mainly due to human activities in construction, destruction or extension of topographic elements such as building and road. These changes in urban environment enforce updating of old record, which can have planners to have accurate building zones for urban planning, maintenance and development (Pandey, 2004).
High resolution satellite images provide a valuable new data source for geographic information acquisition. Building detection from high resolution satellite images has attracted great attention in recent years. To automate the process and produce reliable, precise, and complete datasets, multiple data sources and advanced techniques should be used (Lee et al., 2003). The increasing availability of the high spatial resolution satellite images has provided a new data source for building extraction. When compared with the aerial photographs, the high resolution satellite images provide several advantages that include the
cost and the accessibility. Several recent studies have used the spectral reflectance values to detect the buildings (Shan & Lee, 2002).
Geographic data acquisition is usually very time consuming and costly (Chang, 2007). Thus, many Geographic Information System (GIS) applications suffer from the lack of current land cover use information. This problem however could be overcome by the remote sensing technology. Data acquisition by remote sensing for mapping and GIS has traditionally been characterized by the efficient and accurate manual extraction. But, manual information extraction is time consuming and requires qualified people. Therefore, speeding up this process by automatic or semiautomatic feature extraction techniques has become a necessity. The use of the combination of multiple data sources and the integration of images with the other data sources such as DSMs, existing GIS data, ground plans and a priori knowledge appears to be a new trend in building extraction.
Automatic extraction of urban buildings from high resolution satellite images has been an active research subject for a decade. Most early works used black and white aerial images as a single data source (Huertas & Nevatia, 1988; Lin & Nevatia, 1998). These methods are mainly based on edge detection, line extraction and building polygon generation. Several approaches have used the building models to facilitate and automate the building extraction procedure (Tseng & Wang, 2003). Research in feature extraction is still very diverse and object extraction is a fundamental computer vision operator. There are different methodologies for feature extraction, especially for linear features such as image fusion for feature extraction (Pigeon et al., 2001), fuzzy-based approach, mathematical morphology (Zhang, 1999), model based approach (Buckner, 1998), dynamic programming, multi-scale grouping and context (Mayer et al., 1997), and kalman filtering.
The strong motivation to develop techniques for the extraction of image objects stems from the fact that most image data exhibit characteristic texture which is neglected in common classifications, although scientists started to tackle this problem already in the 1970s (Kettig & Landgrebe, 1976; Burnett & Blaschke, 2002). Human visual perception involves a set of processes for distinguishing top-down attention from the stimulus-driven bottom up (Itti & Koch, 2001).
Most of the recent work on building extraction from high resolution satellite images is based on supervised techniques. These techniques either require a digital image processing classification method based on initial training data to provide hypotheses for the positions and sizes of the candidate building features (Lin & Nevatia, 1998; Benediktsson et al., 2003), or they use training sets or model databases to classify or match the buildings (Kim & Nevatia, 1999; Segl & Kaufmann, 2001).
The main steps in digital image processing are (a) preprocessing, which is a data preparation step for contrast enhancement, noise reduction or filtering (Chen, 1988; Gonzalez & Woods, 2002), (b) feature extraction, for retrieving non-redundant and significant information from an image. This operation is targeted at achieving time efficiency at the cost of data reduction (Pal & Pal, 1993; Lucchese & Mitra, 2001) followed by object detection, localization and recognition, which determine the position, location and orientation of objects (Foresti & Pellegrino, 2004).
The new availability of very high resolution satellite images offers a mapping potential for scales reaching from 1:5000 to 1:10,000 (Puissant et al., 2002).
The man-made objects such as buildings can be easily detected. The researches in this domain allow to expect significant results in the field of remote sensing in urban areas. However the real potentialities dealing with such high resolution image data remain relatively unknown. Problems and difficulties appear when extracting the objects with high local variance context and spectral signatures disturbances (Lhomme et al., 2004). Thus, the extraction methods should be adapted to these new images. Problems and difficulties appear when extracting the objects with high local variance context and spectral signatures disturbances (Lhomme et al., 2004). Thus, the extraction methods should be adapted to these new images.
The main objective of this paper is extraction of buildings from high resolution imagery and processing of images using edge detectors for building extraction.
Study area
The study area cover administrative area of BHEL (Bharat Heavy Electrical Limited) colony, Haridwar, Uttrakhand. BHEL is the largest engineering and manufacturing enterprise in India in the energy-related infrastructure sector, today. BHEL was established more than 40 years ago, BHEL was founded in 1950s. Its operations are organized around three business sectors: Power, Industry including Transmission, Transportation, and Telecommunication and Renewable energy. The company has been earning profits continuously since 1971-1972 and paying dividends since 1976-1977. Geographical location of the study is shown in the Figure 1.
Figure 1.Geographical location of the study area in Haridwar district, Uttrakhand (India) in satellite data
Software and data used
In this paper used the following software: Erdas Imagine (ver. 10), Definiens Developer (newversion of eCognition), ArcGIS (ver. 9.1) and MS Office.
The Cartosat-1 spacecraft is configured with the Panchromatic cameras which are mounted such that one camera is looking at +26 degree with respect to nadir and the other at -5 degree with respect to nadir along the track. These two cameras combindly provide stereoscopic image pairs in the same pass. Also the whole spacecraft is steerable across track to provide wider coverage in a shorter period. A brief description of the payload and the other mainframe elements are given in the Tables 1 & 2. Satellite data used in this study is georeferenced with UTM-zone 44 projection system and WGS-84 datum
Table 1. Orbit specifications of Cartosat-1
Table 2. Cartosat-1 payload specification
Methodology
The process of automatic feature extraction is mainly divided in to three parts: (a) image processing, (b) information extraction using spatial filtered, (c) information extraction using fuzzy rule base classification.
The panchromatic image of the study area was fused with the multispectral images with the help of Brovey transformation and nearest neighborhood method. There are other methods for the image fusion like principle component analysis, IHS (Intensity Hue and Saturation) and multiplicative. All these methods have been tested out for better output but out of these methods, Brovey Transform is found the best for the study purpose. Multiplicative is also used for the urban application. Details of methodology for automatic features extraction is given in the Figure 2.
Two approaches are used for automatic feature extraction in the study area: (1) applying different spatial filters and (2) object oriented fuzzy classification.
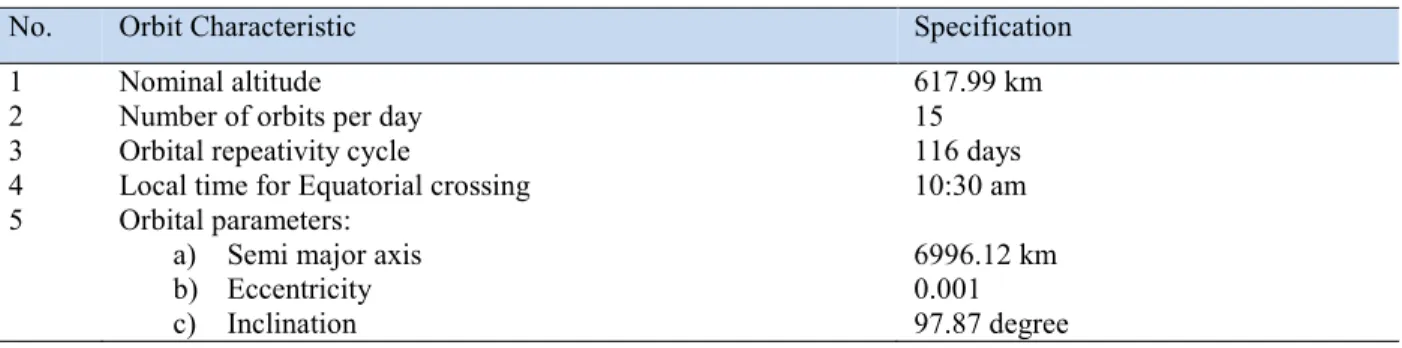
No. Orbit Characteristic Specification
1 Nominal altitude 617.99 km
2 Number of orbits per day 15
3 Orbital repeativity cycle 116 days
4 Local time for Equatorial crossing 10:30 am
5 Orbital parameters: a) Semi major axis b) Eccentricity c) Inclination
6996.12 km 0.001 97.87 degree
No. Parameter Name Specification Fore (+26 deg) and
Aft (-5 deg) 1 Spatial resolution:
GIFOV (across-track × along track)
2.5 × 2.78 m (Fore); 2.22 × 2.23 m (Aft) 2 Spectral resolution: a) No. of bands b) Bandwidth 1 Panchromatic 500 nm to 850 nm 3 Radiometric resolution: a) Saturation radiance b) Quantization c) SNR 55mw/cm*cm/str/micron 10 bits 345 at saturation radiance 4 Swath (stereo)
Fore + Aft combined (mono)
30 km 26.855 km
5 CCD parameters:
a) No. of detectors / elements b) Detector element size c) Odd-Even Spacing 12,000 per camera 7 × 7 microns 35 microns staggered 6 Optics: a) No. of mirrors
b) Effective focal length (mm) c) F-Number
d) Field of view (degrees)
3 1980 F/4.5 +/- 1.08
7 Integration time (ms) 0.336
Approach 1
Filtering is a broad term, which refers to the altering of spatial or spectral features for image enhancement. Convolution filtering is the process of averaging small sets of pixels across an image. Convolution filtering to used to change the spatial frequency characteristics of an image (Jensen 1996).
The merged image is filtered using the different high pass filters like Kirsch, Laplace, Prewitt, Sobel, Canny filtered images (Fig. 3 a-e). These filters are used for detection of the edges but were not found appropriate for the study area; hence this method is discarded and another approach is used which is suitable for detection of edge.
Figure 3 (a-e). Filtered images (Kirsch, Laplace, Prewitt, Sobel, Canny filtered images) Approach 2
Multiresolution segmentation is a new procedure for image object extraction. It allows the segmentation of an image into a network of homogeneous image regions at any chosen resolution (Pandey, 2004; Dell’Acqua & Gamba, 2007). These image objects primitives represent image information in an abstracted from serving as building blocks and information carries for subsequent classification. Beyond purely spectral information, image objects contain a lot of additional attributes which can be used for classification: shape, texture and operating over the network a whole set of relational/contextual information. They offer some basic advantages:
– Multiresolution segmentation separates adjacent regions in an image as long as they are significantly contrasted even when the regions themselves are characterized by a certain texture or noise. Thus, even textured data can be analyzed.
– Homogeneous image objects provide a significantly increased signal to noise ratio compared to single pixels as to the attributes to be used for classification. Thus, independent of the multitude of additional information, the classification is more robust.
– Each classification task has its specific scale. Only image objects of an appropriate resolution permit analysis of meaningful contextual information. Multiresolution segmentation provides the possibility to easily adapt image object resolution to specific requirements, data and tasks.
– Segmentation drastically reduces the sheer number of units to be handled for classification. Even if a lot of intelligence is applied to the analysis of each single image object, the classification works relativity fast.
– Using the possibility to produce image objects in different resolutions, a project can contain a hierarchical network with different object levels of different resolutions. This structure represents image information on different scales simultaneous. Thus, different object levels can be analyzed in relation to each other. For instance, image objects can be classified as to the detailed composition of sub objects.
– The object oriented approach which first extracts homogeneous regions and then classifies them avoids the annoying salt and pepper effect of the more or less spatially finely distributed classification results which are typical of pixel based analysis.
Result and discussion
Multiresolution segmentation
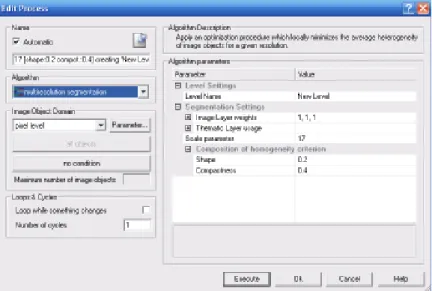
First of all the Cartosat-1 fused image was segmented using Definiens Developer in contest of the building segmentation is carried out to adjust scale parameter, shape factor and compactness. These parameters should be adjusted that the process gives the homogeneous region with defined boundary of the object of interest. Once these parameters ratios are adjusted into homogeneous pattern, different rules can be implemented using fuzzy rule base for feature extraction.
Table 3. Parameters used for segmentation
Table 3 shows the parameters used for segmentation. By using scale parameter 17 and homogeneity criterion (Shape factor 0.2, Compactness 0.4), we are getting no. of object 680 and similarly by taking scale parameter 30, shape factor 0.2, compactness 0.5, we got no. of object 500 and when we used scale parameter 40, shape factor 0.3, compactness 0.5 then no. of object were 122.Process of segmentation by scale parameters 17, 30 and 40 are given in the Figures 4, 6 & 8 respectively.
Definiens Developer software mainly works on the concepts of object oriented classification and also works on the multiresolution segmentation. The image is segmented for the classification of different urban areas. Classification was done using specific sets of rules. After being segmented, the image was queried with various parameters. Different sets of rules were applied on the segmented image using different parameters for extracting the buildings. So, the image was queried with various parameters for
Scale parameter 17 30 40
Homogeneity criterion Shape factor 0.2 0.2 0.3
Compactness 0.4 0.5 0.5
extracting the buildings. The best result of building extraction was achieved by using some spectral range, texture, values and shape.
In this software, classification is conducted by fuzzy logic. The segmentation was done at varying resolutions. This image segmentation technique is called multiresolution segmentation. This segmentation algorithm was applied on the image so that the similar kind of pixels from groups according to the applied homogeneity criteria. Thus based on the homogeneity criteria, the objects were formed by merging the pixels falling under the criteria.
Result of segmented images by different scale parameters
By taking scale parameter 17 and homogeneity criteria (shape factor 0.2, compactness 0.5), the objects are lying inside building area in segmented image. And this shows that these parameters are better for building extractions (Fig. 5).
There are different parameters used for deciding the homogeneity criteria for the image segmentation. Multiresolution segmentation was done at different scale parameters. The scale parameters determine size of the objects formed during segmentation.
Figure 4.Process of segmentation by scale parameters 17
Figure 5.Result of segmented image by scale parameters 17
Figure 6.Process of segmentation by scale parameters 30
Figure 7.Result of segmented image by scale parameters 30
By taking scale parameter 30 and shape factor 0.2, compactness 0.5, the objects of interest lying outside the building area boundary. By which it can be analysed that this parameters is not very much suitable for building extraction (Fig. 7).
Figure 8.Process of segmentation by scale parameters 40
Figure 9.Result of segmented image by scale parameters 40
By taking scale parameter 40, shape factor 0.3, compactness 0.5, the objects lying outside of area of interest. This scale parameter is very helpful for extraction of big object like large building (Fig. 9).
Throughout the image segmentation, the whole image is segmented and image objects are generated based on several adjustable criteria of heterogeneity in shape. By modifying the value of the scale parameter, vary the size of the resulting image objects. A high scale parameters result in large objects and vice-versa. After segmentation, the image is classified on object – oriented based approach. This process of classification of objects has been done using an export knowledge base which is inbuilt function of Definiens Developer. The fuzzy classification method takes into account that there are pixels of mixed makeup, that is, pixels cannot be definitively assigned to one category. “Clearly, there needs to be a way to make the classification algorithms more sensitive to the imprecise (fuzzy) nature of the real world” (Jensen 1996). Fuzzy classification works using a membership function, where in a pixel value is determined by whether it is closer to one class than another. A fuzzy classification does not have definite boundaries, and each pixel can belong to several different classes (Jensen, 1996).
Corresponding to the rule and the knowledge, the membership values and multiresolution fuzzy curves were defined. Different curves describe how the membership value for a specific expression is assigned and calculated for a certain feature values of image objects. The fuzzy membership functions Gaussian, Full range, Singleton and Larger than proved the most promising for building extraction from
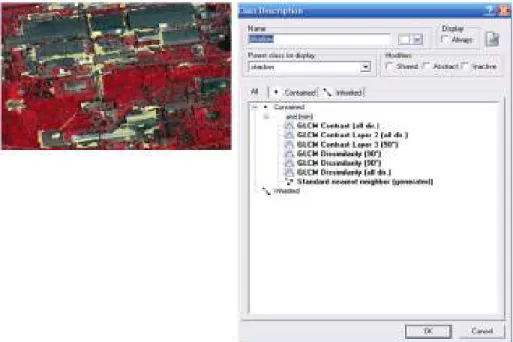
the segmented image. Class description of vegetation, shadow and building are analyzed and its results are shown in the Figures 10, 11 & 12 respectively.
a. Class description of vegetation
Figure 10. Classification of vegetated area and classification of vegetation class using algorithm classification and membership function in the class description
b. Class description of shadow
Figure 11.Classification of shadow and classification of shadow class using algorithm classification and membership function in the class description
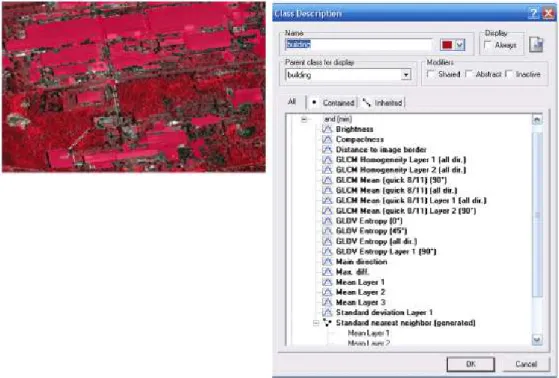
Different rules have been applied for building extraction. The class hierarchy generated for building extraction, which contain set of object based rules with their corresponding membership values. Every single rule was assigned to one membership functions. These rules are collectively compiled in a class hierarchy and the image is classfied for building extraction.
c. Class description of buildings
All classes and their content are stored in the class hierarchy and can be structured in a semantic way in the groups hierarchy and inherit their conditions by structuring them in the inheritance hierarchy. The process tree window for the building, vegetation and shadow and features of classification are also clearly represented respectively.
Figure 12.Classification of building and classification of building class using algorithm classification and membership function in the class description
Accuracy measurement
a. Quantitative assessment
Quantitative assessment is calculated on the area accuracy bases. It defines the accuracy in extraction in the area, the difference in reference and extracted data.
Area accuracy = Area extracted (sq. m) / Area extracted (sq. m) × 100
Table 4. Number of buildings and difference error
No. of building Difference error (%)
1 1.09 2 0.10 3 -3.66 4 6.89 5 14.30 6 -2.20 7 7.71 8 13.86 9 12.7 10 13.50 11 7.08 12 -5.07 13 -3.13 14 -11.25
Number of building and percentage of difference error is clearly shown in the Table 4. Maximum 14.30% difference error of no. of building 5, no. of building 10 shows 13.50% difference errors. No. of building 3, 6, 12, 13, 14 show percentage difference error in negative trend, in which no. of building 14 shows minimum -11.25% difference error.
b. Classified image
After classification process, classified image has been generated (Fig. 13). When export the building from classified image, we get only the feature of interest i.e. buildings.
Figure 13. Classified imageafter fuzzy classification and its accuracy
Overall accuracy of classified image is 0.93 and Kappa accuracy is 0.89. The produce accuracy for building, vegetation and shadow are 0.9545, 1.0 and 0.8888 respectively whereas user accuracy for building, vegetation and shadow are 1.0, 0.9375 and 1.0 respectively.
Classification overall accuracy based on TTA mask (training and test area mask) is calcluated. Classification overall accuracy is 0.97 and Kappa accuracy is 0.95. The producer accuracy for building, vegetation and shadow are 1.0, 1.0 and 0.7144 respectively and user accuracy for building, forest and shadow are 1.0, 0.9375 and 1.0 respectively.
Figure 14.Referenced building and extracted building
Area of referenced building is 14,728.46 sq.m whereas area of extracted building is 14,380.37 sq. m. The overall accuracy of building is 97.80%. Referenced buildings and extracted buildings are shown in the Figure 14 (a & b).
Conclusion
A building plays an important role in an urban scenario. An urban planner needs to acquire building data which can be done through high resolution satellite remote sensing and related techniques. Automatic building extraction using remotely sensed data does suffer from some problems especially in urban areas due, for one, to spectral complexity in the scene because building lying in low and poor contrast images could not be extracted using Cartosat-1 data. For another, some objects have spectral reflectance similar to buildings which is a hindrance when tone alone is used for extraction. Building roofs which were non- homogeneous, sloping, flat and the like may cause different spectral properties among other issues.
The steps followed in this study gave satisfactory results when compared with the original digitized vector layer because the clear edges of buildings were not extracted but coincided with the original image of urban buildings. The features extracted using the methods can be considered as footprints of the buildings.
The image processing software like Erdas Imagine (ver. 10) helps to explore images and extract features. The Definiens Developer with its plentiful options also plays an important role in making the extraction of features easy thus enabling the user to achieve suitable extractions according to features. The fuzzy classification used in this software has many options in feature extracting classifications, including the automatic extraction techniques which enabled the thinning of the edges of urban buildings extracted.
Acknowledgement
First author express her heartily thanks to Mrs. Minakshi Kumar, Scientist-F, IIRS (ISRO),for her expert knowledge and useful suggestions. She is also thankful to Mrs. Shefali Agrawal, Scientist, IIRS (ISRO), Dehradiun, India for extending valuable suggestions.
References
Benediktsson JA, Pesaresi M, Amason K (20030) Classification and feature extraction for remote sensing images from urban areas based on morphological transformations. IEEE Transactions on Geoscience
and Remote Sensing 41 (9), 1940-1949.
Bückner J (1998) Model based road extraction for the registration and interpretation of remote sensing data. The International Archives of the Photogrammetry, Remote Sensing and Spatial Information Sciences, vol. 32, part 4/1, pp. 85-90.
Burnett C, Blaschke T, Burnett C (2002) Objects / not-objects and near-decomposability: Ecosystems and GI. In: NCGIA (ed) GIScience 2002, Boulder, pp. 225-229.
Chang K-T (2007) Introduction to Geographic Information Systems. McGraw-Hill, New York.
Chen T (ed) (1998) The past, present and future of image and multidimensional signal processing. IEEE
Signal Processing Magazine, vol. 15, pp. 21-58.
Dell’Acqua F, Gamba P (2007) Spectral resolution in the context of very high resolution urban remote sensing. In: Q. Weng, D. Quattrochi (eds) Urban Remote Sensing, pp. 377-391. CRC/Taylor & Francis, Boca Raton, FL.
Foresti GL, Pellegrino FA (2004) Automatic visual recognition of deformable objects for grasping and manipulation. IEEE Transactions on Systems, Man, and Cybernetics. Part C: Applications and
Reviews34 (3), 325-333.
Gonzalez RC, Woods RE (2002) Digital image processing. Prentice Hall, Upper Saddle River.
Huertas A, Nevatia R (1988) Detecting buildings in aerial images. Computer Vision, Graphics, and
Image Processing41, 131-152.
Itti L, Koch C (2001) Computational modelling of visual attention. Nature Reviews. Neuroscience2 (3), 194-203.
Jensen JR (1996) Introductory digital image processing: A remote sensing perspective. Prentice Hall, Upper Saddle River.
Kettig RL, Landgrebe DA (1976) Classification of multispectral image data by extraction and classification of homogeneous objects. IEEE Transactions on Geoscience Electronics 14 (1), 19-26. Kim Z, Nevatia R (1999) Uncertain reasoning and learning for feature grouping. Computer Vision and
Image Understanding76 (3), 278-288.
Lee DS, Shan J, Bethel JS (2003) Class-guided building extraction from Ikonos imagery.
Photogrammetric Engineering & Remote Sensing69 (2), 143-150.
Lhomme S, He DC, Morin D (2004) Évaluation de la qualité d’une image Ikonos pour l’identification du bâti en milieu urbain. Télédétection3 (5).
Lin C, Nevatia R (1998) Building detection and description from a single intensity image. Computer
Vision and Image Understanding72 (2), 101-121.
Lucchese L, Mitra SK (2001) Color image segmentation: A state-of-the-art survey. Proceedings of the
Indian National Science Academy67A (2), 207-221.
Mayer H, Laptev I, Baumgartner A, Steger C (1997) Automatic road extraction based on Multi-Scale modeling, context and snakes. The International Archives of the Photogrammetry, Remote Sensing and
Spatial Information Sciences 32, part 3-2W3, pp. 106-113.
Pal NR, Pal SK (1993) A review on image segmentation techniques. Pattern Recognition 26 (9), 1277-1294.
Pandey AK (2004) Automatic urban road extraction using airborne laser scanning – altimetry and high
resolution satellite data (M.Sc. Thesis). ITC, Enschede.
Pigeon L, Solaiman B, Toutin T, Thomson KPB (2001) Linear planimetric feature domains modeling for multisensors fusion in remote sensing. Proceedings of SPIE, Sensor Fusion: Architectures,
Algorithms, and Applications IV, vol. 4051, pp. 8.
Puissant A, Weber C (2002) The utility of very high spatial resolution images to identify urban objects. Geocarto International17 (1), 31-41.
Segl K, Kaufmann H (2001) Detection of small objects from high-resolution panchromatic satellite imagery based on supervised image segmentation. IEEE Transactions on Geoscience and Remote
Sensing39 (9), 2080-2083.
Shan J, Lee SD (2002) Generalization of building polygons extracted from IKONOS imagery. Symposium on Geospatial Theory, Processing and Applications, Working Group IV/3, Ottawa. Tseng Y-H, Wang S (2003) Semiautomated building extraction based on CSG model-image fitting.
Photogrammetric Engineering & Remote Sensing69 (2), 171-180.
Zhang C, Murai S, Baltsavias E (1999) Road network detection by mathematical morphology.
Proceedings of ISPRS Workshop “3D Geospatial Data Production: Meeting Application