AMCIS 2005 Proceedings
Americas Conference on Information Systems
(AMCIS)
2005
Comparing Methods to Extract the Knowledge
from Neural Networks
Christie M. Fuller
Oklahoma State University, [email protected]
Rick L. Wilson
Oklahoma State University, [email protected]
Follow this and additional works at:
http://aisel.aisnet.org/amcis2005
This material is brought to you by the Americas Conference on Information Systems (AMCIS) at AIS Electronic Library (AISeL). It has been accepted for inclusion in AMCIS 2005 Proceedings by an authorized administrator of AIS Electronic Library (AISeL). For more information, please contact
Recommended Citation
Fuller, Christie M. and Wilson, Rick L., "Comparing Methods to Extract the Knowledge from Neural Networks" (2005).AMCIS 2005 Proceedings. 116.
Comparing Methods to Extract
the Knowledge From Neural Networks
Christie M. Fuller
Department of Management Science and
Information Systems, Oklahoma State University
[email protected]
Rick L. Wilson
Department of Management Science and
Information Systems, Oklahoma State University
[email protected]
ABSTRACT
Neural networks (NN) have been shown to be accurate classifiers in many domains. Unfortunately, the lack of NN’s explanatory capability of knowledge learned has somewhat limited their application. A stream of research has therefore developed focusing on knowledge extraction from within neural networks. The literature, unfortunately, lacks consensus on how best to extract knowledge from help neural networks. Additionally, there is a lack of empirical studies that compare existing algorithms on relevant performance measures. Therefore, this study attempts to help fill this gap by comparing two different approaches to extracting IF-THEN rules from feedforward NN. The results show a significant difference in the performance of the two algorithms depending on the structure of the dataset utilized.
Keywords
Neural Networks, Data Mining, Knowledge Extraction, Rules, Classifier Systems.
INTRODUCTION
Neural networks have been successfully applied in many fields. The classification accuracy of neural networks in empirical studies typically exceeds those of traditional techniques such as logistic regression, discriminant analysis, and inductive learning systems (Andrews, Diederich, and Tickle, 1995). Nonetheless, their use in practice has been somewhat limited by the lack of an explanatory capability of knowledge learned by the network.
A considerable amount of research has been conducted in this area, developing algorithms for several different neural network architectures, and both prediction and classification problems. Even with the existence of a widely cited taxonomy for classifying these techniques and measuring their usefulness (Andrews, et al. 1995), there remains a lack of empirical studies comparing different algorithms on relevant performance measures. Further, most algorithms have been tested only on small data sets. Additionally, most studies do not report the performance of the algorithm on many key measures. A more thorough understanding of these algorithms and their performance on all relevant measures can expand the usefulness of these techniques. This study will empirically compare two knowledge extraction algorithms using the rule quality measures as defined by Andrews, et al. (1995). The algorithms studied are applied to a feedforward multilayer perceptrons trained through backpropagation. The algorithms extract Boolean if-then rules from networks used for classification.
LITERATURE REVIEW
Previously, a taxonomy has been developed to describe different neural network knowledge extraction techniques. The translucency dimension of this taxonomy describes the relationship between the rules and the network architecture. This dimension divides knowledge extraction algorithms into three categories: decompositional, pedagogical and eclectic. Decompositional algorithms extract rules at the level of the individual neurons within the network. The weights at each level within the network are utilized in determining the rules that are extracted (Bologna, 2002). Pedagogical algorithms treat the network as a ‘black box’ and attempt to map the inputs directly to outputs. These techniques do not analyze the composition of the neural network in depth. Decompositional algorithms view the network as transparent, where pedagogical algorithms view the networks as opaque. Eclectic approaches include elements of both the decompositional and pedagogical methods of rule extraction (Andrews, Diederich, and Tickle, 1995; Tickle, Andrews, Golea, and Diederich, 1998).
Another dimension used to classify rule algorithms is rule quality. Measures of rule quality include accuracy, fidelity and comprehensibility. Rule accuracy measures the ability of the rules to classify unseen examples. Fidelity measures how well
the classifications made by the extracted rules mimic the classifications of the trained neural network. Comprehensibility measures the number of rules produced, as well as the number of antecedents per rule (Andrews et al, 1995).
Bologna (2000a;2000b) proposed the eclectic Discretized Interpretable Multi Layer Perceptron Model (DIMLP) where neurons of the first hidden layer are connected to only one input neuron. The rest of the network is fully connected. A staircase activation function, which approximates the usual sigmoid function, is used in the first hidden layer to transform continuous inputs into discrete values. This avoids any necessity to transform the variables into binary form, as is required by many other algorithms (Bologna, 2002). The extraction technique determines discriminant hyper-plane frontiers, builds a decision tree from this result, and then further prunes and modifies the resultant rules. The hyper-plane frontiers are determined using the weights between the input and first hidden layer and represent frontiers between regions of different classes (Bologna, 2000a). The training examples and network responses to these examples are used to determine the relevance of the hyper-planes. Thus, the algorithm uses components of decompositional approaches and pedagogical approaches .
In previous studies, this network architecture resulted in very similar classification accuracy to a standard multilayer perceptron. DIMLP was also more accurate than the inductive learning technique C4.5 on several data sets, but demonstrated less comprehensibility (i.e., more rules and more antecedents per rule). DIMLP was shown to have an average rule accuracy of up to 99.1%, though its accuracy varied widely depending on the data set utilized (Bologna, 2002). However, in these studies, it is not made clear which part of the data, training, testing or all, the reported results are based on. The algorithm is somewhat unique in that for the training data, it always demonstrates 100% fidelity. BIO-RE is the only other algorithm that has this characteristic (Taha and Ghosh, 1999). This technique has been shown to have excellent potential as a highly accurate rule extraction algorithm; however, its performance has not been tested against that of other neural network rule extraction algorithms.
Fan and Li (2002) present a method for rule extraction in which the hidden neurons are used to partition the input space into subspaces. The number of partitions created is equal to the number of hidden neurons in the network. To extract rules, the data that ‘fall’ in the subspaces are analyzed based on their ‘classes’. The derived rules from this step are then reduced and simplified. This method was compared to the original NN, genetic algorithms, C4.5, and rough set approaches using the linearly separable IRIS data set. In this domain, the proposed rule extraction method showed better accuracy and greater comprehensibility than the other methods. The fidelity of the rules created by this algorithm has not previously been evaluated. This technique has not been compared to other algorithms based on feedforward backpropagation NN. The performance of the Fan and Li algorithm has only been reported for two datasets. Both algorithms included in this study are able to process continuous attributes, a desirable characteristic if the algorithms are to be used in real-world settings.
METHODOLOGY Data Sets
To test the performance of the algorithm, two synthetic data sets were utilized. The benefits of using synthetic data are well-known, allowing minimization of data confounds in the study. However, use of synthetic data also limits generalizability of results (Parmanto, Munro, and Doyle, 1996). For an introductory study, the benefits of this type of data outweigh its detriments. The data sets were formed from a fictitious bank database of 30,000 records (Wilson, Rosen and Al-Ahmadi, 2004). The database has 5 continuous independent variables with known means, standard deviations, etc., representing Home Equity, Stock/Bonds, Liabilities, Savings/Checking and CD’s. A single binary dependent variable was systematically added to the data. In the first data set, a decision tree was created using the five independent variables and then applied to the data to determine the output class for each observation. The decision tree was formed such that 50% of the observations belonged to each of the two dependent variable classes. For the second data set, a linear relationship was formed from the five independent variables to determine class membership. Equal membership in each of the two possible output classes was also the result of the linear relationship of this data set. By using these two somewhat simplistic, yet distinct, structures, it can be determined if the algorithm shows consistent performance regardless of the underlying structure present in the data. (Wilson, et al., 2004).
Algorithm Implementation
Fan/Li.
To implement the Fan and Li algorithm, Neural Connection version 2.1, a pc-based neural network software package, was used to create and train an MLP. The algorithm requires a network with linear input layer activation function, sigmoid hidden
layer activation function and linear output activation function. Using software default settings, a network with 5 input nodes, 4 hidden nodes and 2 output nodes was trained and tested. The algorithm specifies that the input space is divided by a number of partitions equal to the number of hidden neurons. These partitions create a number of subspaces of the input space. The connection weights between the input and hidden nodes were used to develop the equations for these partitions of the input space. (Al being the equation which defines the first subspace, etc.) The first subspace is the area which satisfies the conditions A1>0 and A2>0 and A3>0 and A4>0. All observations which satisfy this requirement are placed in this subspace. The fifteen remaining subspaces are created by determining the remaining possible greater than and less than combinations of A1, A2, A3, and A4. After defining the subspaces, the data set is then sorted into these subspaces, keeping each output class separate. Based on these classifications, rules were developed for all subspaces which contained more than 2.5% of a given class, as recommended by Fan and Li. For subspaces which rules were created for both possible output classes, the rule which had less support was eliminated. The test set was then classified according these rules. The performance of the algorithm was then calculated.
DIMLP
The DIMLP algorithm was implemented using specialized software written by the algorithm’s originator. As described previously, the DIMLP network has a specialized architecture. The DIMLP network had five input neurons, five neurons in the first hidden layer, four hidden neurons in the second hidden layer, and two output neurons. Four hidden neurons were used in the second layer in order to be consistent with the network used for the Fan and Li algorithm. Otherwise, default software parameters were utilized. The DIMLP program required normalization of the training and testing sets described previously. After the network is trained, rule extraction is performed. The steps of the rule extraction procedure include determination of relevant discriminant hyperplanes, building a decision tree, pruning antecedents and pruning the rules. Relevant performance measures are automatically calculated.
Cross validation
Five-fold cross validation was implemented to assess the performance of the algorithms. Each 30,000 observation data set was partitioned into five equal sections of 6000 observations each. Four sections were used for training the appropriate NN and the remaining section was used for testing the network. Each algorithm was tested five times, so that each of the five sections of either data set was used once as the testing set. The partitions were stratified so that the observations were split equally between the two possible outputs. Cross validation provides better estimations of the true error rates of the NN than a single train-and-test experiment. Practical considerations led the study to use five-fold rather than ten-fold validation, which is usually done for small data sets (Sarle, 2004; Weiss and Kulikowski,1991). The results of the five experiments will be averaged to estimate the accuracy of the algorithms.
Performance measures
Network accuracy determines how often the classification of the neural network matches the actual classification of each observation. It is reported as a percentage of total number of observations. Accuracy is calculated separately for the training and testing data. Fidelity measures how often the classification made by the extracted rules matches the classification made by the neural network. Fidelity is calculated by dividing the number of matching observations by the total number of observations in the data set. It is expressed as a percentage. Rule accuracy measures how often the extracted rules match the actual classification of the observations by the neural network. This measure can be calculated in two different ways. The first is the sum of the number of times the rule classification and actual classification match divided by the number of observations. The second method of calculating rule accuracy only checks accuracy for those observations for which there is fidelity. In other words, rule accuracy is only determined for those cases where the rule classification and network classification match. Rule accuracy is also expressed as a percentage. This second type of rule accuracy is the only measure of rule accuracy provided by DIMLP.
MANOVA is an appropriate statistical procedure to use for data with categorical input and more than one continuous output. However, the correlation between network accuracy and rule accuracy, as calculated according to the second method, is approximately 0.99 for the testing data, and 0.87 for the training data. Due to extremely high correlation between these dependent variables, the assumptions of MANOVA cannot be met. A two-factor ANOVA procedure will be used for each of the dependent variables to allow interpretation, where appropriate, of the interaction between data set and algorithm, and the main effects of each independent variable on neural net accuracy, rule accuracy, and fidelity.
RESULTS
Neural Net Accuracy
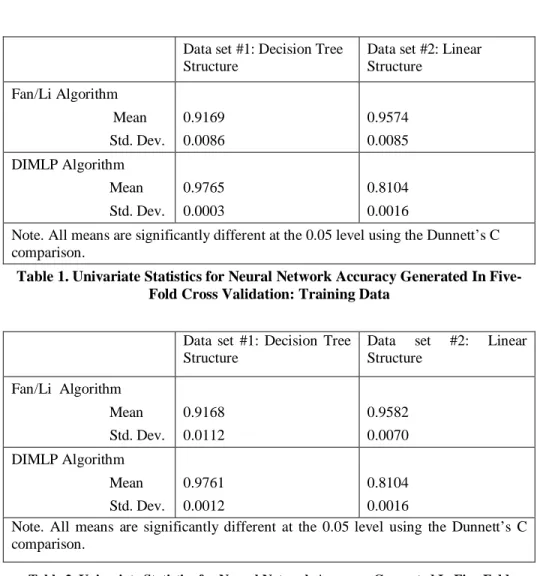
There is a significant interaction (p<.01) between data set and technique for NN training accuracy. The assumption of constant variance could not be met, so Dunnett’s C is an appropriate post hoc test to analyze the differences between the different cells. Post hoc multiple comparisons show that the results for each of the four data set and technique combinations are significantly different (see Table 1). The most accurate network was that created by DIMLP for Data set #1. The least accurate network was that created by DIMLP for data set #2. For the testing data, the results were very similar, as shown in table 2.
Data set #1: Decision Tree Structure
Data set #2: Linear Structure Fan/Li Algorithm Mean Std. Dev. 0.9169 0.0086 0.9574 0.0085 DIMLP Algorithm Mean Std. Dev. 0.9765 0.0003 0.8104 0.0016
Note. All means are significantly different at the 0.05 level using the Dunnett’s C comparison.
Table 1. Univariate Statistics for Neural Network Accuracy Generated In Five-Fold Cross Validation: Training Data
Data set #1: Decision Tree Structure
Data set #2: Linear Structure Fan/Li Algorithm Mean Std. Dev. 0.9168 0.0112 0.9582 0.0070 DIMLP Algorithm Mean Std. Dev. 0.9761 0.0012 0.8104 0.0016
Note. All means are significantly different at the 0.05 level using the Dunnett’s C comparison.
Table 2. Univariate Statistics for Neural Network Accuracy Generated In Five-Fold Cross Validation: Testing Data
Fidelity
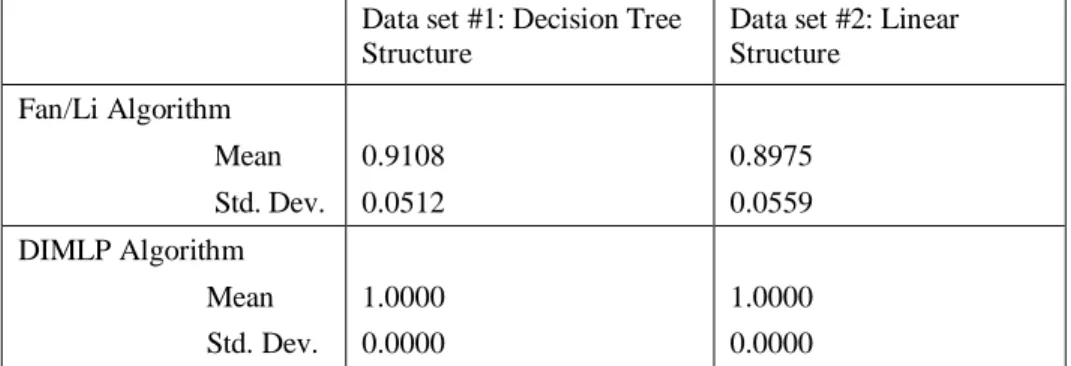
For the performance measure fidelity, there is a significant effect (p<0.01)due to technique for the training data. The DIMLP algorithm performs significantly better than the Fan and Li approach, which is to be expected as the DIMLP algorithm is designed to have 100% fidelity. The interaction of data set and algorithm (p=0.753), as well as the main effect of data set (p=0.763), is non-significant. Again, the results of the testing data are very similar. There is no significant interaction between the algorithm and the data set (p=.701) and the main effect of the data set is also not significant (p=.701). The results show that the techniques are each consistent, in terms of fidelity, across the data sets for both the training and testing data (see Tables 3 and 4).
Data set #1: Decision Tree Structure
Data set #2: Linear Structure Fan/Li Algorithm Mean Std. Dev. 0.9108 0.0512 0.8975 0.0559 DIMLP Algorithm Mean Std. Dev. 1.0000 0.0000 1.0000 0.0000
Table 3. Univariate Statistics for Fidelity Generated In Five-Fold Cross Validation: Training Data
Data set #1: Decision Tree Structure
Data set #2: Linear Structure Fan/Li Algorithm Mean Std. Dev. 0.9092 0.0515 0.8988 0.0533 DIMLP Algorithm Mean Std. Dev. 0.9997 0.0003 0.9999 0.0001
Table 4. Univariate Statistics for Fidelity Generated In Five-Fold Cross Validation: Testing Data
Rule Accuracy (with Fidelity)
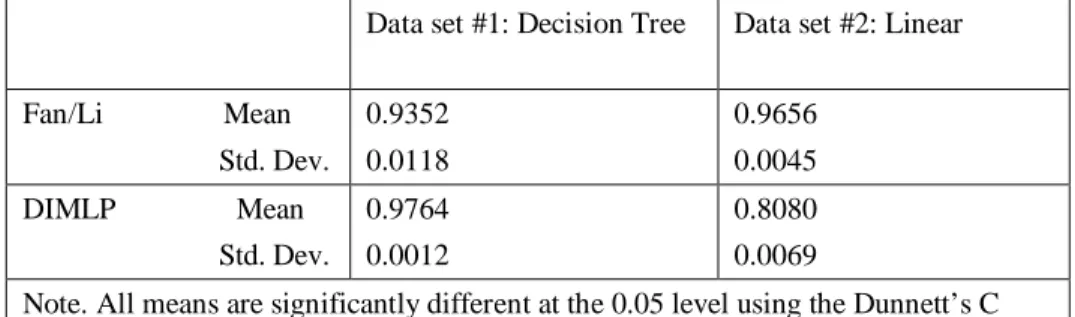
When rule accuracy is calculated only for those observations for which there is fidelity, i.e. the rule classification matches the network classification, the interaction between data set and algorithm is significant for both the training and testing data. Since the assumption of constant variance is again not met, Dunnett’s C will be used to analyze differences between cells. For the training data, the rule accuracy of the linear data set for the DIMLP algorithm is significantly different from the other three dataset/algorithm combinations (see Table 5). For the testing data, post hoc contrasts show that each data set and algorithm combination show significantly different results. DIMLP outperforms the other technique/data set combinations when it is utilized for the decision tree data set, but shows the worst performance of the group for the linear data set (see Table 6). These results are similar to those for neural network accuracy. While the Fan and Li algorithm shows reasonably good accuracy where there is fidelity, it should be noted that the accuracy is being calculated for far fewer cases for this technique. For the Fan and Li technique, rule accuracy was analyzed for an average of 5455 observations for the decision tree data set, 5393 cases for the linear data set for the testing data. For DIMLP, rule accuracy was checked for an average of over 5998 and over 5999 observations for the decision tree and linear data sets, respectively.
Data set #1: Decision Tree Structure
Data set #2: Linear Structure
Fan/Li Algorithm Mean Std. Dev. 0.9117 0.0452 0.9288 0.0619 DIMLP Mean Std. Dev. 0.9765 0.0003 0.8104 0.0016
Table 5. Univariate Statistics for Rule Accuracy With Fidelity Accuracy Generated In Five-Fold Cross Validation: Training Data
Data set #1: Decision Tree Data set #2: Linear Fan/Li Mean Std. Dev. 0.9352 0.0118 0.9656 0.0045 DIMLP Mean Std. Dev. 0.9764 0.0012 0.8080 0.0069
Note. All means are significantly different at the 0.05 level using the Dunnett’s C comparison.
Table 6. Univariate Statistics for Rule AccuracyWith Fidelity Generated In Five-Fold Cross Validation: Testing Data
Rule Accuracy (without Fidelity)
For the Fan and Li technique, rule accuracy regardless of fidelity can be also be calculated. This compares the output of the extracted rules with the actual observations. There is no significant difference in accuracy based on the data set for the training data (p=0.950) or the training data (p=0.893).
Data set #1: Decision Tree Structure
Data set #2: Linear Structure Fan/Li Algorithm Mean Std. Dev. 0.8732 0.0325 0.8751 .0584
Table 7. Univariate Statistics for Rule AccuracyWithout Fidelity Generated In Five-Fold Cross Validation: Training Data
Data set #1: Decision Tree Data set #2: Linear Fan/Li Algorithm Mean Std. Dev. 0.8732 0.0319 0.8772 0.0563
Table 8. Univariate Statistics for Rule AccuracyWithout Fidelity Generated In Five-Fold Cross Validation: Testing Data
DISCUSSION
An empirical comparison of two rule extraction techniques has been conducted. The results show that there is clearly a difference in the performance in different algorithms, and the differences seen in the techniques appears to be dependent, at least in part, on the data set which is utilized.
Accuracy
While the results show that the Fan and Li algorithm shows significantly different results for both NN accuracy and rule accuracy according to the data set used, these results are not nearly as extreme as those for DIMLP. The average difference for Fan/Li is 4.14% and 3.04% for NN accuracy and rule accuracy with fidelity, respectively for the testing data. The average difference for DIMLP is 16.57% and 16.84% for the same measures. If the goal is consistent performance, regardless of the data, the Fan and Li algorithm is preferable. However, if maximum accuracy is preferred, DIMLP might be the better alternative for data sets similar to the decision tree data set utilized in this study. The results achieved by these rule extraction algorithms are dependent on the structure inherent to the data to which they are applied. As previously noted, all results are based on the default parameters of the software programs used. With additional experimentation, it is likely that the
parameters could have been modified in such a way that the results of one or both algorithms for either technique could have been significantly improved. Further, the Fan and Li technique is a decompositional algorithm, while DIMLP is an eclectic algorithm. The results may be somewhat dependent on the type of algorithm selected rather than the specific algorithms within those categories that were selected for empirical comparison.
Fidelity
This measure of the algorithm is particularly important since it describes how well the rules are able to duplicate the results of the underlying neural network. For managers to be confident in utilizing these algorithms, the ability to demonstrate that the rules produced are in fact explaining the inner workings of the network may be crucial. DIMLP shows 100% fidelity for the training data, and close to 100% fidelity for both data sets for the testing data. This result is not surprising, since this is a feature that has been designed into the algorithm. The Fan and Li algorithm shows around 90% fidelity for both data sets. Since this technique was more consistent in its network and rule accuracy across the data sets, any improvement that can be made in its fidelity may be very advantageous. Further examination of the technique is warranted to see how such improvement may be possible. After network training, the Fan and Li algorithm ignores the weights between the hidden and output layer. Only the weights between the input and hidden layers are used in the rule extraction process. The algorithm needs further study to see if the fidelity can be improved significantly without incorporating all of the network’s connection weights.
Rule Comprehensibility
DIMLP produces an average of nine rules for the decision tree data set with about 4.4 antecedents and 12.6 rules with approximately 7.1 antecedents per rule for the linear data set, as reported by the DIMLP program output. The Fan and Li algorithm produces and average of 7.4 rules for the decision tree data set and 7.8 rules for the linear data set. Each rule for this algorithm includes an equation for each of the four hidden nodes, each with five inputs. This is equivalent to 20 antecedents per rule. Some simplification of the Fan and Li algorithm rules may be possible which might eliminate some of the hidden nodes from part or all of the subspace definitions. However; all five inputs will always be necessary in each remaining rule. It follows that the minimum number of antecedents for each rule for the Fan and Li algorithm is equal to the number of inputs, while the maximum number of antecedents for each rule is equal to the number of hidden nodes times the number of inputs. In this case the minimum number of antecedents would be equal to five, while the maximum would be equal to 5 inputs multiplied by four hidden nodes or twenty antecedents. While DIMLP seemingly produces more rules on average, these rules have far fewer antecedents. Users may prefer to deal with more rules that are easier to comprehend, than to have fewer, more complicated rules. Due to the different nature of the rules produced by the two algorithms, the comprehensibility of the rules may not be strictly comparable.
Rule Refinement and Simplification
There are shortcomings to the method each algorithm uses to classify observations according to the extracted rules. After classifying the data into the subspaces defined by the hidden neuron partitions, initial rules are created in the Fan and Li algorithm. The next step eliminates rules for which less than a given number of observations are classified by that rule. The result of this procedure is that the rules are not able to classify all observations. The percent of observations left unclassified varied from 0.05% to 4.8% of the training data in our trials. Interestingly, the amount of data left unclassified was generally higher for the linear data set than the decision tree data set. DIMLP, in contrast, classifies every observation. However, there appears to be some redundancy in the DIMLP rules, as some observations can be classified by many rules. According to output of the DIMLP rule extraction, each observation was classified by as many as 2.27 rules on average in one iteration. It is clear that for both of these algorithms, further work is needed in refinement and simplification of rules. To be practically useful, a rule algorithm should produce a set of rules that are able to classify all observations in a data set and each observation in the data set should be classified by only one rule.
Portability
Both algorithms require specialized NN architectures. The Fan Li algorithm constrains the activation functions that must be used and limits the network to one hidden layer. The DIMLP algorithm utilizes a staircase activation function in the first hidden layer, which is not fully connected. This limits the use of the algorithms to situations where a NN solution has not already been implemented. In scenarios where an MLP has already been trained, it may be more practical to use a rule extraction algorithm that does not have any particular architecture requirements.
CONCLUSION
The purpose of this study was to empirically compare two rule extraction techniques on accepted performance measures. The results show that the techniques do differ in performance and that this difference is dependent, at least in part, on the data set that is utilized. Further research is needed to show whether these results are due to the particular algorithms and/or data sets chosen. It must also be determined whether the results shown by the decompositional and eclectic algorithms selected for comparison are representative of their respective categories. Additionally, future research should be extended to include multiple techniques of each the three categories: pedagogical, decompositional, and eclectic.
This study is not without its limitations. The current study utilized default network parameters except where modification was specified by the particular algorithm. For example, the sigmoid activation function was specified for the hidden layer of the MLP in the Fan/Li algorithm. Further experimentation by varying the various network parameters most likely could have improved the neural network accuracy for either or both techniques.
This study tested the algorithms on a relatively large, realistic data set, which was structured in two ways: (decision tree and linear structures). Future research should incorporate data sets with additional varying structures, and other potential confounds (proportion of classes, degree of difficulty in classification, etc).
This study is an initial step in addressing the current lack of empirical comparisons of neural network knowledge extraction techniques. Systematic study of the capabilities, as well as, the limitations of these of these algorithms is warranted. The result of such a study can help knowledge management practitioners fully utilize the potential of neural networks, a tool with already proven classification capability.
REFERENCES
1. Andrews, R., Diederich, J., and Tickle, A. B. (1995) Survey and critique of techniques for extracting rules from trained artificial neural networks,Knowledge-Based Systems, 8,4, 373-389.
2. Bologna,G.(2004) DIMLPv2.0 [Computer Software]. Retrieved August 23, 2004, from http://us.expasy.org/people/Guido.Bologna.html.
3. Bologna, G. (2000a) Rule extraction from a multilayer perceptron with staircase activation functions, inProceedings of IEEE-INNS-ENNS International Joint Conference on.Neural Networks 2000 (IJCNN 2000), July 24-27, Como, Italy, 3,419-242.
4. Bologna, G. (2000b) Symbolic rule extraction from the DIMLP neural network,In Hybrid Neural Systems, 1778, 240-254, Springer-Verlag, Berlin.
5. Bologna, G. (2002) Rule extraction from bagged neural networks, in A. Abraham, J. Ruiz-del-Solar, M.Köppen (Eds.)
Soft Computing Systems - Design, Management and Applications, HIS 2002, Santiago, Chile, Frontiers in Artificial Intelligence and Applications 87 IOS Press.
6. Fan;, Y., & Li, C. J. (2002) Diagnostic rule extraction from trained feedforward neural networks.Mechanical Systems and Signal Processing, 16, 6, 1073-1081.
7. Neural Connection (Version 2.1) (1998). [Computer Software]. Chicago, IL: SPSS, Inc.
8. Parmanto, B., Munro, P.W., and Doyle, H.R. (1996) Reducing variance of committee prediction with resampling techniques, Connection Science, 8,3/4, 405-426.
9. Sarle, W. (2004) What are cross-validation and bootstrapping?. Message posted to: http://www.faqs.org/faqs/ai-faq/neural-nets/part3/section-12.html.
10. Taha, I. A., and Ghosh, J. (1999) Symbolic interpretation of artificial neural networks,IEEE Transactions on Knowledge and Data Engineering, 11, 3, 448-463.
11. Tickle, A. B., Andrews, R., Golea, M., and Diederich, J. (1998) The truth will come to light: directions and challenges in extracting the knowledge embedded within trained artificial neural networks,IEEE Transactions on Neural Networks, 9,
6, 1057-1068.
10. Weiss, S.M., and Kulikowski, C.A.(1991) Computer systems that learn: classification and prediction methods from statistics, neural nets, machine learning, and expert systems, Morgan Kaufmann Publishers, Inc, San Mateo, California. 11. Wilson, R., Rosen, P., and Al-Ahmadi, M. (2005) Knowledge structure: understanding why data mining techniques