ARROW@TU Dublin
ARROW@TU Dublin
Conference papers
School of Computing
2013
A Comparative Study of the Effect of Sensor Noise on Activity
A Comparative Study of the Effect of Sensor Noise on Activity
Recognition Models
Recognition Models
Robert Ross
Technological University Dublin, [email protected]
John D. Kelleher
Technological University Dublin, [email protected]
Follow this and additional works at: https://arrow.tudublin.ie/scschcomcon Part of the Computer Sciences Commons
Recommended Citation
Recommended Citation
Ross, R. and Kelleher, J. A Comparative Study of the Effect of Sensor Noise on Activity Recognition Models. Evolving Ambient Intelligence, pp. 151-‐162. Eds: O’Grady, M.J. , Vahdat-‐Nejad, H., Wolf, K-‐H., Dragone, M., Ye, J. , Röcker, C., and O’Hare, G. Springer International Publishing.
This Conference Paper is brought to you for free and open access by the School of Computing at ARROW@TU Dublin. It has been accepted for inclusion in Conference papers by an authorized administrator of ARROW@TU Dublin. For more information, please contact
[email protected], [email protected], [email protected].
This work is licensed under a Creative Commons Attribution-Noncommercial-Share Alike 3.0 License
Noise on Activity Recognition Models
Robert Ross and John Kelleher
Applied Intelligence Research Center, School of Computing, Dublin Institute of Technology, Ireland
Abstract. To provide a better understanding of the relative strengths of Machine Learning based Activity Recognition methods, in this paper we present a comparative analysis of the robustness of three popular methods with respect to sensor noise. Specifically we evaluate the ro-bustness of Naive Bayes classifier, Support Vector Machine, and Random Forest based activity recognition models in three cases which span sen-sor errors from dead to poorly calibrated sensen-sors. Test data is partially synthesized from a recently annotated activity recognition corpus which includes both interleaved activities and a range of both temporally long and short activities. Results demonstrate that the relative performance of Support Vector Machine classifiers over Naive Bayes classifiers reduces in noisy sensor conditions, but that overall the Random Forest classifier provides best activity recognition accuracy across all noise conditions synthesized in the corpus. Moreover, we find that activity recognition is equally robust across classification techniques with the relative perfor-mance of all models holding up under almost all sensor noise conditions considered.
Keywords: Activity Recognition, Sensor Noise, Support Vector Ma-chines, Naive Bayes, Random Forests
1
Introduction
Garbage In Garbage Out is as true of activity recognition as it is of any other part of computer science. However, while data driven predictive models for any domain will be negatively effected by noise in the input features, the structure of the activity recognition domain has a number of distinctive characteristics that complicate this problem. On one hand, in all but very limited situations, the activity recognition task is performed in environments with multiple agents and where activities can be inherently interleaved. A major consequence of this is that activity recognition is not simply a single class classification problem, but must instead accurately track multiple hypothesis in parallel. In such a case
noise is not always simply noise and thus cannot always be filtered out. On the other hand, successful recognition for many activities is often dependent on observing a key characterizing action or event that captures the essence of that activity. Noise in these key features can have an extreme impact on predictive accuracy for individual activities [1].
Before we can design predictive models that are robust to noise in the specifics of the activity recognition domain, we must first understand how noise effects the performance of these models. Part of this task is to investigate whether different types of noise have different or similar impacts on a given activity recognition model. In the context of activity recognition, noise in the input features is pri-marily the result of sensors errors. A sensor could be mistakenly switched off, blocked or completely broken. Alternatively, a sensor could be miscalibrated re-sulting in either the sensor registering events that have not happened or in the sensor missing events when they do happen. Compounding these issues is the fact that often activities are interleaved and consequently not all of the events in an input stream relate to the same activity. Moreover, the noise from these different sources is often hard to differentiate within a particular stream of sensor data. For example, a broken sensor and a sensor that is miscalibrated and misses some events will both result in false negatives in the input feature. Conversely, assuming that activities are independent, the interleaving of events complicates the prediction of an activity in a similar way to a sensor that registers events that have not happened, in both cases input features will be marked as false positives for the target activity.
Clearly, noise of any type will have a negative impact on the accuracy on any particular recognition model; however, given that different model induction algorithms make different assumptions, in terms of their inductive bias, there is a possibility that different types of noise will effect the induced models in different ways. Some models may be more robust to a particular type of noise than another model resulting in a tipping point in the relative performance of the models as the amount of noise in the data increases. In light of the above, in this paper we present a study of the robustness of three different activity recognition models. We continue in Section 2 where we motivate our selection of the models used based on prior work in the area of Human Activity Recognition. Then in Section 3 we introduce the study dataset and describe all essential data pre-processing steps that were taken as well as the representation choices which we adopted. Following this, we present the results of our analysis in detail in Section 4. Following this we draw conclusions and outline proposed future work.
2
Model Selection
Machine learning based and probabilistic Activity Recognition determines to what extent evidence supports competing activity hypotheses. In recent years many different methods from statistical natural language processing and machine learning have been applied to the activity recognition problem (see for example [2] for a recent overview of techniques applied to situation recognition). While structured techniques such as statistical parsers or explicit sequence modeling techniques such as Hidden Markov Models [3–5] or Conditional Random Fields [6] do provide a theoretical firm basis for activity recognition, it has been widely shown that classifier based techniques often provide the best balance of
perfor-mance while retaining effective computational tractability [6, 7]. Consequently, in this study we focused on the analysis of classifier based techniques.
Bayesian prediction models have a strong history in activity recognition. Early examples of probability based activity and plan recognition models appli-cation used Bayesian Networks (See e.g., [8] and [9]). Given the relative design costs and inference costs of applying non-trivial Bayes networks, their use in pure classification tasks has been widely superseded by the use of the more straight-forward naive Bayes classifier. As is well known, the naive characterization of the Naive Bayes classifier is due to its the strong independence assumption that this classifier makes regarding input features. Particularly in the area of activ-ity recognition an assumption of independence between sensors / features which characterize actions being performed in an environment may be too strong an assumption. Despite this, many, including for example Singla [5], have made use of a Naive Bayes classifier to identify activities in the case of interleaved data.
While the Naive Bayes classifier has arguably been the most widely applied classifier in the past 20 years, the class of maximum margin based classifiers and in particular the Support Vector Machine (SVM) have found ever increasing application. Essentially Support Vector Machines are discriminative classifiers built on the observation that the essential job for any classifier is to create suit-able decision boundaries between different classes based on observed instances. Although SVMs require significant training in comparison to the Naive Bayes classifier; this drawback is outweighed both by the ability SVM’s to deal with large numbers of features and also produce highly accurate models. Within the activity recognition domain the SVM is widely seen as one of the best perform-ing yet computationally practical classification techniques, for example [10, 11] are examples of recent work that illustrates the application of SVMs models to activity recognition.
Whereas both the Naive Bayes classifier and the Support Vector Machine operate as individual classifiers, there exist a range of meta-classification or ensemble methods which work by aggregating the predictions of multiple (inde-pendent) models. There are two general approaches to creating such ensemble models: boosting and bagging. The essential difference between these two ap-proaches is that during training boosting incrementally adapts how models are induced so that each new model added to the ensemble is biased to pay more at-tention to training instances that previous models mis-classified; by contrast, in bagging techniques each new model is induced using a randomly selected subset of features and examples. The motivation behind the use of ensemble methods is that the aggregated output of an array of weak prediction models may be more accurate over a datset than a single strong classifier. Indeed, within the Ac-tivity Recognition domain [12, 13] report a study where a LogitBoost ensemble outperformed a range of other classification models.
Given the above, in the study that follows we will investigate the relative performance of Naive Bayes classifiers, Support Vector Machines and ensemble methods. With respect to the ensemble method, given that our focus in on ro-bustness to noise rather than pure model accuracy we chose to use a Random
Forest model as our ensemble classifier. Random Forest is a bagging method and, we argue, that given bagging algorithms use randomly selected subsets of fea-tures during training (rather than the adaptive approach used by boosting) the Random Forest should be more robust to noise, such as missing input features.
3
Corpus Annotation & Preparation
We use the SCARE multimodal corpus as the base dataset for the study [14]. This dataset contains a collection of annotated videos and audio recordings of partici-pant pairs performing joint tasks in a simulated environment . The environment itself is a 3D game like environment in which one individual, the instruction follower can navigate and perform activities, while the second participant, the instruction giver, directs the follower on how to conduct activities. Each Instruc-tion Giver was informed of the five activities that were to be performed by each dyad, and was also given a schematic map of the virtual environment. The In-struction Giver was thus made aware of: (a) which objects were to be moved; (b) where these objects were to be moved from; and (c) where these objects were to be moved to. The Instruction Follower meanwhile could maneuver around in the virtual environment and manipulate that environment by moving objects, opening and closing containers, as well as picking up and placing down items. In the real environment, the Instruction Giver and Instruction Follower were placed in separate rooms and verbally communicated via headsets to jointly complete all five tasks. In total 15 dyad or session recordings are included in the corpus.
The SCARE corpus was selected as a testbed for a number of reasons. First, instruction givers and followers were not constrained in terms of the sequence in which activities were to be performed, and whether or not these activities could be performed in parallel. Thus there was wide variation in terms of the interleaving of activity completion in this tesbed. Second, the activities seen in the data are also varied in length with both very long and short activities present. Third, previous work by the authors [11] showed that the relative performance of Naive Bayes’ and SVM activity recognition models was consistent across a range of datasets, including the SCARE corpus and two datasets from the CASAS Smart Home Project at Washington State University [15, 5]. As a result for this work we restricted the study to the SCARE corpus making the assumption that using a different dataset would not substantively alter the results.
Although the SCARE corpus includes a number of useful annotations such as time aligned speech transcriptions, Activity Recognition requires further anno-tation of the data. We therefore developed and applied an annoanno-tation scheme for activity recognition with the SCARE corpus. The annotation scheme included three distinct layers which labeled the data with respect to: (a) location of the in-struction follower; (b) actions being performed by the inin-struction follower; and (c) activities or goals currently being pursued. Specifically, the location layer denoted which of 19 possible areas in the environment that the Instruction Fol-lower was currently located in. Theactionlayer on the other hand denoted what physical manipulation actions – if any – were currently being performed by the
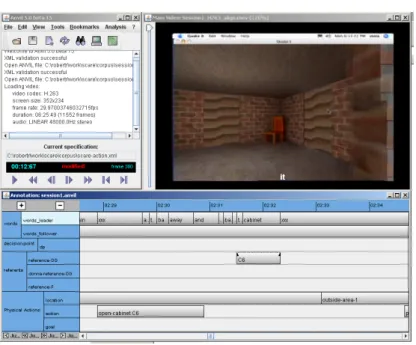
Fig. 1. ANVIL Annotation Tool. The top of the figure depicts a video recording of the Instruction Giver and Instruction Follower’s view of the simulated 3D world. The bottom of the figure depicts the multi-tiered annotation tool interface.
Instruction Follower. In total there were six action types where these types could in turn be parameterised. Examples of action types includePickup(Silencer)and
Open-Cabinet(C1)whereSilencerwas an object in the environment andC1was a named container in that environment. The activity layer was a more course grained annotation layer that denoted what activities were currently being pur-sued by the participant pairing. In total 5 activities were purpur-sued by each dyad, and these activities were frequently interleaved by participants. Thus the anno-tation scheme was defined to mark only the start and end of each activity; thus allowing for activities to be concurrently active. The annotation scheme was ap-plied to each of the 15 SCARE session recordings. For annotation we made use of the ANVIL multimodal annotation tool [16] (See Figure 1).
3.1 Data Preparation
In the context of activity recognition, one critique that can be levelled at classifier models such as Naive Bayes’, SVM and Random Forest is that they do not naturally handle the sequential nature of the information. In order to address this problem we developed a base-set of history-less features and augmented these with a suitable representation of event history. The base set of features of the SCARE dataset consisted of the following six features:
– Step- The number of observations since the beginning of this task.
– Time- The amount of time that has passed since the beginning of this task.
– Place - The current location of the instruction follower in the virtual envi-ronment.
– Activity- The current activity being performed by the instruction follower. Possibly none or null if no action is being performed.
– LastPlace- The last location of the instruction follower.
– LastActivity- The last action performed by the instruction follower - pos-sibly none if no action has yet been performed by the instruction follower for this activity.
Although the baseline features capture a minimal history by including the
LastEventorLastPlaceandLastActivityfeatures, a more complex model which includes histories for individual features is essential for modelling medium and long range dependencies between events. For this model we made use of one fea-ture per activity or location sensor and have that feafea-ture capfea-ture the activation history for that sensor. Specifically, independent binary features were created for each possible level associated with the location and action/event features. These binary features captured whether or not that particular event had been observed in the data stream during a sliding history window of n observations. In previ-ous studies [11] we tested modeling approach against a number of variants and different sliding window sizes. Here we report results for a sliding window size of 100 events the binary sensor features. While the use of such binary features might seem an oversimplification where a more information rich occurrence count based set of features could instead be used, we have previously shown that the simple binary feature approach taken here considerably outperforms the more complex model across a range of data sets and models.
To illustrate the features made use of in this analysis consider the simplified data extract provided in Table 1. Here the first three sensor entries corresponding to an instance of the Activity move-quad are presented (for text compactness the following two acronyms are used: GR1 - Grey-Room-1, and OC C3 - Open-Cabinet C3). Along columns 3 through 8 we see the first 6 features of the data model, while from column 9 onwards each of the individual sensor features which make up the long rang history are captured. The first observed sensor value is an activation for Place at the Grey-Room 1. This activation occurs at step 0 and time 0 and since there were no previous LastEvent or LastPlace occurrences we record NA for these features. The sensor feature for the Grey-Room 1 also activates and will remain active for n rows (n=100 in the current work) past the following row. Similarly in row 2 we see an activation of the Open-Cabinet C3 at a specific time and step and a subsequent activation of its corresponding sensor feature (column 10).
3.2 Introducing Noise
The baseline annotated dataset described above is used for training the Naive Bayes, Support Vector Machine, and Random Forest classifiers, but for testing we
Row Goal Place Event Step Time LastEvent LastPlace GR1 OC C3 ..
0 move-quad GR1 NA 0 0 NA NA 1 0 ..
1 move-quad GR1 NA 1 12.6 NA GR1 1 0 ..
2 move-quad GR1 OC C3 2 15.2 NA GR1 1 1 ..
.. .. .. .. .. .. .. .. .. .. ..
Table 1.Sample Data Extract. (GR1 - Grey-Room-1, and OC C3 - Open-Cabinet C3))
used modified data. Specifically to examine the effect of the noise on the resulting accuracy of the activity recognition models, we generated three collections of test data. Each collection of test data captured a potential source of error in the data as follows:
– Collection A - Random Insertions: Miscalibrated sensors may lead to false sensor positives in any activity recognition scenario. Proximity and inertia detectors may be influenced by environmental factors or other non-human agents in the environment. In the Random Insertion collection we took the baseline data set and inserted a proportion of random observations into the existing sensor event stream. We will report on a range of different insertion rates, i.e., between 1% and 32% extra random data in the data stream.
– Collection B - Random Deletions: Similarly miscalibrated sensors may lead to false sensor negatives where movements in the environment or in-teractions with objects fail to be recognized by the sensor system. In the Random Deletions collection we synthesized such a situation by removing between 1% and 45 % of the real data.
– Collection B - Dead Sensors:False sensor negatives may also be due to the overall failure of one or more sensors in the environment. We modeled this possibility separately through the Dead Sensors collection. Here all results for between 1% and 16% of the sensors were systematically removed from the baseline data set for testing.
It should be noted that for each of the above test-sets the removal or addition of data was performed with respect to the raw data prior to its transformation to the specific features outlined earlier in this section. Therefore the consequences of insertions or deletions are fully expanded out and have consequence to the long range history features for subsequent observations.
4
Results
In the following we report on the evaluation of the activity classification tech-niques considered for each of the three sensor noise data collections.
For each of the error types considered we tested against models within which all original features were present and where Feature Selection had been applied to reduce the feature set. For Feature Selection we made use of an entropy based
information-gain feature selection process where the ranking of individual fea-tures was based on their correlation with the target class. Feafea-tures were ranked and a certain proportion of the lowest ranked features were removed. Given the relatively low number of features in the SCARE corpus, we limited feature selection to remove only the 1/3 lowest weighting features.
Accuracy scores were calculated using k-fold classification within each data set. Namely, for a given dyad d we built a multiclass classifier based on data from all other dyads except the one being considered, i.e., {training data -d}, which we refer to asd0. Predicted target classes for d were calculated using the model built fromd0. This was done for alld with classification accuracy values accrued from the testing of eachd individually.
Moreover, given the random nature of inserting or deleting elements in the methods discussed below, all tests were run on three distinct sets of synthesized values. For example, in the case of Random Insertions we built three distinct insertion data sets I1, I2, and I3. While all three were based on the original annotated data set, the randomly inserted values for all three were selected separately. Our aim here was to build a smoothed result which was less tied to the removal or deletion of one specific reading or sensor. In the results presented below we show the result averaged over all three evaluations for each data set.
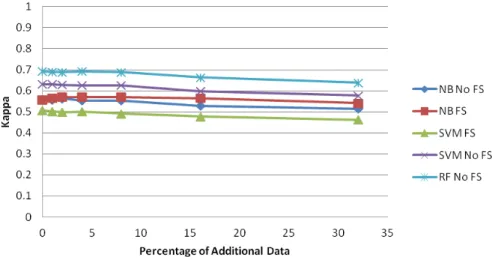
Fig. 2.Kappa Coefficient Scores for SCARE data with random noise insertions.
Figure 2 summarizes the results for our Data Insertion evaluation for the Naive Bayes, Support Vector Machine and Random Forest classifiers across a range of data insertion volumes. Since the activity recognition problem is es-sentially a multi-class classification problem we report prediction accuracy in terms of Cohen’s Kappa Coefficient. Cohen’s kappa is a conservative measure of
accuracy which takes into account the possibility of class agreement happening by chance. From the figure we can firstly note some of the general characteris-tics of the results. The Random Forest classifier significantly outperforms both the Support Vector Machine and Naive Bayes classifiers on the SCARE data set both in the presence of noisy data and in the original unaltered data, i.e., where Percentage of Altered Data = 0. Moreover we see that the application of Feature Selection results in positive gains for the Naive Bayes classifier over the case of using all features, whereas the opposite is the case for the Support Vector Machine classifier. We hypothesis that the interaction between Feature Selection and SVMs is caused by the fact that the Feature Selection process employed con-sidered features in isolation whereas SVM models, unlike Naive Bayes classifiers, have the ability to consider interactions between input features. Consequently, the feature selection process may have removed features that in isolation were not information but in conjunction with other features were useful to the SVM models. Hence, the observed negative impact of Feature Selection on SVM model accuracy.
Considering the results specifically with respect to the insertion of noisy data, we see that all models generally held up well with respect to low volumes of noisy data insertion. To illustrate, the Random Forest classifier’s performance deteriorated by only 0.6% between no inserted data and 8% extra inserted data. Following this point the rate of deterioration accelerated somewhat with a 4% reduction in the Kappa score between no inserted data and 16% inserted data. Looking at the relative performance we see that all models degraded in a broadly similar fashion with the exception that the Naive Bayes classifier with feature selection showed a marginally lower degradation than the Naive Bayes classifier based on a full set of features.
Turning to the case of poorly calibrated and broken sensors which may result in undetected events, let us first consider Figure 3. This figure shows the results for testing where a random proportion of the data has been removed. Similar to the results for the noise insertion study, we see that the Random Forest outperformed all other methods across a range of different test data volumes. Also, all the models are reasonably robust to low levels of noise with a relatively graceful degradation in performance as the noise level increased; for example, even at the point where 25% of the original sensor events had been removed the Random Forest’s performance had decreased by only 7% as measured by Cohen’s Kappa Coefficient.
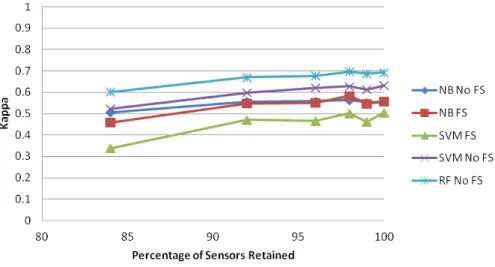
Figure 4 meanwhile presents the case in which the results for entire individual sensors were omitted from the test data. This corresponds to the case of dead or broken sensors which fail to recognize any event occurrences. This differs from the case above in that whereas above events were removed randomly and from any sensor type, here events from some sensors are removed completely while other sensors retain all their readings. While these results are broadly similar to the case of randomly removed readings, it is worth noting the sharp drop at 2% of sensors removed which subsequently recovers. Since sensor selection for removal was random it is possible that very influential sensors can be removed. Even
Fig. 3.Kappa Coefficient Scores for SCARE data with random deletions.
smoothed over three separate runs it is easy to see how dependent the activity recognition process can be even on the specific sensors operating correctly.
5
Conclusions
There can be no doubt that probabilistic and Machine Learning based classi-fication techniques provide a sound theoretical and pragmatic solution to the problem of activity recognition in uncertain and noisy environments. In this pa-per we have provided a brief study which both presented the relative merits of popular Activity Recognition methods, and showed reassuringly that most methods remain consistent in their relative performance across different types of noise in the input data stream. We believe this is a highly useful finding in that we can be assured that there is no need to consider different recognition models in different noise scenarios, and that developers can in general focus on selecting the method that provides the best balance between their accuracy requirements and training time constraints. In this context, the strong performance of the Random Forest models in this study provides some evidence the ensemble based methods may be an fruitful avenue for future research.
In analyzing the relative performance of methods on the activity recognition problem, it is worth noting that the sequential nature of activity data is arguably both a boon and a hindrance in the detection process. Since activity recognition is a sequential process, any noisy readings which are introduced are generally retained within sensor history models many steps after the false positive was initially detected. On the other hand, however, this may be balanced out by the fact that true positives also persist over time. Where the percentage of false positives is significantly outweighed by true positives the erroneous sensor readings can essentially be drowned out by the true history.
While performance degradation – particularly in the case of false positives – may not result in an extreme degradation of performance for low levels of errors, all reduction in performance is a challenge to be overcome in ensuring activity recognition performs acceptably in a real world interleaving and multi-agent environments. Given this, one avenue of future extension of work presented in this paper would be to conduct an initial pass of erroneous feature filtering based on anomaly detection. The difficulty here lies in detecting true noise in a real time basis where an unexpected sensor reading could be due to any number of reasons that are not necessarily due to defective sensors. Other avenues of future work include the extension of the studies presented here to other Activity Recognition corpora and indeed other sensor error models. At the very least we believe that an error model based on an empirical evaluation of error types in real world sensor deployments would be of great benefit to the study of Activity Recognition.
6
Acknowledgements
The authors wish to thank the Irish Research Council for Science Engineering and Technology (IRCSET) for their support through the IRCSET EMPOWER funding programme.
References
1. Geib, C.W., Steedman, M.: On natural language processing and plan recognition. In: International Joint Conference on Artificial Intelligence. (2007)
2. Ye, J., Dobson, S., McKeever, S.: Situation identification techniques in pervasive computing: A review. Pervasive and Mobile Computing8(2012) 36 – 66
3. Bui, H., Venkatesh, S., West, G.A.W.: Policy recognition in the abstract hidden markov model. Journal of Artificial Intelligence Research17(2002) 451–499 4. Bui, H.: A general model for online probabilistic plan recognition. In: Proc. of the
International Joint Conference on Artificial Intelligence (IJCAI. (2003) 1309–1315 5. Singla, G., Cook, D., Schmitter-Edgecombe, M.: Tracking activities in complex set-tings using smart environment technologies. International Journal of BioSciences, Psychiatry and Technology1(2009) 25–35
6. Cook, D.: Learning setting-generalized activity models for smart spaces. Intelligent Systems, IEEE27(2012) 32–38
7. Singla, G., Cook, D.J., Schmitter-Edgecombe, M.: Recognizing independent and joint activities among multiple residents in smart environments. Journal of ambient intelligence and humanized computing1(2010) 57–63
8. Charniak, E., Goldman, R.P.: A bayesian model of plan recognition. Artificial Intelligence64(1993) 53–79
9. Pynadath, D.V., Wellman, M.P.: Accounting for context in plan recognition, with application to traffic monitoring. In Besnard, Philippe, Hanks, S., eds.: Proceed-ings of the 11th Conference on Uncertainty in Artificial Intelligence (UAI’95), San Francisco, CA, USA, Morgan Kaufmann Publishers (1995) 472–481
10. Krishnan, N., Cook, D.: Activity recognition on streaming sensor data. Pervasive and Mobile Computing (2012)
11. Ross, R., Kelleher, J.D.: Accuracy and timeliness in ml based activity recognition. In: Proceedings of AAAI Workshop on Plan, Activity, and Intent Recognition 2013 (PAIR 2013), Seattle, USA (2013)
12. Chen, C., Das, B., Cook, D.J.: A data mining framework for activity recognition in smart environments. In: Proceedings of the 2010 Sixth International Conference on Intelligent Environments. IE ’10, Washington, DC, USA, IEEE Computer Society (2010) 80–83
13. Das, B., Cook., D.: Data mining challenges in automated prompting systems. In: Workshop on Interacting with Smart Objects. (2011)
14. Stoia, L., Shockley, D.M., Byron, D.K., Fosler-Lussier, E.: Noun phrase generation for situated dialogs. In: Proceedings of the Fourth International Natural Lan-guage Generation Conference, Sydney, Australia, Association for Computational Linguistics (2006) 81–88
15. Cook, D., Schmitter-Edgecombe, M.: Assessing the quality of activities in a smart environment. Methods of Information in Medicine.48(2009) 480–485
16. Kipp, M.: ANVIL - a generic annotation tool for multimodal dialogue. In Dals-gaard, P., Lindberg, B., Benner, H., Tan, Z.H., eds.: INTERSPEECH, ISCA (2001) 1367–1370