This copy of the thesis has been supplied on condition that anyone who consults it is understood to recognise that its copyright rests with its author and that no quotation from the thesis and no information derived from it may be published without the author's prior consent.
ii
Transparent Authentication Utilising Gait
Recognition
By
Hind Khudhair Al-Obaidi
A thesis submitted to University of Plymouth in
partial fulfilment for the degree of
DOCTOR OF PHILOSOPHY
School of Engineering, Computing and Mathematics
September 2019
iii
COPYRIGHT STATEMENT
This copy of the thesis has been supplied on condition that anyone who consults it is understood to recognise that its copyright rests with its author and that no quotation from the thesis and no information derived from it may be published without the author’s prior consent.
iv
Acknowledgements
First and foremost, all praise and gratitude are due to Allah the All-Compassionate and All-Merciful for everything He has provided me throughout my life, in general, and for giving me the potential and patience to persevere and reach this stage of my PhD research, in particular. Without Him, I would not have achieved anything or even existed.
The work, and indeed this PhD, would not have been possible without the great help of my Director of Studies, Professor Nathan Clarke. Thanks go to him for his endless support and guidance throughout this amazing journey. Without his excellent scientific knowledge, encouragement and enthusiasm, this work would not be completed. Very deep and special thanks also go to my supervisor, Senior Lecturer Dr Fudong Li, who has spent a lot of time and efforts proofreading papers and my thesis, in addition to providing helpful advice throughout my studies. Many thanks to my supervisor, Associate Professor Dr Bogdan Ghita, for his insights and support. Moreover, I would like to thank all staff members in the Centre for Security, Communications and Network Research Group for their support. My sincere appreciation goes to the soul of my beloved parents and many thanks to my dear brother Muhammad who has always been supportive to me whenever I am in need and without any reservation. May Allah bless him.
My unreserved love, thanks and appreciation must go to my husband (Furat) and children (Danyah and Fahad) who have been very patient, understanding, and inspiring to me throughout this endeavour, spending days, nights, and sometimes even holidays without me. Hope that the potential success of this research will compensate some of what they have missed. May Allah bless them.
v
I would like to thank all my friends and colleagues, either in the UK or in Iraq, who have contributed positively towards my progress by any means even if it was just a smile. Many of them deserve mentioning, but it is difficult to state all the names. However, it is inevitable not to express my sincere thanks to my younger brother-like colleague Abdulrahman, for all kinds of support he has provided throughout my PhD journey. I wish them all success in all their current and future endeavours. Finally, I would like to acknowledge with thanks and appreciation the Ministry of Higher for Education and Scientific Research in Iraq and my employer, the University of Baghdad / College of Education for Pure Science – Ibn Al-Haitham / Computer Science Department.
vi
Author’s Declaration
At no time during the registration for the degree of Doctor of Philosophy has the author been registered for any other University award without the prior agreement of the Graduate Committee.
Work submitted for this research degree at the Plymouth University has not formed part of any other degree either at Plymouth University or at another establishment.
This study was financed with the aid of a scholarship from the government of Iraq. Relevant scientific seminars and conferences attended at which work was often presented, and several papers were published and prepared for publication in the course of this research project. Additional research skills development courses also attended.
1- Al-Obaidi, H. et al., 2018. A Multi-Algorithmic Approach for Gait Recognition.
In ECCWS 2018 17th European Conference on Cyber Warfare and Security
(p. 20). Academic Conferences and publishing limited.
https://researchportal.port.ac.uk/portal/files/11163228/A_multi_algorithmic_
approach_for_gait_recognition.pdf.
2- Alruban, A. et al., 2018. Human Activity Recognition for Healthcare using
Smartphones. In ICPRAM 2019 8th International Conference on Pattern
Recognition Applications and Methods, pp.20–21. DOI:
10.5220/0007271903420351.
Word count of the main body of thesis: 53,467 words
Signed.……… Date: 03/09/2019
vii
Abstract
Transparent Authentication Utilising Gait Recognition Hind Al-Obaidi (MSc)
Securing smartphones has increasingly become inevitable due to their massive popularity and significant storage and access to sensitive information. The gatekeeper of securing the device is authenticating the user. Amongst the many solutions proposed, gait recognition has been suggested to provide a reliable yet non-intrusive authentication approach – enabling both security and usability. While several studies exploring mobile-based gait recognition have taken place, studies have been mainly preliminary, with various methodological restrictions that have limited the number of participants, samples, and type of features; in addition, prior studies have depended on limited datasets, actual controlled experimental environments, and many activities. They suffered from the absence of real-world datasets, which lead to verify individuals incorrectly.
This thesis has sought to overcome these weaknesses and provide, a comprehensive evaluation, including an analysis of smartphone-based motion sensors (accelerometer and gyroscope), understanding the variability of feature vectors during differing activities across a multi-day collection involving 60 participants. This framed into two experiments involving five types of activities: standard, fast, with a bag, downstairs, and upstairs walking. The first experiment explores the classification performance in order to understand whether a single classifier or multi-algorithmic approach would provide a better level of performance. The second experiment investigated the feature vector (comprising of a possible 304 unique features) to understand how its composition affects performance and for a comparison a more particular set of the minimal features are involved. The controlled dataset achieved performance exceeded the prior
viii
work using same and cross day methodologies (e.g., for the regular walk activity, the best results EER of 0.70% and EER of 6.30% for the same and cross day scenarios respectively). Moreover, multi-algorithmic approach achieved significant improvement over the single classifier approach and thus a more practical approach to managing the problem of feature vector variability.
An Activity recognition model was applied to the real-life gait dataset containing a more significant number of gait samples employed from 44 users (7-10 days for each user). A human physical motion activity identification modelling was built to classify a given individual's activity signal into a predefined class belongs to. As such, the thesis implemented a novel real-world gait recognition system that recognises the subject utilising smartphone-based real-world dataset. It also investigates whether these authentication technologies can recognise the genuine user and rejecting an imposter. Real dataset experiment results are offered a promising level of security particularly when the majority voting techniques were applied. As well as, the proposed multi-algorithmic approach seems to be more reliable and tends to perform relatively well in practice on real live user data, an improved model employing multi-activity regarding the security and transparency of the system within a smartphone. Overall, results from the experimentation have shown an EER of 7.45% for a single classifier (All activities dataset). The multi-algorithmic approach achieved EERs of 5.31%, 6.43% and 5.87% for normal, fast and normal and fast walk respectively using both accelerometer and gyroscope-based features – showing a significant improvement over the single classifier approach. Ultimately, the evaluation of the smartphone-based, gait authentication system over a long period of time under realistic scenarios has revealed that it could provide a secured and appropriate activities identification and user authentication system.
ix
Contents
COPYRIGHT STATEMENT ... iii
Acknowledgements ... iv
Author’s Declaration ... vi
Abstract ... vii
1 The Need for Authentication ... 1
1.1 Introduction and overview ... 1
1.2 Research Aims and Objectives ... 8
1.3 Thesis Structure ... 8
2 Biometrics Authentication ... 11
2.1 Introduction ... 11
2.1.1 History of biometrics ... 12
2.1.2 Biometric system requirement ... 13
2.2 Classification Approaches... 17
2.2.1 Statistical ... 18
2.2.1.1 Dynamic Time Warning (DTW) Distances ... 18
2.2.2 Machine learning ... 18
2.2.2.1 Support-vector machines (SVM) ... 19
2.2.2.2 A classification tree or a decision tree ... 20
2.2.2.3 A hidden Markov model (HMM) ... 20
2.2.2.4 Nearest Neighbour ... 21
2.2.2.5 Neural Network multilayer perceptron (NN-MLP)... 21
2.3 Biometric system performance measurement factors ... 22
2.4 Biometric Techniques ... 24
2.4.1 Physiological Biometrics... 25
2.4.1.1 Fingerprint Recognition ... 25
x
2.4.1.3 Facial Recognition ... 29
2.4.1.4 Iris Recognition and Retina Recognition ... 30
2.4.1.5 Ear Geometry ... 32 2.4.2 Behavioural Biometrics ... 33 2.4.2.1 Voice Recognition ... 33 2.4.2.2 Signature Recognition ... 35 2.4.2.3 Keystroke Analysis ... 37 2.4.2.4 Behavioural Profiling ... 38
2.4.2.5 Biometric Gait Recognition ... 39
2.5 Summary of the Biometric Techniques ... 41
2.6 Conclusions ... 42
3 A Literature Review of Gait Recognition ... 44
3.1 Background of Biometric Gait Recognition ... 44
3.1.1 Gait collection methods ... 44
3.1.2 Machine Vision (video sensors) ... 44
3.1.2.1 Wearable sensors ... 45
3.1.2.2 Mobile-based sensors ... 46
3.1.3 Gait process approaches ... 47
3.1.3.1 Cycle-based Method ... 47
3.1.3.2 Segment-based Method ... 50
3.2 Review Methodology ... 52
3.3 Overview of Mobile-based Gait Authentication Related Work ... 53
3.4 Discussion ... 88 3.5 Conclusion ... 98 4 Research Methodologies ... 100 4.1 Introduction ... 100 4.2 Research Methodology ... 102 4.3 Technology Assessment ... 105 4.3.1 Preliminary Testing ... 108
xi
4.4 Control Conditions Experimental Methodology ... 110
4.4.1 Data Collection ... 112
4.4.1.1 Activity labelling ... 115
4.5 Uncontrolled Condition Experimental Methodology ... 116
4.5.1 Real-World Data Collection ... 118
4.5.2 Activity Identification ... 119
4.5.3 Activity-Based Recognition ... 120
4.5.4 Activities Identification Data Modelling ... 122
4.6 Signal pre-processing and Feature Exploration ... 127
4.6.1 Segmentation ... 128
4.6.2 Feature extraction ... 128
4.6.2.1 Time-domain features ... 129
4.6.2.2 Frequency domain features ... 130
4.6.3 Normalisation ... 131
4.6.4 Feature selection ... 132
4.6.5 Classification ... 132
4.7 Conclusion ... 134
5 Experimental Results of Exploring Classification Strategies ... 136
5.1 Introduction ... 136
5.2 Investigation of Feature Vector Composition ... 137
5.2.1 Investigating the Sensors and Feature Vectors ... 137
5.2.2 Investigation of the Feature Vector across Activities ... 147
5.2.3 Investigation Using the Feedforward Neural Network Classifier .. 163
5.2.4 Performance of the Neural Network Feedforward Classifier ... 165
5.4 Discussion ... 172
5.5 Conclusion ... 178
xii
6.1 Introduction ... 180
6.2 Activities Identification Results ... 181
6.3 Exploring More Discriminative Features for Different Real-World Activities 183 6.4 Real-World Gait Authentication and Multi-Algorithm Performance... 189
6.5 Applying Majority Voting ... 196
6.6 Discussion ... 202
6.7 Conclusion ... 208
7 Discussion ... 210
7.1 Introduction ... 210
7.2 Comparison with the Prior Art ... 211
7.2.1 Real-World Usability Performance ... 218
7.3 Proposed Context-Awareness Model ... 223
7.3.1 Data collection ... 225
7.3.2 Feature extraction ... 225
7.3.3 Classification and Decision Making ... 226
7.4 Gait Recognition Using Context Information ... 227
7.5 Conclusion ... 234
8 Conclusions and future work... 235
8.1 Contributions and Achievements of the Research ... 235
8.2 Limitations of research ... 237
8.3 Suggestions, Scope for future work ... 238
8.4 The Future of Authentication ... 239
xiii
Appendices ... 258
Appendix A- Publications ... 258
Appendix B- Consent Form and Information Sheet (Data Collection) ... 260
Appendix C- Top Ten Discriminative Features for each user in Fast walk ... 262
Appendix D- Top Ten Discriminative Features for each user in walking with a bag Activity 263 Appendix E- Top Ten Discriminative Features for each user in Down Stairs Activity 264 Appendix F- Top Ten Discriminative Features for each user in Upstairs Activity 265 Appendix G- Top Ten Discriminative Features for Each User in Fast Walking Activity 266 Appendix H- Top Ten Discriminative Features for Each User in Down Stairs Walking Activity ... 267
Appendix I- Top Ten Discriminative Features for Each User in Walking Upstairs Activity 268 Appendix J- Top Ten Discriminative Features for Each User in All Activities .. 269
xiv
List of Figures
Figure 2-1: The Components of a Biometrics System (Clarke 2011) ... 17
Figure 2-2: Classification approaches Taxonomy (Technology at Nineleaps, 2019) ... 19
Figure 2-3: Biometrics Performance Metrics Factors (Clarke 2011) ... 24
Figure 2-4: An example of fingerprint recognition (NEURO technology 2015) ... 25
Figure 2-5: Example Distance Measurements Source: (NSTC, 2006) ... 28
Figure 2-6: An example of facial recognition (GreekoSystem 2011) ... 30
Figure 2-7: An example of a human eye (NSTC 2006; Monitgomery, 2014)... 31
Figure 2-8: Images of Human Ears (da/sec. 2015) ... 33
Figure 2-9: Voice Recognition Platform (BiometricSolutions 2015) ... 35
Figure 2-10: Signature Recognition (Signing Hub 2016) ... 36
Figure 2-11: Illustrations of periodic motion of the legs (Hoang et al. 2013) ... 40
Figure 3-1: Background segmentation for extracting the silhouette picture (Bajrami 2011) ... 45
Figure 3-2: Different locations of the attached wearable sensor (Gafurov et al. 2007b; Gupta & Dallas 2014) ... 46
Figure 3-3: The three axes in which acceleration is measured and phone position when receiving data (Miguel & Neves 2013) ... 47
Figure 3-4: A complete gait cycle showing the eight gait phases (Miguel & Neves 2013) ... 47
Figure 3-5: Phone attached to the subject and the three axes in which acceleration measured (Derawi et al. 2010) ... 55
Figure 3-6: Sample data collected with the G1 from x, y and z directions ... 55
Figure 3-7: Gait Cycle Detection ... 56
Figure 3-8: Quorum voting scheme method (#V total segments of a probe gait signal, #Vg, number of votes for genuine, #GV positive classification results) (Nickel, et al. 2011b) ... 58
Figure 3-9: Acceleration plots for the (a) walking, (b) ascending, and (c) descending activities (Kwapisz et al. 2011) ... 62
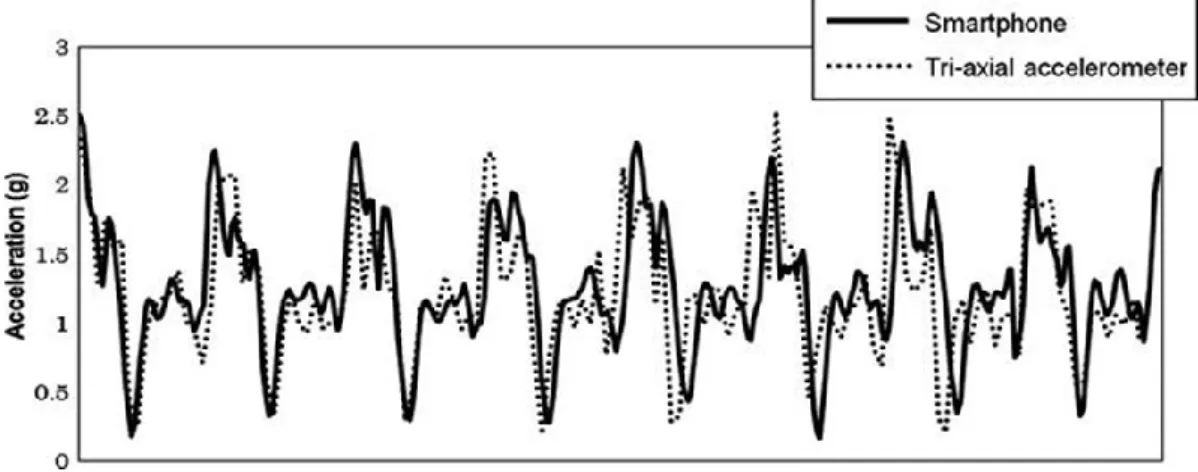
Figure 3-10: Acceleration waveforms of the smartphone and tri-axial accelerometer (Nishiguchi et al. 2012) ... 68
Figure 3-11: Flow control of cycle extraction steps, dashed arrow lines indicate optional steps (Muaaz & Nickel 2012)... 71
xv
Figure 3-12 the process of extracting BFCC features (Hestbek et al. 2012) ... 79
Figure 4-1: (a) and (b) show Sensor Tracker and AndroSensor, respectively.. 107
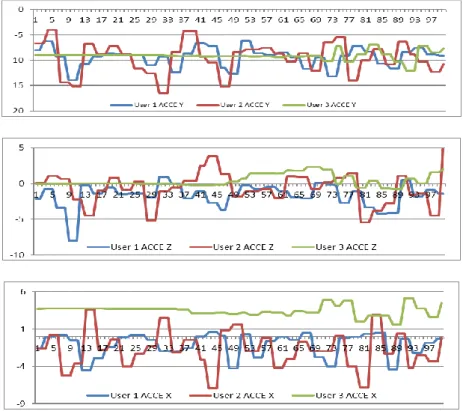
Figure 4-2: Illustrates the accelerometers X, Y and Z-axis signals of three users
... 108
Figure 4-3: Illustrates the gyroscopes X, Y and Z-axis signals of three users .. 109
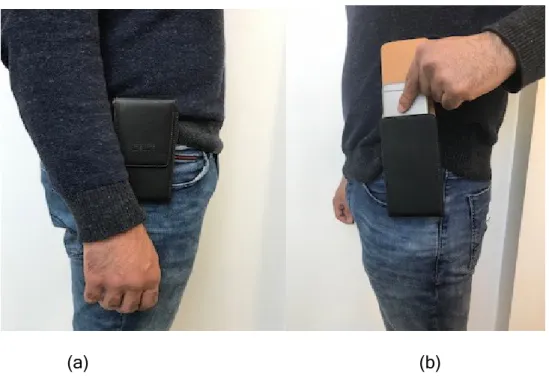
Figure 4-4: (a) and (b) the phone is placed in the right or left belt pouch and its orientation ... 112
Figure 4-5: The Accelerometer and gyroscope raw gait data recorded along X-axis ... 114
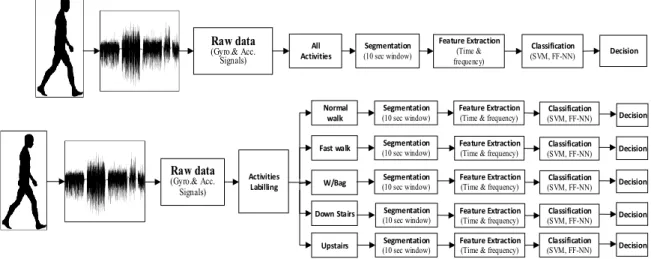
Figure 4-6: Authentication Process Systems. Each activity investigated individually then all users’ gait activities were treated as a single dataset ... 115
Figure 4-7: Activities Identification Model ... 123
Figure 4-8: Real-World gait data identification and recognition ... 125
Figure 5-1: The EER results on Accelerometer data for all activities by using SD scenarios ... 138
Figure 5-2: The EER results on Accelerometer data for all activities by using CD scenarios ... 139
Figure 5-3: The EER results on Gyroscope data for all activities by using SD . 141
Figure 5-4: The EER results on Gyroscope data for all activities by using CD 141
Figure 5-5: The EER results on Accelerometer and Gyroscope data for all activities by using SD and CD scenarios ... 143
Figure 5-6: The impact of using dynamic feature for all activities (same day scenario) ... 145
Figure 5-7: The Impact of using dynamic feature for all activities (cross day scenario) ... 145
Figure 5-8: Impact of the dynamic feature selection technique upon the performance, normal walking (same day scenario) ... 150
Figure 5-9: Impact of the dynamic feature selection technique upon the performance, normal walking (cross day scenario) ... 150
Figure 5-10: Impact of the dynamic feature selection technique upon the performance for fast walking(same day scenario) ... 151
Figure 5-11: Impact of the dynamic feature selection technique upon the performance for fast walking (cross day scenario) ... 151
Figure 5-12: Impact of the dynamic feature selection technique upon the performance for walking with a bag (same day scenario) ... 152
xvi
Figure 5-13: Impact of the dynamic feature selection technique upon the performance for walking with a bag (cross day scenario) ... 152
Figure 5-14: Impact of the dynamic feature selection technique upon the performance for down stairs (same day scenario) ... 153
Figure 5-15: Impact of the dynamic feature selection technique upon the performance for down stairs (cross day scenario) ... 153
Figure 5-16: Impact of the dynamic feature selection technique upon the performance for upstairs (same and cross day scenario) ... 154
Figure 5-17: Impact of the dynamic feature selection technique upon the performance for upstairs (cross day scenario) ... 154
Figure 5-18: (a) Acc (x-axis) covariance feature values for five users (13F) .... 162
Figure 5-19 Figure 5-20 ... 178
Figure 6-1: Normalised confusion matrix (%) of the soft voting model ... 183
Figure 6-2: (a) and (b) show User1’s profile signals for feature 243 and 89 from both the controlled and uncontrolled datasets ... 188
Figure 6-3 (a) and (b) show User1’s signals for feature 13 and 56 from both the controlled and uncontrolled datasets ... 188
Figure 6-4: The distribution of data points using a 2D plot from 243F and 89F 189
Figure 6-5: The EER (%) of individual performance for normal walking activity
... 194
Figure 6-6: The EER (%) of individual performance for all activities ... 195
Figure 6-7: Majority voting mean values using different numbers of data samples for multi-algorithm walking activities (10-second sample period) ... 198
Figure 6-8: Majority voting mean values using different numbers of data samples for single algorithm walking activities (10-second sample period) ... 198
Figure 6-9: Majority voting median values using different numbers of data samples for (a) normal walking, (b) fast walking. ... 199
Figure 6-10: Majority Voting Median Values Using Different Numbers of Data Samples for (a) Down Stairs, (b) Upstairs walking ... 199
Figure 6-11: Majority voting median values using different numbers of data samples for (a) normal and fast walking, (b) all walking activities ... 200
Figure 7-1: The average of daily gait activity time in minutes for all users ... 219
Figure 7-2: Context-awareness gait recognition model ... 225
Figure 7-3: Two days’ GPS tracking data and Google Maps direction for User1
xvii
Figure 7-4: Two days’ GPS tracking data and Google Maps direction for User 2
... 229
Figure 7-5: Four days’ GPS tracking data for User 1 ... 230
Figure 7-6: Six days’ GPS tracking data for User2 ... 231
Figure 7-7: Four days’ GPS tracking data for User3 ... 232
xviii
List of Tables
Table 2-1: shows the aforementioned biometric techniques transparency feature
... 41
Table 3-1: The number of returned references ... 53
Table 3-2: Surface and walking distances used in the experimental protocol (Sprager and Zazula 2011). ... 59
Table 3-3: A comparisons of results with and without PLA-based gait cycle extraction (Muaaz & Mayrhofer 2013) ... 73
Table 3-4 Evaluation of results with and without wavelet transforms (Hestbek et al. 2012) ... 79
Table 3-5 shows the evaluation of the essential facts of the SVMs, HMMs, and k-NN in the same database (Nickel et al. 2012) ... 81
Table 3-6 The stated results FAR (%) and FRR (%) for each holding state by using five algorithms (Watanabe 2014) ... 83
Table 3-7 Correctly classified rate (%) of states by four algorithms when a subject walked in nine different states (Watanabe 2015) ... 85
Table 3-8 (a) Improvements of segmentation based on gait cycles compared with a fixed length, (b) The influence of disorientation error to the effectiveness of classification mode ... 86
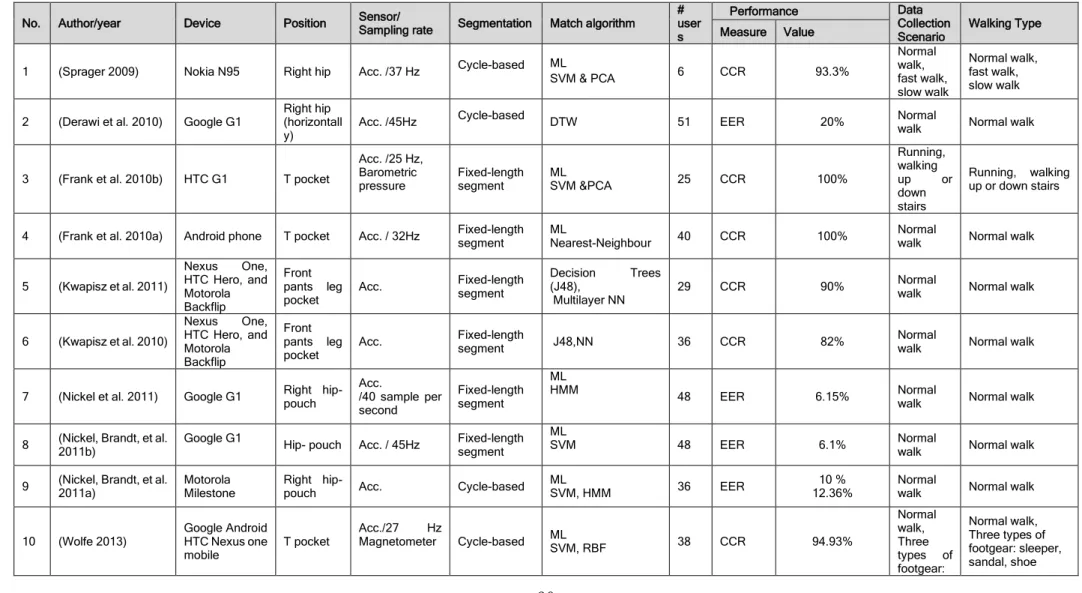
Table 3-9: Comprehensive analysis of the prior studies on gait authentication systems using mobile sensors. ... 90
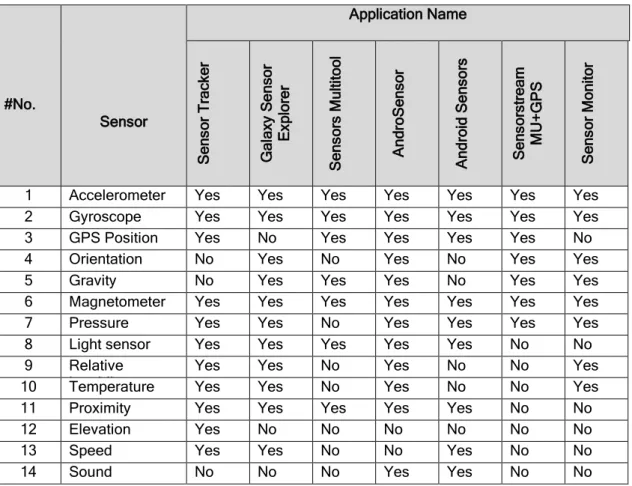
Table 4-1: The tested software with sensors that could be extracted by the smartphone... 106
Table 4-2: Age and gender distribution of participants ... 113
Table 4-3: Activity states for all users across two days ... 114
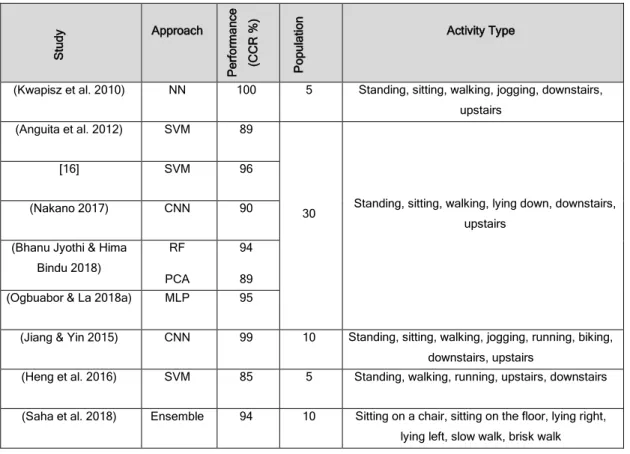
Table 4-4: Comparison of prior studies in activity recognition using smartphone sensors ... 122
Table 4-5: Activities states for each user for one week ... 126
Table 4-6: The overview of the unconstrained dataset ... 127
Table 4-7: Time domain features ... 130
xix
Table 5-1: System Performance Utilising Dynamic Feature Selection Technique
on Accelerometer Data ... 139
Table 5-2: System Performance Utilising Dynamic Feature Selection Technique on Gyroscope Data ... 142
Table 5-3: System Performance Utilising Dynamic Feature Selection Technique on Accelerometer and Gyroscope Data ... 143
Table 5-4: The Impact of Using Dynamic Feature for All activities (Same and Cross day) ... 145
Table 5-5: Accelerometer Features list (1-152) and Gyroscope Features list (153-304) ... 148
Table 5-6: A Comparison between Dynamic and Static features Techniques for Individual and All Activities (SD and CD scenarios) ... 155
Table 5-7: Top Ten Discriminative Features for each user in Normal walk ... 158
Table 5-8:A Comparison between Two Users Best Features Patterns ... 160
Table 5-9: Summary of the Top Repeated Features for Each Activity-Control Dataset ... 161
Table 5-10: Comparison between FF MLP and SVM performances (for similar feature vector set FN) ... 164
Table 5-11: The EER (%) of the SD test for the normal walking activity ... 166
Table 5-12: The EER (%) of the SD test for the fast walking activity ... 166
Table 5-13: The EER (%) of the SD test for the walking with a bag activity ... 167
Table 5-14: The EER (%) of the SD test for the walking down stairs ... 167
Table 5-15: The EER (%) of the SD test for the walking upstairs ... 167
Table 5-16: The EER (%) of the SD test for all activities... 168
Table 5-17: The EER (%) of the CD test for normal walking ... 169
Table 5-18: The EER (%) of the CD test for fast walking ... 170
Table 5-19: The EER (%) of the CD test for walking with a bag ... 170
Table 5-20: The EER (%) of the CD test for walking down stairs ... 171
Table 5-21: The EER (%) of the CD test for walking upstairs ... 171
Table 5-22: The EER (%) of the CD test for All Activities ... 172
Table 5-23: The positive impact of using dynamic features selection techniques on the system performance and the features used ratio ... 175
Table 6-1: Overall classification accuracy for each model ... 182
Table 6-2: Top ten discriminative features for each user in the normal and walking with a bag ... 185
xx
Table 6-3: A comparison between two users’ best feature patterns (real dataset)
... 186
Table 6-4: Summary of the top repeated features for each activity -real dataset ... 187
Table 6-5 and 6-6: The EER (%) of normal walking activity utilising different feature subsets ... 192
Table 6-7 and Table 6-8: The EER (%) of fast walking activity utilising different feature subset size ... 193
Table 6-9: The EER (%) of normal and fast walking activities utilising different feature subset size ... 193
Table 6-10: The best EER (%) for individual and all activities ... 194
Table 6-11: Majority voting results for each number of samples across all gait activities ... 202
Table 6-12: Top six ranked features (time between peaks) ... 205
Table 6-13: Number of features included in the repeated top-ten ... 205
Table 6-14: Individual performance for each activity ... 206
Table 6-15: System performance utilising the majority voting module ... 207
Table 7-1: A comparison between some common selected smartphone-based databases ... 212
Table 7-2: Percentage of identified real activities samples ... 220
Table 7-3: Comparing controlled and realistic system performance with and without using majority voting ... 221
1
1
The Need for Authentication
1.1
Introduction and overview
In the last decade, smartphone devices have become a ubiquitous technology, with more than 9.5 billion users globally (GSMA 2018). Currently, smartphones provide a wide range of services and features including (but not limited to): communication (e.g., texting, email, and calling), entertainment (e.g., internet-connected game consoles such as Xbox One and PS4, music, and online streaming), work (e.g., viewing clients’ documents), financial services (e.g., transferring money and shopping online), sensors (e.g., accelerometers, gyroscopes, magnetometers, rotation sensors, light sensors, and temperature sensors), accessing multiple networks (e.g., GPS, Wi-Fi, and Bluetooth), and location-based services (LBS) (i.e., identifying the location of a person or object, such as discovering the nearest banking cash machine automated teller machine (ATM)) (WebMapSolutions 2011). Further, with the explosive growth in the number of internet users worldwide reaching around 3.4 billion (40% of the world population) (Internet live stats 2016), mobile traffic is expected at a high acceleration of 150% per year (Meeker 2013), enabling more smartphone users to access internet services. Inevitably, these activities will be associated with personal, financial, medical, and business information that is sensitive and confidential; this means the data stored on smartphones could be more expensive than the cost of the device (Saevanee et al. 2015). As a result, smartphones should be kept secure at all times.
However, smartphones and their services and information are becoming targets of cybercrimes. For example, the UK government found that in 2012, there were,
2
on average, over 260 mobile phones being stolen across England, Scotland, and Wales daily (BBC NEWS 2012). Alarmingly, the number of smartphones being stolen each day increased to two thousand in 2014 within the UK (Mail Online News2014). Furthermore, 35% of (CSID 2017) survey respondents’ accounts or personal information were compromised or stolen by imposters. A study by Symantec Corporation (2013) showed that attacks increased by 42% with about 604,826 of accounts hacked, of which 23% was caused by theft or loss of smartphone devices. In addition, a report was published in 2016 depicting that data breach threats increase dramatically with the use of stolen, weak, and
default credentials, which represented 63% of data breach corpus (Verizon 2016).
Recently, a Home Office report revealed that mobile devices surged last year with over 700,000 handsets stolen. The study rated that the total number of stolen mobiles was more than double the 330,000 figure officially recorded by the police (MailOnline News, 2019). Moreover, (COMPUTERWORLD, 2019) reported that the incidence of smartphone theft has been increasing rapidly through recent years and is fast becoming an epidemic. Serious crimes in San Francisco from November to April recorded 579 thefts of mobile phones or tablets, and this represents 41 percent of all serious crimes. On some days, like Feb. 27, the only serious crimes stated in the daily police log were cell phone thefts.
As a result, it is mission-critical to secure smartphones and their services and information. To secure any system or information, it is essential that confidentiality, integrity, and availability (CIA) is achieved. Without implementing a proper authentication mechanism, it is difficult to achieve these aims. Three major approaches can be used for authentication: something the user knows (e.g., password or PIN), something the user has (e.g., token or smart card), and something the user is (i.e., biometrics). Some systems utilise a single approach
3
to achieve authentication while others combine two or more techniques in order to strengthen the authentication (Karatzouni 2014).
Current protection mechanisms of smartphone devices are usually based on the knowledge-based authentication technique (e.g., PIN, password, and graphical password) (Meng et al. 2015). However, the main disadvantages of this approach can be summarised in the following points:
•
Secrecy and public use; users log into various websites using passwordswhile they are in public places such as libraries or cafes. This leads to many password authentication issues. First, the password could be observed by other users by looking over the shoulder or looking at the keyboard and noting the keystrokes. Second, the password information could be intercepted by someone connected to the network while the user logs in using network programs that monitor the local Wi-Fi hotspot (itstillworks, 2019).
User Engagement; many people use common password tropes, such as
"password", "1234", or "pass" as passwords for sites they use. Also, the same password may be used for multiple sites. That means compromising one site will probably leading to compromising any other site that uses that password (itstillworks, 2019).
Security could be easily compromised. For instance, currently, individuals
have an average of 21 passwords to remember and 81% of them select common words as their passwords (Rana 2015).
A typical user may use several devices with approximately 13 accounts with
different usernames and passwords (Ghazizadeh et al. 2012). Surveys carried out by Cobb (2012) and CSID (2012) found that 46% and 61%, respectively, of their participants, used the same password for multiple
4
accounts to reduce the burden on memory to save and retrieve various passwords.
Furthermore, improper use may occur if users do not use the techniques in
the right way, such as never changing the PIN code, sharing it with friends, and writing it down. Indeed, 30% of users write their passwords down in an insecure manner (Rana 2015).
The weakness of point-of-entry techniques is documented extensively and is considered as a significant problem of the PIN approach. The user logs in once and gains access to all applications without the need to log in again to each of them or legitimise the user’s identity again after obtaining trust and private information (Crouse et al. 2013). Additionally, according to the present NIST guidelines for mobile security, there is no set form to lock the device automatically as long as the device has been used regardless of whether that person is authorised. They suggest locking the device after staying idle for a specific time (NIST 2014). Indeed, a lot of smartphones offer this functionality now; however, it is unknown whether users take the full advantage of it.
From the above limitations, these approaches suffer from the probability of lost, stolen, guessed, shared, forgotten, misplaced, eavesdropping, and repudiation. Also, 67% of mobile users leave their devices without password protection, so their personal information could be accessed by malicious individuals (Crouse et al. 2013).
In order to solve some password problems, token-based authentication could be used. Instead of the human brain, the secret-knowledge is placed in a memory chip. But they are high in cost and the user needs to carry multiple tokens to access many services, which is considered as inconvenient. Additionally, the
5
verification depends on the token itself rather than the individual (Clarke & Furnell 2005). Consequently, in token-based approaches, the user is primarily responsible for maintaining the security of the system (i.e., making sure the token is secure). When the token is lost or stolen, the system is compromised.
Various biometric modalities are currently used generally in order to improve system security. Additionally, biometrics have essential features that can be used to assess a specific link to the identity of the person concerned because biometrics use human physiological and behavioural characteristics to identify individuals. The main advantage of biometric-based approaches is that they cannot be easily stolen or forgotten, unlike passwords, PINs, and tokens (Rana 2015). In smartphone devices, fingerprint and face recognition are already used as an alternative authentication method in addition to the PIN. For example, Samsung Galaxy Note 8 and iPhone 8 and 8s devices provide biometric-based unlock style devices using the face and fingerprint, respectively (SKY BIOMETRY 2018).
However, the face and fingerprint are used to offer a point of entry authentication; hence, they cannot provide continuous protection for smartphones. Also, the high possibility of deceptive actions against biometric security implementations on smartphones could occur. Moreover, several factors may affect facial recognition algorithms, such as the stability of the extracted facial features over time, adjacent lighting, image resolution, face distance and position from the camera, and liveness test provisioning. Also, both fingerprints and facial recognition are intrusive and need user intervention, which could be considered inconvenient with recurrent use. Meeker (2013) pointed out that the smartphone user checks their devices on average 150 times per day. These users could spend over five minutes daily to unlock their devices (based on an average of two seconds for
6
every single unlock process). Besides, mobile devices are still susceptible to data theft when in an unlocked state (Crouse et al. 2013). Therefore, to improve security, more convenient, secure and effective biometric modalities are needed that operate transparently for mobile authentication to minimise user inconvenience and increase user acceptance and security (Rana 2015).
Transparent authentication provides security by “authenticating the user periodically throughout the day/session/use of the device in order to maintain confidence in the identity of the user” (Clarke & Furnell 2005). Transparent and continuous authentication is considered as non-intrusive, more secure, and places less encumbrance on the user. Moreover, the decision based on multiple sources/biometric modalities can provide better confidence in the authenticity of the user (Clarke 2011). Several studies have proposed advanced authentication mechanisms that can provide transparent and continuous authentication to the user by using behavioural biometrics. According to these studies, a number of biometrics could have the probability to be used for transparent authentication on mobile devices, including keystroke dynamics (Crouse et al. 2013; Saevanee et al. 2015), behavioural profiling (Clarke 2011), 3D-facial recognition (Muaaz 2013), Voice recognition (Clarke & Furnell 2005), linguistic profiling (Saevanee 2014), and gait recognition (Mohammad Omar Derawi et al. 2010; Nickel et al. 2011). While much effort has been expanded on conducting and implementing the existing behavioural biometric approaches, less focus has been given by researchers into using a smartphone device to collect realistic data for gait and activity recognition.
Gait recognition recognises a person by how they walk. Many studies in psychology, medicine (kale, 2003), and biometrics indicate that human gait is unique for every person, as well as non-invasive techniques that can be used for
7
identification and verification purposes (Gafurov, 2008; Mäntyjärvi et al., 2005). As a result, this approach has an excellent opportunity to be implemented in a continuous authentication manner (rather than user re-authentication), thus, decreasing the burden on the user and increasing the security. Currently, most smartphones and portable devices have built-in sensors (e.g., accelerometers) that can be used to record the user’s gait. Therefore, there is no need to attach further hardware to collect gait features (Rana 2015). By using gait recognition, the user does not need an explicit action for mobile authentication because the related data is continuously recorded while the person is walking (Derawi et al., 2010; Clarke, 2011; Zhong and Deng, 2014). During times when he is not walking, other biometric modalities can be used (Derawi et al.2010).
Moreover, gait recognition can be seen as an advantageous biometric identification technique for the following two reasons: (1) user-friendliness, because the gait of a person can be captured unobtrusively and continuously; and (2) security, because of the fact that the gait of an individual is challenging to mimic (Hoang et al. 2015). However, there are several challenges related to personal identification via gait recognition. Gait will be affected by several situations (1) stimulants, like drugs and alcohol; (2) physical changes, for example pregnancy, an accident or disease affecting a leg or foot, or severe weight gain/loss; (3) psychological changes, where the mood of a person influences his/her gait; (4) clothing, in particular, shoes (Derawi 2012); and the condition of the road surface (e.g., grass or concrete). Also, very few studies have used actual commercial smartphone devices to collect realistic data for gait and activity recognition. In addition, both the number of participants and the amount of data used in existing studies are somewhat limited. The use of real-world data is likely to result in far higher variability in the gait signature because of the variety
8
of situations in which a person might find themselves in (e.g., in a rush to a meeting, carrying luggage to an airport, running because of poor weather, exercising, to name but a few). As such, envisaging the context within which the user finds themselves will be an important factor to take into consideration in order to achieve good recognition performance in practice.
1.2
Research Aims and Objectives
The main aim of this research was to develop a Context Awareness Gait Recognition model that could adapt to different circumstances (e.g., changes in shoe, stress, or carrying a bag). To achieve this, the following research objectives were established:
To review the current state-of-the-art literature in gait authentication including mobile-based gait authentication.
To review the biometric authentication techniques including their
application in the current research on continuous and transparent authentication systems (TAS).
The study sought to investigate the performance of gait recognition across
a wider range of activities and participants.
To experimentally investigate the nature of gait features under more
realistic real-world scenarios and understand how well existing approaches would work.
To evaluate the developed system in order to determine the usability, functionality, and appropriateness of the approach.
1.3
Thesis Structure
9
Chapter Two reviews the biometric system from many perspectives, including its system components, requirements, techniques, performance measures, and standards for physical and behavioural biometrics with a view of examining its potential to be incorporated in the continuous and transparent authentication proposal.
Chapter Three provides a comprehensive literature review of the existing research on mobile-based gait authentication. The chapter concludes with a discussion section that scientifically identifies the gap that exists in the literature.
Chapter Four represents the data gathering and methodologies that were used to collect and categorise data and the method of preparing the data, the devices, and the software that were employed. The chapter then proceeds to describe the pre-processing, time, and frequency domains feature vector extraction and effective selection feature technique to support the experiments mentioned below.
Chapter Five provides a comprehensive evaluation at gait recognition, including an analysis of motion sensors (i.e., accelerometers and gyroscopes), an investigation and analysis of features, and an understanding of the variability of feature vectors during differing activities across a multi-day collection. Furthermore, it explores the impact of dynamic feature selection for each user to investigate their efficiency to reduce the feature vector size and enhance performance. Moreover, it implements the proposed multi-algorithmic approach and compares its performance with single algorithmic approach (i.e., a dataset treated as one activity).
Chapter Six builds upon the knowledge of Chapter Five to present a novel real-world gait authentication approach that manages the main research gap. This chapter will focus on providing the empirical basis for whether the proposed
10
approach could work — initially through exploring smartphone-based real-world data (rather than highly constrained control data) to understand the variability and difficulty in successfully authenticating individuals.
Chapter Seven discusses the main contributions of this study by comparing the research achievement with relevant studies that employed the mobile-based gait authentication. It also defines the development plan of the proposed context-awareness gait authentication model, including the processes of modelling. Chapter Eight is the final chapter presents the conclusions accomplished from the research and highlights the key achievements and limitations. It also contains a recommendation on future research and development of this research.
11
2
Biometrics Authentication
2.1
Introduction
Authentication is a cornerstone of information systems security and authorisation is a process of identifying legitimate users by an effective user authentication technique to prevent unauthorised access to personal or sensitive data. All approaches for human authentication rely on at least one of the following: something the person knows (secret knowledge-based approach, e.g., a password/PIN), something the person has (e.g., a smart card), or something the person is (i.e., biometrics) (Hocking 2014). In the first and second authentication approaches, maintaining the security of the system is dependent on the user. Hence, a lost or stolen token or shared password will compromise the system. Moreover, they have several vulnerabilities (Al Abdulwahid 2015), the (password/PIN and smart card) techniques suffer from many disadvantages, as mentioned previously. Therefore, the operational performance being achieved is highly correlated to the biometric software, which adds another level of security. But, it is not guaranteed that it is impervious to compromise (Clarke 2011).
The chapter presents background information about typical biometric system components and performance metrics used to evaluate such a system, based upon their physiological or behavioural characteristics. It also provides an overview of existing authentication approaches and devices to explore whether they solve some issues related to the research area. Finally, this chapter highlights some of the applicability of the biometric techniques in order to operate transparently.
12
2.1.1
History of biometrics
The word biometric comes from the Greek word (bio), which means life, combined with metrics, which means measures (McCabe 2005). The first signs of biometrics emerged in 500 B.C. when cavemen used their fingerprints to symbol their drawings (Babich, 2012). Babylonians behaved in the same way to sign business deals, which existed on clay tablets. Ancient Egypt is the birthplace of the first evidence of using biometric authentication ever seen by archaeologists. In that time, in order to summarise the process of providing food, the supervisor of the workers would record information about them, including their name, age, work unit, position, and occupation. Moreover, to avoid cheating, he was enforced to record more individual information/characteristics, such as physical and behavioural ones (Babich, 2012, Page 3).
Early biometric characteristics were simple; one of these is biometrics, inked paper allowed to yield palm prints that can acquiesce from inked paper, while children could be distinguished from each other by their footprints. According to the National Science and Technology Council (NSTC) (2006), in a study on the history of biometrics, the period between the end of the 19th century and the beginning of the 20th saw an acceleration in the use of fingerprint authentication. For instance, in 1892, Galton developed a classification system for fingerprints and, in 1896, Henry developed a fingerprint classification system. Then, in 1903, NY State Prisons began the use of fingerprints. More recently, the first model of acoustic speech production was created in 1960, when researchers drew attention to behavioural biometrics and then the behavioural components of speech were modelled for the first time in 1970. Also, a study on the compatibility of biometrics and a machine-readable travel document was launched in 1999. In
13
the same year, the Integrated Automated Fingerprint Identification System’s (FBI's IAFIS) major components became operational (NSTC, 2006).
The International Standard Organisation (ISO) and the International Electro technical Commission (IEC) (ISO/IEC 2012) defined biometrics as encompassing “counting, measuring and statistical analysis of any kind of data in the biological sciences including the relevant a biometric system that provides biometric technology using components from multiple vendors”. They also go further to describe biometric characteristics as the distinguishable, repeatable biometric features that can be extracted from an individual for the purpose of identification or verification. This characteristic can be either physiological or behavioural and can be achieved from any part of the individual. ISO-based biometrics should have a high level of performance of data interchange amongst applications and systems, which is an essential characteristic for implementing biometric systems (interoperability). Also, the dependability of utilising biometrics that support frustrate the spoofing and avoidance risks (reliability), alongside with the user-friendliness (usability) and security for future standards-based systems and applications. With better interoperability between biometrics systems, the success of these applications would be much more similar.
2.1.2
Biometric system requirement
Many essential biometric requirements are needed in order to select the best authentication approach to utilise. The suitability of the biometric authentication technique is specified according to the availability of the following requirements on the associated trait, as suggested by Jain et al. (2002):
14
Universality: which means that each person utilising the application should
have the chosen biometric feature. For example, as all users have fingers, it is possible to use the fingerprint as a biometric identifier.
Uniqueness: to distinguish people from one another, the specified trait should be befittingly different for persons’ relative application environment (e.g., the iris is much more unique than the fingerprint).
Permanence: shows the constancy of a biometric characteristic over time.
For example, while an individual’s retina remains stable for the entire life, people’s keystroke behaviour varies because of many factors, such as device, mood, and text familiarity.
Measurability: the ease of collection of a particular biometric trait by employing an appropriate device and how easy it is to extract the feature set from raw traits. For example, the retina needs a specific device and explicit user interactions. In comparison, a person’s walk can be collected unobtrusively and easily using standard devices.
Performance: refers to the recognition accuracy, robustness, and speed,
in addition to the appropriateness of the resources used to achieve that accuracy. For instance, individual retina screening is considered constant compared to the keystroke, which can differ because of the device, mode, or text experience.
Acceptability: this specifies how people are interested in using biometrics
as an authentication method in their lives. For example, confidentiality and suitability. Otherwise, they will avoid using it.
15
Circumvention: The possibility of imitating a trait and the degree of its vulnerability. For example, the iris scan is almost impossible to imitate and mimic in comparison to behaviour-based biometrics (e.g., keystroke dynamics).
As a result, a perfect biometric authentication system should meet all the requirements mentioned above. However, Jain et al. (2008) claimed there is no biometrics that will fit all the above seven characteristics. In practice, these requirements are varied depending on the specific needs and security of the application.
2.1.3 Verification and Identification
A biometric system could work in two modes, namely verification and identification. Verification is defined briefly by (Clarke 2011): "determining whether a person is who they claim to be”. Verification is also referred to as a one-to-one matching. The current captured biometric sample(s) of the claimed person compared with the stored template of the registered person. For example, an individual could access to his/her bank account at an ATM by using an iris scan or scanning a finger to confirm his/her work daily attendance (Jain et al., 2008). Both Jain et al. (2008) and Clarke (2011) pointed out that the biometric verification system is considered more reliable than the traditional systems that use token-based (e.g., ID card) and knowledge-based (e.g., password or PIN). In contrast, in identification mode, the comparison is one-to-many (i.e., explore whether the identity exists in the database). The current person’s biometric sample should be compared with all templates that are stored on the system database to decide if a match exists. Therefore, because of these additional complexities and computation, more time will be needed for the identification
16
mode. It is clear that identification requires a higher level of the system’s accuracy and feature uniqueness than verification. As physiological biometrics (e.g., fingerprint, facial recognition, iris and retina scan, and hand geometry) are more unique than behavioural biometrics (e.g., voice, gait recognition and keystroke dynamics), they tend to be more appropriate for identification.
2.1.4
Components of the Biometric System
To complete a biometric process, there are five incorporated components declared in Figure 2-1 (Clarke 2011):
Sample Capturing: This is the stage of collecting the biometric sample from
the genuine user utilising an appropriate capture device or method according to the biometric system (e.g., optical finger scanner for fingerprint recognition, webcam or mobile front camera for facial recognition, and mobile accelerometer sensor for gait recognition).
Feature Extraction: In this stage, distinctive features of the captured sample(s) are processed to generate a feature extraction template. For instance, after a gait signal is captured, many algorithms are executed to extract many unique features, like average resultant acceleration, binned distribution, and time between peaks for gait recognition.
Storage: the feature vector (reference template) that resulted from the feature extraction process is stored in the database. This stored template is used as a reference in the matching process.
Classification (matching): In the comparison phase, the individual's current
17
the enrolment phase. Consequently, a match score is given, indicating the degree of similarity.
Decision: in this stage, access is permitted or denied according to the comparable score value, which should be equal or more than the previously identified threshold; otherwise, access will be denied.
Figure 2-1: The Components of a Biometrics System (Clarke 2011)
2.2
Classification Approaches
This section provides a high-level description of some of the popular classification algorithms. There are two types of classification: Statistical modelling and Machine Learning. Firstly, a statistical model is a family of probability distributions. Basically, Statistical models use mathematical equations (Analytics Vidhya, 2015) by a formalisation of relationships between variables in the form of mathematical equations in order to find the relationship between variables to predict an outcome and applied for smaller data. On the other hand, machine learning is an application of artificial intelligence by learning from data without relying on explicitly programmed instructions (Jordan and Mitchell, 2015; Statistical Models, 2019).
18
2.2.1
Statistical
2.2.1.1 Dynamic Time Warning (DTW) Distances
Dynamic time warping (DTW) has been widely used for computing similarities between two temporal sequences in time series analysis even with various speeds. For example, similarities in walking could be identified using DTW, even if one person was walking faster than the other was or if there were accelerations and decelerations during the course of observation (Anantasech and Ratanamahatana, 2019).
2.2.2
Machine learning
The main objective of machine learning is to create systems that are able to learn automatically (Henrique, Sobreiro and Kimura, 2019). More specifically, machine learning teaches computers to do what comes naturally to humans by learning from experience and using computational methods to “learn” information directly from data without relying on a predetermined equation as a model. However, the types of machine learning algorithms might differ in their approach, the type of data they input and output, and the type of task or problem that they are intended to solve. Machine learning can be divided into two subdomains: supervised learning and unsupervised learning, as shown in Figure 2-2. Supervised learning requires training with labelled data, which has inputs and desired outputs. There are two types of supervised learning, namely: classification (discrete output variable) and regression (continuous output variable). On the other hand, with unsupervised learning, there is no need for labelled training data and inputs are provided without desired targets, such as the clustering approach, by allocating to groups without class information (Qiu et al., 2016). In the literature, support-vector machines (SVM) and neural networks are considered as the most commonly used models for prediction (Henrique, Sobreiro and Kimura, 2019).
19
Figure 2-2: Classification approaches Taxonomy (Technology at Nineleaps, 2019)
2.2.2.1 Support-vector machines (SVM)
Support-vector machines are supervised machine-learning algorithms that can be used with learning algorithms by analysing the data used in order to solve classification and regression problems (Tavara, 2019). In SVM, there are two phases: training and testing.
SVM is training by specifying a set of training examples to one or the other of two classes, and an SVM training algorithm builds a model that allocates new samples to one category. These algorithms can efficiently perform a linear and non-linear classification. In addition to performing linear classification, SVMs can efficiently perform a non-linear classification using what is called the kernel trick, implicitly mapping their inputs into high-dimensional feature spaces. The kernel methods are a sort of algorithm for pattern analysis, known as the best member, the support vector machine (SVM) (Barber, 2012; Technology at Nineleaps, 2019). After the engine is trained, the SVM model predicts which class label a new unseen test sample should have in the testing phase (Tavara, 2019).
20
2.2.2.2 A classification tree or a decision tree
For building classification models in the real world, the decision tree is one of the more widely used methods because of its simplicity and ease of interpretation (Kim, 2016). Each interior node corresponds to one of the input variables and is split into child nodes based on the values of the input variable. Each leaf or terminal node represents the particular value of a target variable—for example, the specific class of a categorical variable for the classification problem and the specific real value of a continuous variable for regression problems. During the classification tree learning process, samples at each interior node are split into subsets based on an attribute, and this process is repeated on each derived subset in a recursive manner called “recursive partitioning”. The recursion is finished when a subset at a node has the same target value, when splitting does not improve prediction, or when splitting is impossible because of user-defined constraints (Kim, 2016). Generally, decision trees are used in operations research or statistical probability analysis, especially in decision analysis, to help identify a most probable strategy to reach a goal, but are also a popular tool in supervised machine learning (Pao, 2005).
2.2.2.3 A hidden Markov model (HMM)
A Markov chain is a stochastic model explaining a sequence of probable situations in which the possibility of each situation depends only on the state achieved in the prior situation. In a hidden Markov model, there are unobserved or “hidden” states while all states are apparent to the observer in a standard Markov chain. In comparison with the Markov chain, the hidden Markov model aims to predict the future state of the variable utilising probabilities based on the present and previous state. The variability between a Markov chain and the hidden Markov model is that the state in the final is not directly noticeable to an
21
observer, even though the output is. Many machine learning and data mining tasks have been effectively applied to problems including speech, handwriting, optical character and gesture recognition (Franzese and Iuliano, 2019; Techopedia, 2019).
2.2.2.4 Nearest Neighbour
The nearest neighbour (KNN) algorithm is the simplest classification algorithm and one of the popular learning algorithms (Altman, 1992). KNN is a non-parametric, lazy learning algorithm. Non-parametric means it does not make any expectations on the fundamental data distribution and the data usually used to structure the model. The KNN algorithm stores all presented cases and classification procedures based on a similarity measure (e.g., distance functions). The distance function is used by the distance metric, which provides a relationship metric between each element in the dataset. It should be suitable with real-world data when the data mostly does not obey the classic theoretical expectations made (e.g., linear regression models). Therefore, KNN has been used in statistical estimation and pattern recognition and could be more suitable when there is limited or no preceding knowledge about the distribution data.
2.2.2.5 Neural Network multilayer perceptron (NN-MLP)
Artificial neural networks (ANN) are based on a collection of connected units or nodes called artificial neurons. Each connection can transfer a signal from one artificial neuron to another. In addition, there is pattern recognition, feature mapping, clustering, and classification examples of applications of neural networks (Han et al., 2016; Techopedia, 2019). In this approach, the neural network consists of units (neurons) arranged in layers, which convert an input vector into some output. Each unit takes an input, applies an (often nonlinear) function to it, and then authorises the output on the next layer. Mostly, the
22
networks are identified to be feed-forward: a unit supplies its output to all the units on the next layer; however, no feedback will be transmitted to the previous layer. Weightings are implemented to the signals feed-forwarding among layers, and it is the same weightings that are matched in the training stage to adapt a neural network to the particular problem at hand. This is the learning phase. Multilayer perceptron (MLP) is the most used model in neural network applications using the back-propagation training algorithm (Ramchoun et al., 2016). In this approach, the neural network creates a set of outputs from a set of inputs. An MLP is categorised by several layers of input nodes linked as a directed graph between the input and output layers. As there are multiple layers of neurons, MLP is a deep learning technique (Data Science Bootcamp, 2019).
2.3
Biometric system performance measurement factors
Having highlighted that, all biometrics work is based on the result of comparing the individual’s current sample (probe template) and the reference template. Two essential error rates reflect the performance of the template matching process: the false acceptance rate or false match rate (FAR or FMR) and the false rejection rate or false non-match rate (FRR or FNMR). Woodward (2003) identifies these error rates as follows:
FAR: It measures the percentage of biometric technique errors when the
imposter is falsely accepted.
FRR: It measures the rate of biometric technique errors when genuine
individuals are incorrectly rejected.
23
FAR = accepted imposter attempts
total imposter users attempts∗ 100%
FAR = rejected genuine attempts
total genuine users attempts∗ 100%
As highlighted by Clarke and Furnell (2005), in case of legalising a person’s identity, it is an unlikely situation to get a perfect 100% match between two samples of an individual’s biometric trait because of various issues, such as environmental noise and trait variability. As a result, the security level of a biometric system is based on a pre-set threshold value for the biometric system, which controls the acceptable degree of similarity. The system designer should balance the security of biometric systems and their user's suitability by setting the threshold tightness. As shown in Figure 2-3 , these two-performance metrics (i.e., FAR and FRR) are inversely proportional: as one rate decreases the other increases. A system with tight security can be achieved by increasing the threshold value, which may result in more genuine users being denied access (i.e., high FRR); also increasing the protection will minimise the potential of obtaining access for unauthorised users (i.e., low FAR). In addition to FAR and FRR metrics, a third error rate named the equal error rate (EER) is a measure of where the FAR and FRR curves intersect (i.e., FAR equals FRR) and is frequently used to evaluate and compare the performance of biometric systems (Clarke & Furnell 2005; Jain et al. 2002).
24
False Rejection Rate (FRR) False Acceptance Rate (FAR)
Equal Error Rate (EER) 100 Rate (%) 0 Slack Threshold Setting Increasing User Rejection
Tight
Increasing Security
Figure 2-3: Biometrics Performance Metrics Factors (Clarke 2011)
In addition to FAR, FRR, and EER, other metrics are frequently used when testing and evaluating biometric systems. For example, Clarke (2011) defined two rates as follows: The failure to acquire (FTA) represents the rate at which the creation of a valid template is incapable in the capture or extraction stage; on the other hand, the failure to enrol (FTE) effectively means the rate at which the user cannot enter into the system. They measure the error rates that probably happen during the enrolment stage. It usually results when there are inappropriate user features and samples to be used to create a template. For instance, when the system is unable to capture the user’s sample(s) affected by an equipment problem.
2.4
Biometric Techniques
Biometric techniques are classified into two main groups based on the environment of the deployed discriminative attribute. The physiological and behavioural details of these two types are described below.
25
2.4.1 Physiological Biometrics
Physiological biometric approaches aim at distinguishing an individual based on specific physical characteristics, such as the fingerprint and the face, which tend to be invariant and thus applicable to be utilised for both identification and verification (NSTC, 2006).
2.4.1.1 Fingerprint Recognition
Fingerprint identification is the oldest and most widespread, well known, deployed and used a biometric feature for authentication on many systems, such as securing laptops and mobile phones (Clarke 2011). It refers to the automated process of identifying or confirming identity-based on the comparison of two fingerprints (as shown in Figure 2-4). The reasons for it being so popular are the ease of achievement, conventional use and acceptance when compared to other biometrics, and the fact that there are numerous sources (i.e., ten fingers) for biometric data.
26
There are three basic outlines of fingerprint points, which are (BiometricSolutions 2015):
The arch: a pattern where the ridge reaches one side of the finger, then increases in the centre, creating an arch, and exits on the other side of the finger.
The loop: Loops are a highly familiar pattern in fingerprints; the ridge arrives
on one side of the finger, then creates a curve and exits on the same side of the finger from which it entered.
The whorl: the pattern when ridges form a circle around a central point.
Minutiae mean specific points in a fingerprint, and it is the slight details in a fingerprint that is of the highest importance for fingerprint recognition (biometric-solutions.com, 2015).
There are four main types of fingerprint reader hardware:
Optical reader: is a digital camera that obtains a visual image of the fingerprint. They start at low prices, but dirty or marked fingers impact the readings. This type of reader is easier to fool than other types.
Capacitive reader (CMOS readers): it uses an electrical current to form an
image of the fingerprint; they are more expensive than optical readers. A significant advantage, they require a real fingerprint shape rather than only a visual image. This makes CMOS readers harder to trick.
Ultrasound readers: they use high-frequency sound effects to access the
outer layer of the skin. They read on the dermal skin layer, which removes the need for a clean, unharmed surface. All other readers acquire an image
27
of the outer surface, therefore requiring hands to be cleaned and free of scars before read-out.
Thermal readers’ sensor: on a contacting exterior, there is a variance of temperature between fingerprint ridges and valleys. Thermal fingerprint readers have disadvantages such as higher power consumption and performance that depends on the environmental temperature.
After developing a fingerprint image using the reader hardware, it must be interpreted. Then it is handled in such a way that read-outs can be efficiently related and matched agains