Quarterly Journal of Economics and Economic Policy Volume 13 Issue 3 September 2018
p-ISSN 1689-765X, e-ISSN 2353-3293
www.economic-policy.pl
ORIGINAL PAPER
Citation: Hudáková, M., & Dvorský, J. (2018). Assessing the risks and their sources in
dependence on the rate of implementing the risk management process in the SMEs.
Equilib-rium. Quarterly Journal of Economics and Economic Policy, 13(3), 543–567. doi:
10.24136/eq.2018.027
Contact to corresponding author: [email protected]; University of Zilina, Facul-ty of SecuriFacul-ty Engineering, Department of Crisis Management, Univerzitna 8215/1, Zilina, Slovakia.
Received: 9 May 2018; Revised: 19 July 2018; Accepted: 2 August 2018
Mária Hudáková University of Zilina, Slovakia Ján Dvorský
Tomas Bata University in Zlín, Czech Republic
Assessing the risks and their sources in dependence on the rate of implementing the risk management process in the SMEs
JEL Classification: M21; G32; L52; L26
Keywords: risk, risk source; risk management; risk assessment; small and medium-sized enterprise (SME)
Abstract
Research background: The managers have a key position in process of management risk.
The managers are able to implement the risk management process in the companies with an emphasis on preventing the company crises using the appropriate methods and tools for the early identification of the changes if the entrepreneurial environment develops negatively. Does a manager have enough knowledge and awareness about the potential risk sources in company?
Purpose of the article: The essence of this article is to assess the sources of the market,
economic, financial, operational, HR, security and legal risk depending on the rate of im-plementing the risk management process in the small and medium-sized enterprises (SMEs).
Methods: We realized the risk assessment process on the basis of evaluations by 487
man-agers who gave their opinions to selected risks and their sources in the SMEs in Slovakia. Subsequently, we utilized the methods and tools of the mathematical statistics (descriptive statistics, comparison, Z-score for 2 population proportions, Chi-squared test for 5 x 2 con-tingency table).
Findings & Value added: The strongest dependence perceived by the SME-entrepreneurs
lies between the development of the tax and insurance burdens as the source of the econom-ic risk and the criterion of the “level of the risk management in the company”. The overall results of the empirical research underline the significance and importance of dealing with the assessment of the key risks and their sources in the Slovak SMEs. The results having been processed are the basic material for the professional public and other organizations whose effort is to help the companies in an effective implementation of the risk management process in the Slovak enterprises.
Introduction
The current dynamic changes of the entrepreneurial environment, many failures and bankruptcies of the renowned companies, as well as the global financial crisis, have significantly changed the view of the risk management in the companies all over the world. More and more companies, and not only the large ones, begin to realise the need and importance of the risk management (Hudáková & Lusková, 2016; Meluzín et al., 2017; 2018a; 2018b). The managers are under an increased pressure and have to make important decisions to ensure prosperity, financial stability, and competi-tiveness in the conditions of uncertainty and risk (Agarwal & Ansell, 2016). The studies published abroad (Global risk management survey, 2018; The
American Institute of CPAs, 2017; Enterprise risk management initiative,
2017) document the positive influences of the risk management on making decisions in the environment of the risks, on the quality of the information provided, on increasing the company value, on ensuring its competitive-ness, on achieving constant improvements and on the prevention in the framework of ensuring a continuous operation of the enterprise. Significant global investors have a similar opinion, and say they have no aversion against the risk, but they feel aversion towards surprises and, therefore, require a larger transparency of the companies concerning the risk man-agement (Bogodistov & Wohlgemuth, 2017; Cettolin et al., 2017). They are sure that the reliable risk management ensures fewer negative surprises, a larger financial stability of the companies and it provides opportunities to achieve profits. According to the aforementioned investigations, the com-panies worldwide attempt (Global risk management survey, 2018; The
American Institute of CPAs, 2017; Global Management Accountant - Glob-al State of Enterprise Risk Oversight, 2017) to implement the risk
man-agement to the planning and decision-making process, i.e. they systemati-cally consider the possible risks when making decisions. They link the risk strategy with the company strategic planning and inform the top manage-ment about the most serious risks.
Due to implementing the risk management in the companies mentioned in this article this problem area is very acute and highly necessary. Its so-lution will bring a significant benefit in the area of increasing the perfor-mance efficiency and competitiveness of the enterprises in the framework of the dynamic changes of the external and internal environment. The knowledge of the key risks and implementation of the risk management in the companies is also an opportunity to increase the performance efficiency or to achieve costs savings. Investments in prevention will bring savings of the financial costs compared with the expenses for solving the subsequenc-es of the negative events. Therefore, it is necsubsequenc-essary to improve the aware-ness and to inform the managers about managing risks in the enterprises worldwide, and in Slovakia as well (Sira et al., 2016; Hudáková et al., 2017). It is important for company managers to be able to identify the most serious risks, to create a space for discussions and to implement the whole risk management system in the companies with an emphasis on preventing the company crises (Brachert et al., 2017).
The aim of this article is to assess the sources of the market, economic, financial, operational, HR, security and legal risk in dependence on the rate of implementing the risk management process in the SMEs.
Empirical research was realized through questionnaire at base 487 of managers in the business environment of Slovakia. The data set was col-lected in the year 2018. The statistical hypotheses were verified using Chi-square tests and Z-score.
The paper is structured as follows. Section 2 briefly introduces the risk management process, the importance managers of companies. Section 3 introduces literature review of the key risks and their sources in business environment. Section 4 describes the empirical background, i.e. aim of the article, methodology of data collection, formulate statistical hypotheses and methods. Section 5 presents and discusses the main and important empirical results. Section 6 compares the findings of the paper with the findings of other authors. Section 7 proposes a new methodology (nine steps) of man-agement risk process. In the concussion, the limits of research and the fu-ture research of authors are presented.
Literature review
An integrated approach to risk management across all company depart-ments (processes) is becoming a global trend in the area of the risk man-agement implementation (Fraser & Simkins, 2016; Gates et al., 2012). It increases the successfulness of the risk management in the enterprise, the
number of correct decisions, but it also increases the probability of achiev-ing the company goals. The research results of various global organisations, e.g. the US institution ERM (Enterprise Risk Management) Initiative NC in collaboration with the Chartered Global Management Accountant publish a report about the global situation and control of the risk management from the point of view of the trends and opportunities for improvements (Enter-prise risk management initiative, 2017). The report of the Global State of Enterprise Risk Oversight declares the results about the current state of implementing the risk management in the SMEs globally. The results con-firm an increased interest in the risk management in the SMEs and a posi-tive perception of the risk management as a way of influencing the strategic success of the enterprise. The companies worldwide face similar risks, however, the perception of the risk on individual continents is different, e.g. (Global Management Accountant – Global State of Enterprise Risk
Over-sight, 2017; Enterprise risk management initiative, 2017):
− Approximately one-third of the companies in Europe, Asia, Australia, Africa and the Middle East believe their company risk management is implemented appropriately, compared to America with 24%.
− Approximately 60% of the companies in Europe, Asia, Australia, Africa and the Middle East are able to describe their company risk manage-ment from the point of view of the process, compared to America with only 29%.
− Less than 30% of the enterprises worldwide think they will acquire a competitive advantage through implementing the risk management process.
− In 70% of the companies in Europe, Asia, Australia, Africa and the Middle East the top management has the duty to check the risks, com-pared to America with only 46%.
− Only 20% of the enterprises have implemented the integrated approach to the company risk management.
− 80% of the companies do not invest in training of their managers in the area of the risk management.
Another global trend in the area of the risk management (Global risk management survey, 2018) is the fact that the companies centralise the tasks and processes of the risk management into one department and create special teams of managers from individual departments whose goal is to manage the risks. The research of The American Institute of CPAs shows the companies consider the centralised departments and the main risk man-agers to be a value added for the strategic decisions (The American Insti-tute of CPAs, 2017).
In spite of the fact that the interest of the companies in implementing the risk management increases and the benefit of the risk management is visi-ble, there are still shortages in introducing the risk management processes. This can be proved by the results of international studies, e.g. Report on the Current State of Enterprise Risk Oversight: Update on Trends and Oppor-tunities (2015) worked out by the US institution ERM (Enterprise Risk Management) Initiative NC, in collaboration with the American institution CPAs (Certified Public Accountants). The key findings of this study are as follows (Enterprise risk management initiative, 2017; Global risk
manage-ment survey, 2018). The state of the company risk managemanage-ment:
− 59% of the companies think the extent and complicatedness of the risks have changed significantly during last five years. This is valid for com-panies of all sizes and types.
− Only 25% of the companies believe they have implemented the risk management system. This result does not differ from the last year result, and it indicates that no significant changes regarding the system func-tionality were realised.
− Only 23% of the enterprise say their risk management implementation is effective and at a sufficient level.
− 58% of the companies claim the risk management process is not consid-ered a strategic tool which provides any competitive advantage.
− 45% of the enterprises have created a special management team that deals with the risk management in the whole company and meets once per quarter.
− 42% of the companies believe that the implementation of the risk man-agement is an important competitive tool in further progress of the en-terprise.
− 42% of the companies believe there are not sufficient resources of the enterprise determined for the company risk management system.
− 60% of the companies do not provide any training and consultancy in the risk management area.
Other global investigations realised e.g. by the FERMA organisation (European Risk and Insurance Report) confirm that, in spite of the fact the company risk management is not a new discipline, the current risk man-agement models are not flexible enough to take into account the dynamics of the market (FERMA, 2017). The barriers that hamper the companies to manage the risks effectively concern the problems of the information avail-ability necessary for assessing and managing the risks. They are missing support in the process of the early risk identification and the company top management do not provide sufficient training or consultancy in the area of the risk management.
There are various institutions for supporting the implementation of the risk management in practice in many countries. Their objective is to dis-seminate the information about the risk management and to improve the risk management’s position in the enterprises, to provide support during educational and research projects, to support the position of the risk man-ager and to enforce this position in the companies. The most important organisation of this kind is the Federation of European Risk Management Associations — FERMA with the seat in Brussels. FERMA associates 20 European countries; however, Slovakia has not entered this organisation yet. Other institutions are, e.g. Institute of Risk Management (IRM), Enter-prise Risk Management Academy, EnterEnter-prise Risk Management Imitative NC State University, The Risk Management Association, Philadelphia, etc. (FERMA, 2017).
Based on the information acquired from the global investigations, we can say the situation in the field of the risk management implementation in the area of Eastern Europe, in the Czech Republic and Slovakia, is not posi-tive.
According to several authors, dealing with this area the companies are missing an overall framework of the risk management which is not suffi-ciently linked and works without any connection with the company strate-gy. It faces problems of defining the contents, taking responsibilities for the risks, and the stating of the criteria are also missing — i.e. the tolerance of the risk, the insufficient orientation on identifying the root causes of the risks, etc. The financial crisis of 2008–2009 aroused great interest in the risk management in the Slovak enterprises, and strengthened the position and tasks of managing the risks by the financial managers, however, not to such an extent as in other European countries (Hudáková & Lusková, 2016).
The companies in the Czech Republic and Slovakia neither recognise exactly the risks and opportunities of the processes nor their real target key risk indicators. According to several experts who are dealing with this area (Hudáková et al., 2017; Havko et al., 2016; Sira et al., 2016; Cepel et al., 2018), the managers implement a dangerous tendency of an exaggerated confidence that all problems, when they appear, will be solved on time and without any big losses. In some enterprises, the risk management is only part of emergencies and unexpected events. A possible reason for this can be the fact the companies utilise the risk management too late, at the mo-ment when the problems arise and then they solve the consequences and not the prevention. This situation is caused especially by the approach of the managers to the risks, underestimating the company risks, missing knowledge and practical experience with implementing the risk
manage-ment process. We can find various methodological procedures for assessing and managing the risks for the key company areas e.g. for hazardous opera-tions or the financial risk management, etc. in Slovakia (Hudáková et al., 2017). However, the managers are missing practical instructions on how to implement the risk management process effectively. As it has been
al-ready mentioned, there is no organisation or association which would
directly help the companies with implementing the risk management in Slovakia. In Slovakia, we have recently not realised any research which would cover the whole country and provide relevant data about the current state of the risk management in the enterprises.
Research methodology
The objective of this article is to identify the most serious risks and their sources based on the realised research in the SMEs in Slovakia. To analyse and evaluate the risks based on the criteria “level of the risk management in the company” and “the level of providing space for discussions about the key company risks” using selected methods and tools of the mathematical statistics. The processed results will show the importance and needs of the managers to identify the most serious risks and to implement the risk man-agement process in the SMEs with an emphasis on the company crises.
The authors consider the market (Zimon, 2017; Kristoufek, 2018), eco-nomic (Carr et al., 2017), financial (Ključnikov et al., 2017), operational (McNulty & Akhigbe, 2017), personnel (Kozlova et al., 2016), security (Mayadunne & Park, 2016) and legal risks (Li & Moosa, 2015; Jones & Lubinski, 2012) to be the most important risks which negatively affect the entrepreneurial environment. The authors think there are differences be-tween entrepreneurs in perceiving the intensity of the selected risk sources.
The authors selected research criteria (K):
− K1: our company deals with the risk management — yes (K11), no
(K12);
− K2: our company creates a space for discussing the key risks — yes
(K21), no (K22).
The research criterion K1 was created for detecting the implementation state of the risk management in the company. The research criterion K2 was created for detecting whether the company provides any space for dis-cussing the key risks.
The entrepreneurs could give their opinion to the risk sources which af-fect the company intensively — a very low intensity of the risk source (V1 — Likert scale); a low intensity of the risk source (V2); a medium intensity
of the risk source (V3); a high intensity of the risk source (V4) and a very high intensity of the risk source (V5). The sources (causes) of the selected risks are for:
− The market risk (R1): losing the customers (11); strong competition in
the line of business (R12); stagnation of the market (R13); unreliability of the suppliers (R14);
− The economic risk (R2): development of the tax and insurance burden
(R21); weak availability of the financial resources (loans, foundations) (R22), development of the interest rates (R23); growing prices of all types of energy (R24);
− The financial risk (R3): insufficient company profit (R31); indebtedness
of the company (high share of the foreign capital) (R32); unpaid receiv-ables (R33); inability to pay obligations (insolvency) (R34);
− The operational risks (R4): insufficient utilisation of the production
capacities (R41); obsolete production facilities (R42); low rate of inno-vations (R43); increasing amount of claims (R44);
− The HR risks (R5): high fluctuation rate of the employees (R51);
insuf-ficient qualification of the employees (R52); errors of the employees (industrial injuries) (R53); decrease of the working morale and disci-pline (R54);
− The safety risks (R6): accidents and external threats (floods, fire, ...)
(R61); misusing information (R62); low protection (occupational health and safety at work) (R63); criminal offences against property laws (R64);
− The legal risks (R7): low enforcement of the law (R71); frequent
chang-es of the legal regulations (R72); low independence of the courts (R73); a long time period until the lawsuit is solved (R74).
To fulfill the main task of the article, we formulated the following statis-tical hypotheses:
H1_A: The unreliability of the suppliers is the most important source of the
market risk. H1_B: There are statistically significant differences in evaluat-ing the market risk sources between selected groups of entrepreneurs ac-cording to the criteria.
H2_A: The development of the interest rates is the most important source
of the economic risk. H2_B: There are statistically significant differences in evaluating the economic risk sources between selected groups of entrepre-neurs according to the criteria.
H3_A: The insufficient company profit is the most important source of the
financial risk. H3_B: There are statistically significant differences in eval-uating the financial risk sources between selected groups of entrepreneurs according to the criteria.
H4_A: The low rate of innovations is the most important source of the
op-erational risk. H4_B: There are statistically significant differences in eval-uating the operational risk sources between selected groups of entrepre-neurs according to the criteria.
H5_A: The insufficient qualification of the employees is the most important
source of the HR risk. H5_B: There are statistically significant differences in evaluating the HR risk sources between selected groups of entrepreneurs according to the criteria.
H6_A: The criminal offences against property laws is the most important
source of the safety risk. H6_B: There are statistically significant differ-ences in evaluating the safety risk sources between selected groups of en-trepreneurs according to the criteria.
H7_A: The low enforcement of the law is the most important source of the
legal risk. H7_B: There are statistically significant differences in evaluat-ing the legal risk sources between selected groups of entrepreneurs accord-ing to the criteria.
Through the method of random selection (using the mathematical func-tion “Randbetween”), we chose 1,500 companies from the CRIBIS data-base (datadata-base of companies, organisations, and self-employed persons) of the Slovak Republic. In the framework of the VEGA project, we addressed SMEs through an e-mail. Subsequently, the entrepreneurs were contacted by phone and asked to fill in a questionnaire. The questionnaire was created and made available to the respondents in an electronic form to the follow-ing line: https://docs.google.com/forms/d/e/1FAIpQLScj2PF20p0a522vR ww20Tya_6JMx71nHF8lj4-fBVH4M87FuA/viewform?usp=sf_link. The questionnaire included 26 questions aimed at evaluating the selected risks and their sources by the entrepreneurs. The questions were to be considered to be of key importance. The data collection was carried out from Septem-ber 2017 to January 2018. The successfulness reached the level of 32.4% (487/1,500). Altogether 13 questions (50% of the questionnaire) were as-sessed for creating this article.
To fulfill the main goal of this article and to evaluate the statistical hy-potheses in the first step we utilised the tools of the descriptive statistics (tables, description characteristics — absolute and relative frequency). De-scriptive characteristics are needed to calculate Z-score. To determine the descriptive statistics of the selected risk sources according to the selected criteria we utilized the simple classification method (Belas et al., 2018), the classification method according to the statistical signs. During assessing the basic respondent structure, we aimed at the relative frequency. Another utilised method was the dependence between the qualitatively possible statistical signs (contingency table, contingency intensity). The intensity of contingency was measured by using the Pearson´s Contingency Coefficient — its basis is the quadratic contingency. The Pearson´s Contingency Coef-ficient (p-value) achieves the value of 0 when both signs are independent (Mirkin, 2001; Tsai et al., 2008). When the dependence is complete, it is close to 1 (Lancaster & Hamdan, 1964). The aforementioned Pearson´s Contingency Coefficient was utilised for making decisions about the statis-tical significance of the respondents according to the criterion selected. The boundary between accepting and rejecting the statistical hypothesis was stated by the level of significance a p-value of 0.05 (Godfrey, 2005). When the calculated p-value was lower than the level of significance 0.05, then the structure of the entrepreneurs´ evaluations was significant. For as-sessing the Z-score parameters we utilised the p-value of the standardised normal classification (Balcaen & Ooghe, 2006; Altman et al., 2017). The conditions for realising the Z-test (normal distribution of the statistical sign and a large extent of the selection file) were fulfilled. The calculations were carried out by the freely available software SPSS Statistics (Lazányi et al., 2017).
The entrepreneurs from the Slovak business environment were chosen on the basis of demographic characteristics (gender, age, education) and the companies on the basis of selected criteria (region, number of employees, a line of business, how many years they have been doing business).
The structure of the entrepreneurs´ characteristics who filled in the ques-tionnaire was as follows: male businessmen — 325 (66.8%); female entre-preneurs — 162 (33.2%); the age up to 30 years — 99 (20.3%); from 31 to 50 years — 269 (55.2%); over 50 years — 119 (24.5%); the achieved edu-cation — secondary school without the school-leaving exam — 58 (11.9%); secondary school with the school-leaving exam — 257 (52.8%); university graduates — 172 (35.3%).
The selected characteristics of the companies:
− the region where the entrepreneur is doing business: the Žilina region — 315 (64.7%); another region in Slovakia — 142 (35.3%);
− the number of employees: a micro-company (to 10 employees) — 315 (64.5%); a small company (to 50 employees) — 115 (23.6%); a medi-um-sized company (to 250 employees) — 58 (11.9%);
− the line of business: trade — 118 (24.2%); services — 86 (17.7%); in-dustry — 72 (14.8%), building inin-dustry — 59 (12.1%), catering — lodging 42 (8.6%), transport — providing information — 31 (6.4%) and lines of business — 79 (16.2%);
− how long the entrepreneurs have been doing business: more than 10 years — 250 (51.3%), from 5 to 10 years — 126 (25.9%), from 1 to 5 years — 93 (19.1%) and shorter than 1 year — 18 (3.7%).
Results
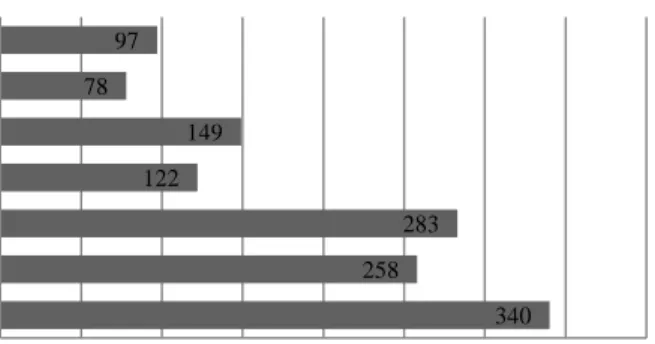
The entrepreneurs were to choose three key risks they consider to be the key ones for their business. The following figure (see Fig. 1) shows the absolute frequency of entrepreneurs who chose one risk as one of three key risks.
The achieved results (see Fig. 1) of the empirical research for determin-ing the importance of the significance for the SMEs (beginndetermin-ing with the most important risk): the market risk 69.8% (340/487 — the total number of respondents), the financial risk 58.1% (283/487), the economic risk 53.0% (258/487), the HR risk 30.6% (149/487), the operational risk 25.1% (122/487), the legal risk 20% (97/487) and the security and safety risk 16.1% (78/487).
The criteria assessment by the entrepreneurs: K1 — our company deals with the risk management: yes — (K11) 254 businessmen (52.2%), no (K12) 233 businessmen (47.8); K2 — our company creates a space for discussing the key risks — yes (K21) 274 businessmen (56.3%), no (K22) 213 businessmen (43.7%).
The following tables 1, 2, 3, 4, 5, 6 and 7 summarize the results of the analysis and the assessment of the key risks´ sources (the market, econom-ic, financial, operational, HR, security and safety and legal ones) according to the selected criteria. The authors consider it important to investigate the differences in the values of the risk sources — the answers bring a high intensity of the risk source (V4) and a very high intensity of the risk source (V5).
The most significant source of the market risk (see Table 1) is strong competition in the line of business (the answers V4 + V5) (233 entrepre-neurs).
The next items of the market risk source are: losing the customers (228); unreliability of the suppliers (94) and stagnation of the market (91). We reject the hypothesis H1_A. There are no statistically significant differ-ences in evaluating the market risk sources according to the criteria (com-pany deals with the risk management and creates a space for discussing the key risks) (see also Table 8_R1). We reject the hypothesis H1_B.
The most significant source of the economic risk (see Table 2) is devel-opment of the tax and insurance burden (the answers V4 + V5) (232 entre-preneurs). The next items of the economic risk source are: growing prices of all types of energy (183); weak availability of the financial resources (loans, foundations) (106) and development of the interest rates (95). We reject the hypothesis H2_A. There are no statistically significant differ-ences in evaluating the economic risk sources according to the criteria (company deals with the risk management and creates a space for discuss-ing the key risks) (see also Table 8_R2). We reject the hypothesis H2_B.
The most significant source of the financial risk (see Table 3) is insuffi-cient company profit (the answers V4 + V5) (162 entrepreneurs). The next items of the financial risk source are: unpaid receivables (122); inability to pay obligations (insolvency) (89) and indebtedness of the company (high share of the foreign capital) (78). We accept the hypothesis H3_A. There are statistically significant differences in evaluating the unpaid receivables according to the criteria (company deals with the risk management and creates a space for discussing the key risks) (see also Table 8_R3). We partially accept the hypothesis H3_B.
The most significant source of operational risk (see Table 4) is low rate of innovations (the answers V4 + V5) (64 entrepreneurs). The next items of the operational risk source are: obsolete production facilities (57); increasing amount of claims (55) and insufficient utilization of the production capacities (41). We accept the hypothesis H4_A. There are no statistically significant differences in evaluating the operational risk sources according to the criteria (company deals with the risk management and creates a space for discussing the key risks) (see also Table 8_R4). We reject the hypothesis H4_B.
The most significant source of the HR risk (see Table 5) is insufficient qualification of the employees (the answers V4 + V5) (102 entrepreneurs). The next items of the HR risk source are: high fluctuation rate of the em-ployees (99); decrease of the working morale and discipline (81) and errors of the employees (industrial injuries) (65). We accept the hypothesis H5_A.
There are no statistically significant differences in evaluating the HR risk sources according to the criteria (company deals with the risk management and creates a space for discussing the key risks) (see also Table 8_R5). We reject the hypothesis H5_B.
The most significant source of the safety risk (see table 6) is misusing information (the answers V4 + V5) (70 entrepreneurs). The next items of the safety risk source are: criminal offences against property laws (68); accidents and external threats (floods, fire, ...) (61) and low protection (occupation-al health and safety at work) (50). We reject the hypothesis H6_A. There are statistically significant differences in evaluating the mis-using information according to the criteria (company deals with the risk management and creates a space for discussing the key risks) (see also Ta-ble 8_R6). We partially accept the hypothesis H6_B.
The most significant source of the legal risk (see Table 7) is a long time period until the lawsuit is solved (the answers V4 + V5) (191 entrepre-neurs). The next items of the legal risk source are: frequent changes of the legal regulations (153); low enforcement of the law (141) and low inde-pendence of the courts (129). We reject the hypothesis H7_A. There are statistically significant differences in evaluating the low enforcement of the law and a long time period until the lawsuit is solved according to the crite-ria (company deals with the risk management and creates a space for dis-cussing the key risks) (see also Table 8_R7). We partially accept the hy-pothesis H2_B.
The following table (see table 8) summarizes the overall results of the tests comparing the evaluations of the company managers who denoted very high or high intensity of performing the source of the key risk (R1, ..., R7).
Discussion
The results of the empirical research showed that the market, financial, and economic risks are three most important risks that negatively perform in SMEs´ business environment. The most significant source of the market risk is the strong competition in the line of business where the company works. The unpaid receivables are the most significant source for the finan-cial risk. The development of the tax and insurance burden is the most sig-nificant source for the financial risk. The strongest dependence the SME entrepreneurs perceive was found between the development of the tax and insurance burden as a source of the economic risk and the criterion the “levels of the risk management in the company”. Further dependences were
detected also in connection with another criterion assessed, i.e. the space in the company for discussing the key risks — the same source of the eco-nomic risk. The results also show discrepancies for the source of the legal risk: the low enforcement of law and a long time period of solving the law-suits. The company managers whose companies implemented the risk man-agement process perceive these aforementioned sources more intensively.
Further results of the realised research show that 52.2% of all addressed companies are currently trying to implement the risk management process. These results are in contradiction with the global results of investigations (Global Management Accountant — Global State of Enterprise Risk
Over-sight, 2017; Enterprise risk management initiative, 2017) which say that
only 25 % of the companies have implemented the risk management. 56.3% of the SME managers say they create a space for discussing the key risks in the companies. The results of our research are two-times higher than the results of the investigation (Global Management Accountant —
Global State of Enterprise Risk Oversight, 2017; Enterprise risk manage-ment initiative, 2017) — they say that only 27% of companies provide time
and create a space for discussing the key risks at regular meetings. The possible explanation of these results may lie in the fact that the managers or owners of the SMEs in Slovakia consider the risk management to be al-ready the management of the market and financial risks. However, the companies abroad consider the implementation of the risk management process to be only the complex management of all the key risks in the en-terprise. Another reason can be the missing knowledge and real practical experience of the managers in implementing the risk management process. This leads to a situation the SME managers in Slovakia incline not to admit a negative situation than to prepare for it and they delude that their compa-ny is working according to the stated rules.
Application
Based on the obtained results, the authors propose the following methodol-ogy, which is formed by the risk management standard ISO 31000:2009 Risk Management — Principles and guidelines which provides only a gen-eral and universal character. The proposed application of the risk manage-ment methodology in the Slovak enterprises provides more specific guid-ance for the implementation of the risk management in the enterprises. The methodology consists of the following nine steps (Hudáková et al., 2017):
1. Establish strategy, policies, and responsibility for the risk management.
to have sufficient support from the top management. It is very important that the management of the enterprises are interested in prevention. The enterprise strategy has to be clear even before the implementation of the enterprise risk management.
2. Analyze the environment and establish risk criteria. It is necessary to
elaborate on the analysis of the internal and external business environ-ment so that the managers can define strategic and organizational con-nections with the risk management. The managers should define risk criteria (e.g. determine risk capacity and risk appetite).
3. Identify risks and risk resources. It is necessary to identify the risks and
risk resources. The risks should be recognized and described. The man-agers should ensure regular monitoring of all ongoing external and in-ternal events affecting the achievement of objectives. It is necessary to distinguish the positive impact (opportunities) or negative effects (threats).
4. Risk analysis. It is necessary to elaborate on the analysis of the
identi-fied risks based on the probability of the occurrence together with the impact. The conjunction of the probability of the occurrence and the im-pact form the risk level which determines the risk priority i.e. to which extent risks may affect the aims of the company.
5. Risk assessment and establishing risk catalogue. It is necessary to
com-pare the probability of occurrence and the consequences with defined criteria mentioned in the second step. The responsible managers should decide what the priorities are for dealing with the risks and which ac-tions should be carried out.
6. Develop and implement a plan for preventive measures. It is necessary
to propose preventive measures to the reduce risks. This is to ensure un-acceptable risks by the intended tactics. The un-acceptable risk should be monitored, because of the eventual future changes in the level of the identified risks.
7. Evaluate the effectiveness of the preventive measures and risk
manage-ment. It is necessary to make a review of the whole risk management
process. It should be provided with communication, advice, and report-ing. The managers should ensure the control of the identified risks and the proposed measures from the perspective of continuous improve-ment.
8. Ensure monitoring of risks. The next step in the application of the
enter-prise risk management is providing an early warning system for contin-uous monitoring of key processes in the enterprise.
9. Take a positive attitude to risks. The final step in the application of the
within a business culture that will lead the managers to a positive atti-tude to the risk and the prevention in the enterprise.
The appropriate risk management is a continuous and never-ending en-terprise activity. All above-introduced steps of the risk management could be modified during the time because of the external and internal environmental changes. The approach to the enterprise risk management has to be systematic. The methodology can be used for different types of businesses and it assumes rational application and adaptation of the risk management to specific conditions in the enterprises.
Conclusions
The most important (key) risks are: the market risk (68.9%), the financial risk (58.1%) and the economic risk (53%). The structure of managers´ an-swers is statistically significant for all sources of the market, economic, financial, operational, HR, safety and legal risk. The research criteria (company deals with the risk management and creates a space for discuss-ing the key risks) have an influence on evaluatdiscuss-ing of sources of the finan-cial, safety and legal risk.
The effort of the authors is to make gradual steps to enforce the imple-mentation of the risk management process in the Slovak enterprises for the managers to be able to manage the risks and for them to get closer to the global trends. The results achieved will be compared with similar investiga-tions on the international level, e.g. with the universities in the Czech Re-public, Finland, Poland, Serbia and other international organisations, e.g. ISO/TC 262.
Despite of our awareness of the certain limits to our research (e. g. re-gional character of the study, only two statistical methods as Chi-square test and Z-score), we believe that our article has brought several interesting findings and new incentives for the further research and discussion regard-ing assessregard-ing the selected risks in the SMEs, their sources and possibilities for the improvement the risk management process.
It is worth to concentrate our future research on the comparison of eval-uation of the risks and their sources with other countries the Visegrad groups. The authors would like to cooperate with researchers these coun-tries because the authors believe that the risks and their sources differently influencing the quality of the business environment in this countries.
References
Agarwal, R., & Ansell, J. (2016). Strategic change in enterprise risk management. Strategic Change-briefings in Entrepreneurial Finance, 25(4). doi: 10.1002/ jsc.2072.
Altman, E. I., Iwanicz-Drozdowska, M., Laitinen, E. K., & Suvas, A. (2017). Fi-nancial distress prediction in an international context: a review and empirical analysis of altman's Z-score model. Journal of International Financial Man-agement and Accounting, 28(2). doi: 10.1111/jifm.12053.
Balcaen, S., & Ooghe, H. (2006). 35 years of studies on business failure: an overview of the classic statistical methodologies and their related problems. British Accounting Review, 38(1). doi: 10.1016/j.bar.2005.09.001. Celep, M., Stasiukynas, A., Kotaskova, A., & Dvorsky, J. (2018). Business
environment quality index in the SME segment. Journal of Competitiveness, 10(2). doi: 10.7441/joc.2018.02.02.
Belas, J., Smrcka, L., Gavurova, B., & Dvorsky, J. (2018). The impact of social and economic factors in the credit risk management of SME. Technological and Economic Development of Economy, 24(3). doi: 10.3846/tede.2018.1968. Bogodistov, Y., & Wohlgemuth, V. (2017). Enterprise risk management: a
capabil-ity-based perspective. Journal of Risk Finance, 18(3). doi: 10.1108/JRF-10-2016-0131.
Brachert, M., Hyll, W., & Titze, M. (2017). On the simultaneity bias in the rela-tionship between risk attitudes, entry into entrepreneurship and entrepreneurial survival, Applied Economics Letters, 24(7). doi: 10.1080/13504851.2016.1203 056.
Carr, J. B., Hawkins, C. V., & Westberg, D. E. (2017). An exploration of collabo-ration risk in joint ventures: perceptions of risk by local economic development officials. Economic Development Quarterly, 31(3). doi: 10.1177/08912424177 10325.
Cettolin, E., Riedl, A., & Tran, G. (2017). Giving in the face of risk. Journal of Risk and Uncertainty, 55(2-3). doi: 10.1007/s11166-017-9270-2.
Enterprise risk management initiative. North Carolina State University´s ERM Initiative (2017). Report on the current state of enterprise risk oversight: update
on trends and opportunities 2015. Retrieved form
http://erm.ncsu.edu/library/article/current-state-erm-2015 (08.02.2018).
FERMA (2017). European risk and insurance report. Executive eummary of the FERMA, risk management benchmarking survey. Retrieved form http://www.ferma.eu/risk-management/.
Fraser, J. R. S., & Simkins, B. J. (2016). The challenges of and solutions for im-plementing enterprise risk management. Business Horizons, 59(6). doi: 10.1016/j.bushor.2016.06.007.
Gates, S., Nicolas, J. L., & Walker, P. L. (2012). Enterprise risk management: a process for enhanced management and improved performance. Management Accounting Quarterly, 13(3).
Global management accountant – global state of enterprise risk oversight (2017). Retrieved form http://erm.ncsu.edu/library/research-report/cgma-report-on-the-global-state-of-enterprise-risk-oversight.
Global risk management survey. Operating in the new normal: increased regulation and heightened expectations (2018). Retrieved form https://www2.deloitte.com /content/dam/Deloitte/ru/Documents/financial-services/ru-global-risk-managem ent-survey-9th-edition.pdf.
Godfrey, L. G. (2005). Controlling the overall significance level of a battery of
least squares diagnostic tests. Oxford Bulletin of Economics and
tics, 67(2). doi: 10.1111/j.1468-0084.2004.00119.x.
Havko, J., Klucka, J., & Haviernikova, K. (2016). Risk management in cluster´s cooperation in Slovak republic. In 3rd international multidisciplinary scientific conference on social sciences and arts. Albena.
Hudáková, M., Dvorský, J., Lusková, M., & Schönfeld, J. (2017). The market risk analysis and methodology of its more effective management in SMEs in the Slovak Republic. Montenegrin Journal of Economics, 13(2). doi: 10.14254/ 1800-5845/2017.13-2.10.
Hudáková, M., & Lusková, M. (2016). Global environment impacts on enterprise risk management. In Globalization and its socio-economic consequences: 16th international scientific conference. Zilina: ZU - University of Zilina.
Jones, G., & Lubinski, C. (2012). Managing political risk in global business: Beiersdorf 1914-1990. Enterprise and Society, 13(1). doi: 10.1093/es/khr051. Ključnikov, A., Kozubíková, L., Sopková, G. (2017). The payment discipline of
small and medium-sized enterprises. Journal of Competitiveness, 9(2), doi: 10.7441/joc.2017.02.04.
Kozlova, O., Makarova, M., & Mingaleva, Z. (2016). Corporative social responsibility as a factor of reducing the occupational health risk of personnel. International Journal of Applied Business and Economic Research, 14(14).
Kristoufek, L. (2018). Fractality in market risk structure: Dow Jones industrial components case. Chaos, Solitons and Fractals, 110. doi: doi: 10.1016/j.chaos. 2018.02.028.
Lancaster, H. O., & Hamdan, M. A. (1964). Estimation of the correlation coefficient in contingency tables with possibly nonmetrical charac-ters. Psychometrika, 29(4). doi: 10.1007/BF02289604.
Lazányi, K., Virglerová, Z., Dvorský, J., & Dapkus, R. (2017). An analysis of factors related to “taking risks”, according to selected socio-demographic fac-tors. Acta Polytechnica Hungarica, 14(7). doi: 10.12700/APH.14.7.2017.7.3. Li, L., & Moosa, I. (2015). Operational risk, the legal system and governance
indi-cators: a country-level analysis. Applied Economics, 47(20). doi: 10.1016/j. ijpe.2016.09.018.
Mayadunne, S., & Park, S. (2016). An economic model to evaluate information security investment of risk-taking small and medium enterprises. International Journal of Production Economics, 182. doi: 10.1016/j.ijpe.2016.09.018.
McNulty, J. E., & Akhigbe, A. (2017). What do a bank's legal expenses reveal about its internal controls and operational risk? Journal of Financial Stability, 30. doi: 10.1016/j.jfs.2016.10.001.
Meluzín, T., Pietrzak, M. B., Balcerzak, A. P., Zinecker, M., Doubravský, K., & Dohnal, M. (2017). Rumours related to political instability and their impact on IPOs: the use of qualitative modeling with incomplete knowledge. Polish Jour-nal of Management Studies, 16 (2). doi: 10.17512/pjms.2017.16.2.15.
Meluzín, T., Balcerzak, A. P., Pietrzak, M. B., Zinecker, M., & Doubravský, K. (2018a). The impact of rumours related to political and macroeconomic uncer-tainty on IPO success: evidence from a qualitative model. Transformations in Business & Economics, 17 2(44).
Meluzín, T., Zinecker, M., Balcerzak, A. P., Doubravský, K., Pietrzak, M. B., & Dohnal, M. (2018b). The timing of initial public offerings – non-numerical model based on qualitative trends. Journal of Business Economics and Man-agement, 19(1). doi: 10.3846/jbem.2018.1539.
Mirkin, B. (2001). Eleven ways to look at the chi-squared coefficient for contingency tables. American Statistician, 55(2). doi: 10.1198/0003130017 50358428.
Sira, E., Vozarova Kravcakova, I., & Radvanska, K. (2016). Using of risk management at small and medium-sized companies in the Slovak Republic. Economic annals-XXI, 156(1-2). doi: 10.21003/ea.V156-0016.
The American Institute of CPAs (Certified_Public_Accountants) (2017). Retrieved form http://www.aicpa.org/Pages/default.aspx.
Tsai, C., Lee, C., & Yang, W. (2008). A discretization algorithm based on class-attribute contingency coefficient. Information Sciences, 178(3). doi: 10.1016/j .ins.2007.09.004.
Zimon, D. (2017). The influence of quality management systems for improvement of logistics supply in Poland. Oeconomia Copernicana, 8(4). doi: 10.24136/oc. v8i4.39.
Acknowledgements
The publication of this paper was supported by the Scientific Grant Agency of the Ministry of Education, Science, Research, and Sport of the Slovak Republic – VE-GA No. 1/0560/16: “Risk Management of Small and Medium Sized Enterprises in Slovakia as Prevention of Company Crises”. The project KEGA No. 030ŽU-4/2018 “Research of Risk Management in Enterprises in Slovakia to create a new study program Risk Management for the FBI University of Zilina”. Academic Alliance of Grant Agency 1/2018 “A comparison of the preferences of university students between the Czech Republic and Slovakia in their professional life and propensity to entrepreneurship”.
Table 1. The evaluation of sources of market risk by entrepreneurs R11 K11 K12 K21 K22 R12 K11 K12 K21 K22 V1 27 26 28 25 V1 16 8 15 9 V2 42 47 45 44 V2 28 39 34 33 V3 71 56 76 51 V3 86 77 95 68 V4 64 56 68 52 V4 96 67 98 65 V5 50 48 57 41 V5 28 42 32 38 V4+V5 [%] 114 44.9 104 44.6 125 45.6 93 43.7 V4+V5 [%] 124 48.8 109 46.8 130 47.4 103 48.4 Sum 254 233 274 213 Sum 254 233 274 213 Chi-square 1.743 2.242 Chi-square 12.046 5.630 P- value 0.782 0.691 P- value 0.017 0.228 R13 K11 K12 K21 K22 R14 K11 K12 K21 K22 V1 35 33 37 31 V1 66 61 74 53 V2 58 52 64 46 V2 80 79 88 71 V3 111 107 124 94 V3 58 49 60 47 V4 33 28 30 31 V4 37 33 38 32 V5 17 13 19 11 V5 13 11 14 10 V4+V5 [%] 50 19.7 41 17.6 49 17.9 42 19.7 V4+V5 [%] 50 19.7 44 18.8 52 19.0 42 19.7 Sum 254 233 274 213 Sum 254 233 274 213 Chi-square 0.498 2.146 Chi-square 0.451 0.416 P- value 0.973 0.708 P- value 0.978 0.981 Notes: R11, R12, R13, R14 – sources of market risk, V1, V2, V3, V4, V5 – evaluation of source of risk, K11, K12, K13, K14 – criteria.
Table 2. The evaluation of sources of economic risk by entrepreneurs
R21 K11 K12 K21 K22 R22 K11 K12 K21 K22 V1 7 25 10 22 V1 37 31 42 26 V2 36 36 44 28 V2 80 62 84 58 V3 85 66 92 59 V3 87 84 89 82 V4 75 55 88 42 V4 28 40 36 32 V5 51 51 40 62 V5 22 16 23 15 V4+V5 [%] 126 49.6 106 45.5 128 46.7 104 48.8 V4+V5 [%] 50 19.7 56 24.0 59 21.5 47 22.1 Sum 254 233 274 213 Sum 254 233 274 213 Chi-square 14.714 29.105 Chi-square 5.032 3.139 P- value 0.005 <0.001 P- value 0.284 0.535 R23 K11 K12 K21 K22 R24 K11 K12 K21 K22 V1 44 38 44 38 V1 21 19 19 21 V2 85 74 88 71 V2 51 50 56 45 V3 74 77 90 61 V3 81 82 91 72 V4 41 34 41 34 V4 76 56 85 47
R23 K11 K12 K21 K22 R24 K11 K12 K21 K22 V5 10 10 11 9 V5 25 26 23 28 V4+V5 [%] 51 20.1 44 18.9 52 19.0 43 20.2 V4+V5 [%] 101 39.8 82 35.1 108 39.4 75 35.2 Sum 254 233 274 213 Sum 254 233 274 213 Chi-square 1.010 1.055 Chi-square 2.264 7.418 P- value 0.908 0.901 P- value 0.687 0.115 Notes: R21, R22, R23, R24 – sources of economic risk, V1, V2, V3, V4, V5 – evaluation of source of risk, K11, K12, K13, K14 – criteria.
Table 3. The evaluation of sources of financial risk by entrepreneurs
R31 K11 K12 K21 K22 R32 K11 K12 K21 K22 V1 35 21 35 21 V1 83 77 88 72 V2 58 57 64 51 V2 84 67 81 70 V3 83 71 90 64 V3 50 48 56 42 V4 54 54 57 51 V4 24 32 31 25 V5 24 30 28 26 V5 13 9 18 4 V4+V5 [%] 78 30.7 84 36.1 85 31.0 77 36.2 V4+V5 [%] 37 14.6 41 17.6 49 17.9 29 13.6 Sum 254 233 274 213 Sum 254 233 274 213 Chi-square 4.212 2.159 Chi-square 3.150 6.413 P- value 0.378 0.706 P- value 0.533 0.170 R33 K11 K12 K21 K22 R34 K11 K12 K21 K22 V1 77 72 79 70 V1 99 80 100 79 V2 54 59 61 52 V2 56 66 59 63 V3 52 51 51 52 V3 48 49 57 40 V4 41 34 47 28 V4 27 20 26 21 V5 30 17 36 11 V5 24 18 32 10 V4+V5 [%] 71 28.0 51 21.9 83 30.3 39 18.3 V4+V5 [%] 51 20.1 38 16.3 58 21.2 31 14.6 Sum 254 233 274 213 Sum 254 233 274 213 Chi-square 3.749 11.928 Chi-square 3.848 10.148 P- value 0.441 0.018 P- value 0.427 0.037 Notes: R31, R32, R33, R34 – sources of financial risk, V1, V2, V3, V4, V5 – evaluation of source of risk, K11, K12, K13, K14 – criteria.
Table 4. The evaluation of sources of operational risk by entrepreneurs
R41 K11 K12 K21 K22 R42 K11 K12 K21 K22 V1 78 75 81 72 V1 82 93 93 82 V2 92 79 106 65 V2 72 58 70 60 V3 64 58 67 55 V3 71 54 74 51 V4 16 18 16 18 V4 19 22 24 17 V5 4 3 4 3 V5 10 6 13 3 V4+V5 [%] 20 7.9 21 9.0 20 7.3 21 9.9 V4+V5 [%] 29 11.4 28 12.0 37 13.5 20 9.4
R41 K11 K12 K21 K22 R42 K11 K12 K21 K22 Sum 254 233 274 213 Sum 254 233 274 213 Chi-square 0.698 4.226 Chi-square 4.834 5.585 P- value 0.951 0.376 P- value 0.308 0.232 R43 K11 K12 K21 K22 R44 K11 K12 K21 K22 V1 67 71 74 64 V1 108 104 115 97 V2 79 71 80 70 V2 61 58 66 53 V3 78 57 80 55 V3 56 45 58 43 V4 23 25 30 18 V4 19 20 23 16 V5 7 9 10 6 V5 10 6 12 4 V4+V5 [%] 30 11.8 34 14.6 40 14.6 24 11.3 V4+V5 [%] 29 11.4 26 11.2 35 12.8 20 9.4 Sum 254 233 274 213 Sum 254 233 274 213 Chi-square 3.243 2.418 Chi-square 1.472 2.836 P- value 0.518 0.659 P- value 0.832 0.585 Notes: R31, R32, R33, R34 – sources of operational risk, V1, V2, V3, V4, V5 – evaluation of source of risk, K11, K12, K13, K14 – criteria.
Table 5. The evaluation of sources of HR risk by entrepreneurs
R51 K11 K12 K21 K22 R52 K11 K12 K21 K22 V1 71 81 76 76 V1 57 69 61 65 V2 60 57 66 51 V2 74 69 75 68 V3 67 52 68 51 V3 64 52 71 45 V4 43 31 47 27 V4 38 30 41 27 V5 13 12 17 8 V5 21 13 26 8 V4+V5 [%] 56 22.0 43 18.5 64 23.4 35 16.4 V4+V5 [%] 59 23.2 43 18.5 67 24.5 35 16.4 Sum 254 233 274 213 Sum 254 233 274 213 Chi-square 3.713 5.441 Chi-square 4.485 11.245 P- value 0.446 0.245 P- value 0.344 0.024 R53 K11 K12 K21 K22 R54 K11 K12 K21 K22 V1 76 80 85 71 V1 80 83 86 77 V2 83 71 86 68 V2 73 66 78 61 V3 62 50 61 51 V3 61 43 60 44 V4 23 24 29 18 V4 28 32 35 25 V5 10 8 13 5 V5 12 9 15 6 V4+V5 [%] 33 13.0 32 13.7 42 15.3 23 10.8 V4+V5 [%] 40 15.7 41 17.6 50 18.2 31 14.6 Sum 254 233 274 213 Sum 254 233 274 213 Chi-square 1.664 2.786 Chi-square 3.319 2.967 P- value 0.797 0.594 P- value 0.506 0.563 Notes: R31, R32, R33, R34 – sources of HR risk, V1, V2, V3, V4, V5 – evaluation of source of risk, K11, K12, K13, K14 – criteria.
R61 K11 K12 K21 K22 R62 K11 K12 K21 K22 V1 88 88 99 77 V1 77 92 77 92 V2 66 65 64 67 V2 77 74 85 66 V3 63 56 71 48 V3 55 42 59 38 V4 21 9 20 10 V4 34 17 39 12 V5 16 15 20 11 V5 11 8 14 5 V4+V5 [%] 37 14.6 24 10.3 40 14.6 21 9.9 V4+V5 [%] 45 17.7 25 10.7 53 19.3 17 8.0 Sum 254 233 274 213 Sum 254 233 274 213 Chi-square 4.354 5.658 Chi-square 9.884 19.491 P- value 0.360 0.226 P- value 0.047 <0.001 R63 K11 K12 K21 K22 R64 K11 K12 K21 K22 V1 112 88 114 86 V1 104 97 113 88 V2 75 79 82 72 V2 64 58 63 59 V3 46 37 50 33 V3 48 48 53 43 V4 15 23 22 16 V4 26 22 30 18 V5 6 6 6 6 V5 12 8 15 5 V4+V5 [%] 21 8.3 29 12.4 28 10.2 22 10.3 V4+V5 [%] 38 15.0 30 12.9 45 16.4 23 10.8 Sum 254 233 274 213 Sum 254 233 274 213 Chi-square 4.747 1.379 Chi-square 0.768 4.715 P- value 0.314 0.847 P- value 0.943 0.317 Notes: R31, R32, R33, R34 – sources of safety risk, V1, V2, V3, V4, V5 – evaluation of source of risk, K11, K12, K13, K14 – criteria.
Table 7. The evaluation of sources of legal risk by entrepreneurs
R71 K11 K12 K21 K22 R72 K11 K12 K21 K22 V1 45 52 52 45 V1 37 41 45 33 V2 56 73 55 74 V2 50 64 53 61 V3 65 55 72 48 V3 79 63 89 53 V4 46 33 53 26 V4 43 42 48 37 V5 42 20 42 20 V5 45 23 39 29 V4+V5 [%] 88 34.6 53 22.7 95 34.7 46 21.6 V4+V5 [%] 88 34.6 65 27.9 87 31.8 66 31.0 Sum 254 233 274 213 Sum 254 233 274 213 Chi-square 12.642 17.776 Chi-square 9.969 6.896 P- value 0.0131 0.001 P- value 0.0409 0.141 R73 K11 K12 K21 K22 R74 K11 K12 K21 K22 V1 57 58 65 50 V1 52 64 60 56 V2 51 67 56 62 V2 34 48 38 44 V3 68 57 75 50 V3 55 43 58 40 V4 46 35 46 35 V4 57 49 67 39 V5 32 16 32 16 V5 56 29 51 34
R73 K11 K12 K21 K22 R74 K11 K12 K21 K22 V4+V5 [%] 78 30.7 51 21.9 78 28.5 51 23.9 V4+V5 [%] 113 44.5 78 33.5 118 43.1 73 34.3 Sum 254 233 274 213 Sum 254 233 274 213 Chi-square 9.485 6.550 Chi-square 13.400 7.151 P- value 0.049 0.162 P- value 0.009 0.128 Notes: R31, R32, R33, R34 – sources of legal risk, V1, V2, V3, V4, V5 – evaluation of source of risk, K11, K12, K13, K14 – criteria.
Table 8. Comparison of risk assessment by selected criteria
Table 8_R1 K1 K2 Table 8_R2 K1 K2 Table 8_R3 K1 K2 Z-score Z-score Z-score Z-score Z-score Z-score P-value P-value P-value P-value P-value P-value
R11 0.055 0.431 R21 0.908 -0.462 R31 -1.250 -1.191 0.960 0.667 0.362 0.645 0.211 0.234 R12 0.449 -0.199 R22 -1.162 -0.141 R32 -0.911 1.274 0.652 0.841 0.246 0.888 0.363 0.204 R13 0.591 -0.515 R23 0.332 -0.332 R33 1.542 3.027 0.555 0.603 0.741 0.741 0.123 0.002 R14 0.223 -0.205 R24 1.040 0.950 R34 1.075 1.873 0.826 0.834 0.298 0.342 0.280 0.061 Table 8_R4 K1 K2 Table 8_R5 K1 K2 Table 8_R6 K1 K2 Z-score Z-score Z-score Z-score Z-score Z-score P-value P-value P-value P-value P-value P-value
R41 -0.452 -1.001 R51 0.984 1.889 R61 1.421 1.567 0.653 0.312 0.327 0.049 0.155 0.116 R42 -0.205 1.401 R52 1.293 2.158 R62 2.195 3.545 0.833 0.161 0.197 0.031 0.028 < 0.001 R43 -0.907 1.079 R53 -0.240 1.458 R63 -1.517 -0.039 0.362 0.281 0.810 0.144 0.128 0.968 R44 0.09 1.170 R54 -0.547 1.086 R64 0.663 1.776 0.928 0.242 0.582 0.276 0.509 0.075
Table 8_R7
Table 8_R7
R71 R72 R73 R74
K1 K2 K1 K2 K1 K2 K1 K2 Z-score Z-score Z-score Z-score Z-score Z-score Z-score Z-score P-value P-value P-value P-value P-value P-value P-value P-value 2.892 3.156 1.603 0.180 2.203 1.122 2.486 1.972 0.004 0.002 0.110 0.857 0.028 0.263 0.013 0.049 Notes: Black color of Z-score (P- value) – there are statistically significant differences between entrepreneurs (differences between entrepreneurs K11 and K12 or differences between entrepreneurs K21 and K22), K1: our company deals with the risk management – yes (K11), no (K12); K2: our company creates a space for discussing the key risks – yes (K21), no (K22).
Figure 1. The key risks of the business environment
340 258 283 122 149 78 97 0 50 100 150 200 250 300 350 400 The market risk
The economic risk The financial risk The operational risk The HR risk The safety risk The legal risk
Number of entrepreneurs S el ec te d r es ea rc h r is k