Septic Shock Prediction for ICU Patients via Coupled HMM
Walking on Sequential Contrast Patterns
Shameek Ghosha, Jinyan Lia,∗, Longbing Caoa, Kotagiri Ramamohanaraob
aAdvanced Analytics Institute, Faculty of Engineering and IT, University of Technology Sydney (UTS), Australia
bDepartment of Computing and Information Systems, The University of Melbourne, Parkville, VIC, Australia, 3010, Australia
Abstract
Background and Objective: Critical events like sepsis or septic shock happened to patients in intensive care units (ICUs) are dangerous complications which can cause multiple organ failures and eventual death. Preventive prediction of such events will allow clinicians to stage effective interventions for averting these critical complications.
Methods: It is widely understood that physiological conditions of patients on variables such as blood pressure and heart rate are suggestive to gradual changes over a certain period of time prior to the occurrence of a septic shock. This work investigates the performance of a novel machine learning approach for the early prediction of septic shock. The approach combines highly informative sequential patterns extracted from multiple physiological vari-ables and captures the interactions among these patterns via coupled hidden Markov models (CHMM). In particular, the patterns are extracted from three non-invasive waveform mea-surements: the mean arterial pressure levels, the heart rates and respiratory rates of septic shock patients from a large clinical ICU dataset called MIMIC-II.
Results: Our experiments demonstrate a strong competitive accuracy in the prediction, especially when the interactions between the multiple variables are coupled by the learning model.
Conclusions: We can conclude that the novelty of the approach stems from the integra-tion of sequence-based physiological pattern markers with the sequential model CHMM to learn dynamic physiological behavior as well as from the coupling of such patterns to build powerful risk stratification models for the septic shock patients.
Keywords: Septic shock, Symbolic sequences, Sequential pattern mining, Coupled Hidden Markov Models
∗Corresponding author
Email addresses: [email protected](Shameek Ghosh),[email protected]
(Jinyan Li),[email protected](Longbing Cao), [email protected]
(Kotagiri Ramamohanarao)
1. Introduction
Septic shock is a critical complication arising from an infection, such that a systematic inflammatory response syndrome (SIRs) is triggered in the human body. Due to SIRs, tiny blood clots are formed. These clots block the oxygen and nutrients from reaching vital organs, leading to acute organs dysfunction and death.
Generally, sepsis treatment accounts for 10% of all ICU admissions [1]. Over 19 million cases have been extrapolated to report worldwide incidence of SIRs [4]. Hospitalization due to SIRs, has overtaken those for myocardial infarction (commonly known as heart attack) [2]. Currently, sepsis is the most expensive medical condition to be treated in hospitals and cost more than $20 billion in 2011, in US hospitals. Reportedly, these costs have been increasing by 11.9% annually [3].
It should be noted that the survival outcomes of sepsis treatments greatly depend on the early recognition of sepsis stages. Thus, discovering potential biomarkers for sepsis and septic shock, is an active area of research and a substantial literature of methods have been reported. Traditionally, SIRs is diagnosed using laboratory tests to determine the presence of factors like bacteria, low platelet counts, electrolyte imbalance etc. Complex patient health scoring systems like the Acute Physiology and Chronic Health Evaluation (APACHE II), and the recently developed targeted scoring systems, are employed to direct early interventions for sepsis [7, 6]. Past studies have employed features like patient demo-graphics, heart rate variability, hypotension levels, and patient medical history, at the time of ICU admission to develop machine learning models using multivariate logistic regression, multilayered perceptrons, decision trees, principal component analysis and support vector machines [5, 49, 47, 48].
A septic shock is identified by the occurrence of a hypotensive event (an extended drop in blood pressure), despite of a prior fluid resuscitation treatment. The mortality risk can increase dramatically, when patients progress from a sepsis situation to a septic shock. Therefore, the accurate identification of patients at risk of septic shock during the critical ”golden hours” [7] is crucial for the improvement of the traditional treatment protocols in the current clinical care implementations. To this purpose, the direct use of machine learning models using population level prognostic variables, are not suitable for short-term predictions (fo e.g., within 2 hours) of fast-evolving critical events in ICU settings. This is because, accurate forecasting of critical events, require dynamic temporal patient data. Subsequently, recent studies of temporal pattern mining methods for outcome prediction using Electronic Health Records have generated significant interest in the field of medical informatics and event predictions [8, 9, 10, 11]. Howeever, the previous methods involved the use of highly curated datasets, involving invasively collected clinical variables and comparatively smaller population samples, in comparison to the requirements of large-scale clinical studies.
Typically, simple machine learning models do not scale well in performance for large-scale databases of ICU patients. A number of the described methods employed randomised controlled trials (RCTs), which although necessary, are still costly undertakings, requiring immense time and resources. On the other hand, large-scale retrospective data driven studies can complement the mainstream clinical research, by providing effective testbeds for the
development of interesting computational frameworks.
In the current study, we exploit the potential of commonly observed physiological mea-surement data for the early prediction of septic shock. The data was obtained from the measurements of the Mean Arterial Pressure (MAP), the Heart Rate (HR) and the Respira-tory Rate (RR) in the MIMIC-II database [25]. Our approach discovers sequential contrast patterns from these physiological measurements, and then transforms the original train-ing data into a time series of patterns. Later, we apply a coupled Hidden Markov Model (CHMM) to these time series of patternsfor constructing the septic shock classifier. Later, for a given test sample (new patient), the classifier can estimate the probability of septic shock, happening in a future time window, after a half or one hour. Additionally, the se-quential contrast patterns contained in the test sample, also tend to provide insights into the probability of the classification.
1.1. Contributions
The detailed contributions of this study are:
• A data-driven sequential contrast mining based approach is employed for ICU time series, to extract sequential patterns from a given patient population,
• The extracted contrast patterns are used to encode the dicretized training data by creating an ordered sequence of contrast patterns for each patient,
• A CHMM is used to couple multiple channels of pattern sequences, for the prediction of high-risk septic shock patients, in a future time window
This study indicates that the integration of multi-channel contrast sequential patterns using CHMMs, can achieve accuracies competitive to earlier models. More importantly, our integrated approach makes it possible to simultaneously extract patterns that record dynamic patient information, and use these contrast patterns as inputs to sequential learning models for large-scale physiological data sets, from major healthcare database providers.
2. Related Work
In the past, numerous studies have been reported in the field of biomedical event predic-tion. An overview of recent research advances related to the use of pattern-based classifica-tion approaches for medical events predicclassifica-tion are reported, along with previous statistical modeling studies for septic shock prediction.
2.1. Previous Studies in Septic Shock Prediction
For the early prediction of septic shock, a septic shock early warning system (EWS) was proposed using the multivariate logistic regression method as a key component [46]. The reported method demonstrated high accuracy for a dataset having 185 sepsis and 65 sep-tic shock patients. Thiel et al [50] carried out a recursive partitioning and regression tree (RPART) analysis for multiple cohorts of greater than 13000 patients, for early prediction
of septic shock from hospitalized non-ICU patients. The better performing models were able to identify only 55% of the septic shock patients. Pereira et. al [51] used the Zero-Order-Hold (ZOH) method as a preprocessing technique over a fuzzy C-means clustering algorithm to improve septic shock classification performance for 121 abdominal septic shock patients. The same dataset was also employed by Fialho et al[52] to benchmark wrapper based feature selection techniques using fuzzy models and neural networks. Lukaszewski et. al [49] employed clinical factors like blood sample measures and the expression levels of miRNAs, for learning a multilayered perceptron among 92 patients, reporting an 83% predictive accuracy for patients who became septic. Gwadry-Sridhar et. al [47] employed decision tree learning for 20 clinical variables and reported nearly 100% predictive accuracy. Tang et. al [48] employed principal component analysis (PCA) in combination with a non-linear support vector machine (SVM) on high resolution temporal physiological waveform datasets to achieve an 84% accuracy for predicting sepsis onset among 28 patients.
2.2. Using Pattern- based Classification Models for predicting Biomedical Events
Mining various kinds of patterns such as itemsets, and sequences have remained a focus area of data mining research, for a long time. In classification problems, discriminative patterns have strong associations with class sensitive datasets, making them suitable for use as potential variables or features, while building a robust classifier [12].
Methods described in section 2.1, are limited to the application of statistical models to determine associations between a risk factor and a disease outcome. However, real-world healthcare data is intrinsically too complex and massive to be limited to finding pair-wise associations. Thus, the identification of novel sequential and temporal patterns turns out to be a crucial advancement towards the development of state-of-the-art clinical informatics tools and techniques.
In this context, Klema et al [13] identified frequent sequential patterns from a longitudinal dataset to map atherosclerisis risk factors to health outcomes. The mined patterns were later used to create classification rules for predicting cardiovascular risk. Baralis et al[14] employed the patient examination histories to derive significant closed sequential patterns to derive standard clinical workflows as well as workflow deviations, that were not compliant. Moreover, Berlingerio et al [15] demonstrated further expressiveness in medical sequential patterns by mining event sequences along with the most frequently elapsed time intervals, between these events. Patnaik et al [16] reported the extraction of sequential coding patterns from EHR data and followed up with the derivation of partial orders from the extracted sequences for generalizing patterns.
Due to the longitudinal EHR’s intrinsic temporal nature, Sachi et al [17] proposed a method for mining temporal association rules from time series variables monitored during hemodialysis sessions. These temporal rules were mined based on prior definitions of tem-poral abstractions of interest. Later, Moskovitch and Shahar [18] studied the problem of mining frequently occurring temporal patterns in abstracted EHR data and used Allen’s interval algebra representations [19] to define complex time-interval patterns for diabetic patients. Batal et al [20, 21] proposed a method for mining minimal time-interval patterns
that are useful for predicting patients who are at risk of developing heparin induced throm-bocytopenia (HIT), a life threatening condition that may develop in patients treated with heparin. Among other temporal methods, Wang et al [22] proposed a non-negative matrix factorization framework using a convolutional approach for temporal pattern discovery in EHR data. This approach models each patient’s record as an image matrix, where the x-axis corresponds to the time stamps and the y-axis corresponds to the event types.
Recent research by Dafe et al [23] strongly reflected on the importance of capturing sequential relationships among discrete events for building robust sequential classifiers. The application of sequential patterns to create a feature space for learning models has also been reported by Fradkin et al [40].
As described in section 2.1, the direct use of learning models on raw physiological data make them vulnerable to noise and tends to use statistical features that aggregate informa-tion based on windowing methods. Accordingly, such processes fail to capture interesting sequence based features. Moreover, the auto-integration of informative sequential patterns while creating learning models for ICU event prediction, remains an open area of research.
3. Materials and Methods
In this section, the detailed steps of the proposed septic shock prediction approach are presented. Initially, a brief description of the data discretization technique for the continuous time series data is provided. This is followed by the relevant definitions and concepts related to the extraction of sequential contrast patterns from the waveform datasets of two differently labelled groups of patients is discussed. Finally, we describe the integration of sequential contrast patterns using coupled hidden markov models (CHMMs) for predicting the class label of an unknown patient sequence (the test data instance) for classification purposes.
The novelty of our integrated approach lies in the exploitation of position information of sequential patterns (also described as the offset of a pattern), within a given patient sequence.
3.1. Discretisation of Continuous Time Series
For discovering informative sequential patterns, an initial step requires the transforma-tion of real-valued timestamped data to discretized representatransforma-tions [26]. This is a necessary step for the effective application of pattern discovery methods, since they operate on symbolic data types. Subsequently, the symbolic aggregate approximation (SAX) method [27] can be used to transform a time series signal into a discrete sequence, where a symbol is assigned to discrete intervals within the signal amplitude range.The SAX technique has emerged as a leading discretisation method, which has demonstrated its efficiency in numerous data mining applications by producing informative symbolic representations of large-scale time series data. SAX converts the given time series to a piecewise aggregate approximation (PAA) representation [27], which is later converted to a symbolic sequence. As described by Lin et al [27], SAX characterizes the inherent properties of a time series data. Thus, an equiprobable distribution of symbols is obtained for the corresponding time series [27]. Algorithmic details on SAX discretization can be obtained in [27].
Following the discretization of time stamped data, data mining algorithms can be em-ployed for discovering sequential patterns from disparate populations of sequence datasets. Previously, the discovery of emerging patterns from differently labelled groups of data was described by Dong and Li [28]. Emerging patterns are described as itemsets, which are con-strained by user-defined frequency supports in differently labelled populations (or classes). Thus, given a dataset consisting of two classes, emerging patterns can be discovered, which frequently appear in the positive class compared to less frequency support in the negative class. Emerging patterns was later extended to identify emerging substrings in [43]. Sub-strings are categorised as a special case of subsequences, where symbols in a substring have a gap interval of 0. However, sequential patterns of interest may not always be composed of consecutive symbols, within a given symbolic sequence. Accordingly, numerous algorithms have been reported for realizing gap intervals between symbols in a sequential pattern [44]. In the current study, we begin with the identification of gap-constrained subsequences from differently labelled groups of training sequence data, based on the principles of frequency support.
3.1.1. Sequential Patterns
The discovery of sequential patterns is associated with the mining of transactional data to extract frequently occurring ordered sequences of items.
Let there exist a set of distinct items represented as I. A sequence S defined over I, may be written as e1 −e2 −. . .−en, given that ei ∈ I, such that 1 ≤ i ≤ n. A sequence S0 =ei1−ei2−. . .−eim is said to be contained in a sequenceS=e1−e2−e3−...−en, such
that 1≤i1 ≤i2 ≤ ≤im ≤n. For example, a subsequence XY is contained in XAAY, but not YX. Hence, the sequence order ofS0 is maintained inS, however the individual items in
S0 are not consecutive inS.
Moreover, given the sequences, S =e1−e2−. . .−en and S0 =ei1 −ei2 −. . .−em , S0 occurs in S if 1 ≤ ik ≤ n and ek = eik for all 1 ≤ k ≤ m, and ik ≤ ik+1 for 1 ≤ k ≤ m.
For example, given sequences S =ACACBCB and subsequence S0 =AB, there exist four occurrences of S0 inS at the positions - {1,5},{1,7},{3,5} and {3,7}.
For satisfying the condition of gap constraints between symbols, let us consider a sequence
S =e1−e2−. . .−enand an occurrenceO =i1, i2, . . . , im of a subsequenceS0, if (ik+1−ik)≤ g+ 1, thenS0 for the occurrenceO, fulfills the gap constraint ofg. Generally, the occurrence of a sequence with gaps at least once in a training data instance satisfies the condition of gap-constraint, for that sequence within the instance. For example, if g = 3, then AB is a subsequence of ACCB, but not ACCCCB.
3.1.2. Mining Sequential Contrast Patterns
Emerging patterns (EP) are described as itemsets, which are constrained by user-defined frequency support conditions in different classes [28]. This means that for a dataset consist-ing of two classes, patterns satisfyconsist-ing the condition of high frequency support in the positive class and low frequency support in the negative class are known as emerging patterns. Thus, an EP having high support in one class and low support in the contrasting class is consid-ered to be a discriminative pattern that is able to contrast between the two opposite classes.
Accordingly, the strength of such a pattern is expressed by the ratio of frequency supports in both classes (also known as the growth rate of EP). Here, we begin with the identification of gap-constrained subsequences from differently labelled groups of training sequence data, based on the principles of frequency support.
Let us consider, D = {D1, D2, . . . , Dn} represents a set of training sequences, P - a sequential pattern, and g is the gap-constraint. Then the cardinality of occurrences of P
inD is given by countP(D, g), which is also known as the absolute frequency support of P in D. Subsequently, if there exists a user-defined cardinality threshold of α and P satisfies a condition such as countP(D, g) ≥ α, then we say that P is frequent in D, having a gap constraint ofg.
Extending the above description, given two differently labelled sequence datasets D+
(positive sequences) andD−(negative sequences), we can maintain two cardinality thresholds
α and β, and a maximum gap of g, where a sequential contrast pattern P needs to satisfy the following conditions.
(1) Positive Support: countP(D+, g)≥α (2) Negative Support: countP(D−, g)≤β
Thus, givenD+,D−,α,βandg, mining sequential contrast patterns involves discovering the set of all subsequences, which fulfill the above conditions in (1) and (2).
The rationale behind the extraction of contrast patterns is associated with the growth rate of a pattern, which can be described as the ratio of a given pattern’s support in D+
overD− [28]. The growth rate of a pattern is intuitive from a clinical applications perspec-tive. This is because the traditional objective in clinical trials, is oriented towards finding differences between the intervention and control population of patients. Thus, discovering patterns based on differences in their supports in the intervention and control populations, allow us to find sequential patterns that can explain the difference between two populations of data.
3.1.3. Generating Candidate Contrast Sequences
For discovering the set of all contrast sequential patterns, we make use of the ConSGap-Miner technique [29], proposed earlier for the extraction of minimal distinguishing subse-quences (MDS), where gap constraints are defined by the user. The method employs the depth first search (DFS) technique for generating the set of candidate contrast sequences. Towards this purpose, a lexicographic sequence tree (LST) is grown [29]. In an LST, a node in the tree includes a subsequence, with its positive and negative frequency supports.
After a sequence node is generated, if it satisfies the conditions (1) and (2), then the sequence node is not extended further. This is because a supersequence of a potential sequential pattern that satisfies conditions (1) and (2), is not minimal [29]. Hence, in order to reduce the generation of redundant patterns as well as minimize tree depth, the growth of sequences is restricted by a minimality condition.
Moreover, if a sequence node’s positive frequency support is lesser than α (as specified in condition (1)) , then the concerned node is not extended further. This is owing to the fact that supersequences of an infrequent max-prefix subsequence are also infrequent [29].
Later, gap-constraint satisfaction is verified by the application of a bitmap representation reported earlier for checking gap-constraints [42]. Finally, a post-processing step is also applied so that any supersequence of at least another shorter subsequence, is removed from the resulting set of contrast sequences.
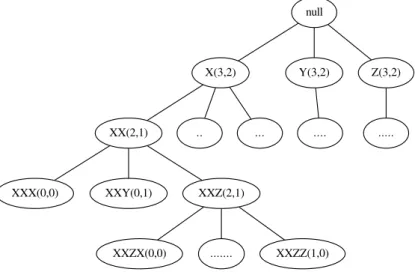
An example of a LST is shown in Figure 1. Here, nodeXXZ(2,1) represents the sequence
XXZ with 2 as positive and 1 as negative supports. A child sequence may be grown by extending the parent sequence with a unique symbol from the alphabet, based on a certain lexicographic order. Thus, given the present LST, whose alphabet is defined as I = X, Y, Z, XXZ has three children nodes as XXZX, XXZY and XXZZ. Subsequently each nodes supports are computed from the positive (D+) and negative (D−) classes.
null
X(3,2) Y(3,2) Z(3,2)
XX(2,1) .. ... .... ...
XXX(0,0) XXY(0,1) XXZ(2,1)
XXZX(0,0) ... XXZZ(1,0)
Figure 1: A Lexicographic Sequence Tree (LST) growing candidate sequences using 3 symbols as X, Y, Z
3.2. From a discretised timestamped instance to an ordered set of sequential contrast patterns
In conventional methods, if a test data instance satisfies one of the discovered patterns, then that instance is interpreted as satisfying a rule based on the corresponding pattern. In the context of sequence based training data, order information between contiguous elements can be exploited for robust classification or prediction of sequences for supervised learning applications. These patterns are known as sequential patterns, where informative sequences are derived using frequency measures like absolute or relative frequency support, within the training data [38]. Later, the extracted set of sequential patterns are used to correlate a given test sequence with an outcome. To this purpose, the existence of individual sequential patterns is tested to make an outcome prediction or test instance classification.
However, a sequential pattern can also have a strong interpretive value associated with its position information (described by the offset of a pattern) within a given discretised data instance. This means that an ordered set of patterns, occurring at different offset positions within an instance, can have importance with estimating an outcome for the given instance. Using offset values of the extracted sequential patterns in a discretised timestamped instance,
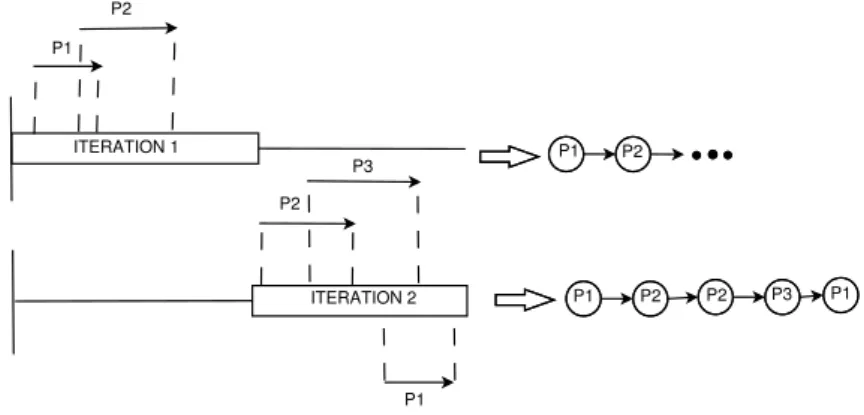
allows us to transform the data instance to a meaningful episode consisting of consecutive sequential contrast patterns. As described in section 3.1.3, the set of contrast patterns is obtained from a simple and flexible sequential contrast mining technique. Following the ex-traction, the training dataset is transformed to a dataset of meaningful episodes, constructed by ordering sequential patterns based on their position, within an original training sequence. Sequences of patterns are then provided as input to a hidden markov model, which is an appropriate sequential learning method for exploiting a set of observations ordered in time. Let us consider,P ={P1, P2, . . . , Pn}as a set of contrast sequences obtained from theD+ and D− training sequences, as described previously. Subsequently, a discretised instance of a training dataset, is transformed to a sequence of items or patterns fromP. This is carried out by using a sliding window to incrementally move through the original discrete sequence. A sliding window of length equivalent to the longest item (pattern) in P is selected for our purpose. For each iteration of the sliding window through the sequence, the existence of item Pi (a sequential pattern) is tested in the corresponding segment of the sequence. This can be illustrated using Figure 2.
P1 P2 P2 P3 P1 P1 P2 P2 P3 P1 P1 P2 ITERATION 1 ITERATION 2
Figure 2: Encoding and transformation of a data instance to an ordered sequence of patterns
Let us consider P = {P1, P2, P3} as the set of sequential contrast patterns. In the first
iteration of the sliding window, P1 and P2 are identified. This is followed by the detection
of P2, P3 and P1, in the second iteration. To determine the order information between two
patterns, we employ the rulepos[Pj]1<pos[Pk]1, wherepos[Px]1 gives the position of the first
symbol of a pattern Px within a given sequence. Here x, j, k ∈N and ≤3.
The above encoding procedure is repeated for each of the training sequences to obtain a transformed dataset, where each original sequence is thus encoded using an ordered series of patternsPi. The transformed set of sequences is subsequently provided to an HMM (and CHMM) for learning its model parameters. Later, in the prediction phase, an unlabelled discrete test sequence is transformed to a pattern sequence usingP (the contrast pattern set), which is provided as an input to the learned HMM for obtaining a probability likelihood estimate for the corresponding test sequence. Finally, the class label of the sequence is predicted to be positive, if the likelihood estimate is higher than a user-defined threshold.
The above process of transforming a single discrete sequence to an informative episode of patterns can be readily extended for multiple time series variables. For a multivariate
sequence, a data instance is composed of multiple sequences, each representing a specific time series variable. For each of the given variables, we extract a set of sequential contrast patterns. Subsequently, the transformation of the multivariate training dataset is performed by encoding each variable sequence (of a data instance) using its corresponding contrast pattern set.
3.2.1. Coupled Hidden Markov Models
CHMM extends the conventional form of HMM to multiple observation sequences or channels. Existing studies have employed CHMM in applications such as speech recognition, activity recognition, anomalous trading activities, disease interactions and fault diagnosis [31, 32, 33]. In the current study, CHMM is used to integrate and model interactions between multiple physiological variables, each represented by a sequence of discrete observations. Accordingly, multiple HMMs are aggregated by enabling transitions between the discrete hidden states for each HMM. The topological structure of a CHMM is shown in Figure 3, where for example, two variables with corresponding channels are integrated.
Figure 3: Topology of a two-channel CHMM.
Let us consider a generalised CHMM model with C parallel channels from {1, . . . , C}. The set of states is given by Sc = {sc
1, sc2, . . . , scIK}, where IK is the number of states and
c∈ {1, . . . , C}. The set of observations is represented byVc={vc
1, v2c, v3c, . . . , vJcc}, whereJc
is the number of discrete observations. The state transition distribution Ac = {aci1i2...i
Ckc},
based on the generalised markov property, where each hidden node has C parent nodes (corresponding to C channels) from the previous time point, is given by
P(qtc+1 =sckc|q1t =s1i1, . . . , qct =sCi C) =a c i1i2...iCkc (1) wherePIK kc=1a c i1i2...iCkc = 1.
The emission probability distribution in state sc
i is given by Bc={bci(k)}, such that
bci(k) =P(Otc=vkc|qct =sci) (2)
wherePJc
k=1bci(k) = 1.
In equation (2), the identifiers c, i and k indicate a channel, a state and an observation, respectively.
The initial state distribution πc={πc
i} is represented as πic=P(qc1 =sci) (3) wherePIK i=1π c i = 1.
Accordingly, each channel is described by the following HMM notation of parameters
λc= (Ac, Bc, πc) (4)
The final CHMM model can thus be denoted by
λ = (λ1, λ2, . . . , λC) (5)
Similarly as conventional HMM, the three specific research areas for a CHMM include, (1) the classification of observation sequences, (2) inferring the sequence of hidden states which maximizes the sequence likelihood estimate, and (3) learning the parameters of the CHMM.
For classification, if we have C channels corresponding to C observation sequences, such that oc = oc
1, oc2, oc3, . . . , ocT, we need to compute the probability of the given C se-quences denoted byP(o1, o2, . . . , oC|λ1, λ2, . . . , λC). For inferring the hidden state sequence, given C channels, the final CHMM needs to determine the sequence of hidden states:
qc = qc
1, qc2, . . . , qcT for each channel c = 1,2, . . . , C, such that the likelihood estimate is maximized for the given observation sequences. Finally, for model estimation, given C ob-servation sequences oc = oc
1, oc2, oc3, . . . , ocT for each of the C channels, we need to optimize optimize the parameters of the CHMM model to maximizeP(ol, o2, . . . , oC|λ1, λ2, . . . , λC).
Previously, various algorithms have been employed to solve the CHMM problem [34, 35]. For our implementations, we adopted the procedure described by Rezek et al [30]. Here, the CHMM with C channels was modified to construct a single channel large HMM. In this large single channel CHMM, each state is viewed as a cartesian product of states from the
C channels and is given by s = (s1
i1, s2i2, s3i3, . . . , sCiC). Note that s
C
iC represents a discrete
state from the Cth channel and i
C ∈ sC1, . . . , sCIk. Thus, s
C
iC a member of the set S
c for c∈ {1,2, . . . , C}.
The above formulation leads to a total of N = πC
k=1Ik possible states for the HMM at every time instance. Accordingly, an A=N XN matrix is formed, where each element de-notes the probability of state transition from one states to another state in the given HMM. Note that each state consists of C ordered components. According to this procedure, an observation for a given time step is aCX1 vector give byv. Here,v ={v1
k1, vk22 , vk33 , . . . , vCkC},
wherevkC
C ∈V
c, such thatc∈ {1, . . . , C}. Thus, we haveM =πC
c=1Jc possible observations, 11
at a given time instance. Subsequently, an N XM matrix B can be defined to represent the observation probabilities of the final CHMM. This large HMM can now adopt the general structure given byλ={π, A, B}.
Based on the above transformations, the aforementioned CHMM problems for model estimation and classification become the same as a single-channel HMM. Towards this pur-pose, we employ the generalised forward-backward algorithm for solving the classification problem. For model estimation, we use the expectation-maximization algorithm (also known as the Baum-Welch method) to maximize P(O|λ) to adjust model parameters for HMM. Further details can be found in [30].
3.3. Illustrative examples of CHMM walking on sequential patterns
To demonstrate the sequential patterns based CHMM technique, we consider two simple examples: (1) a single channel patterns based HMM (SCP-HMM) and (2) multi-channel patterns based CHMM (MCP-CHMM).
3.3.1. Single channel patterns based HMM (SCP-HMM)
In the following example, let us consider a set consisting of the patient mean arterial pressures (MAPs) for positive (D+) class labels. Let the set of sequential patterns extracted
after the contrast mining process be denoted by P ={Pji|j = 1. . . n, i = 1. . . m}, where i
encodes the channel and j encodes the pattern, as shown in Figure 5. Due to the nature of contrast mining, the patterns listed inP have stronger support in D+ thanD−. Thus, each
pattern is encoded using a symbolPji, where i indicates the number index of variables and
j indicates the number index of patterns.
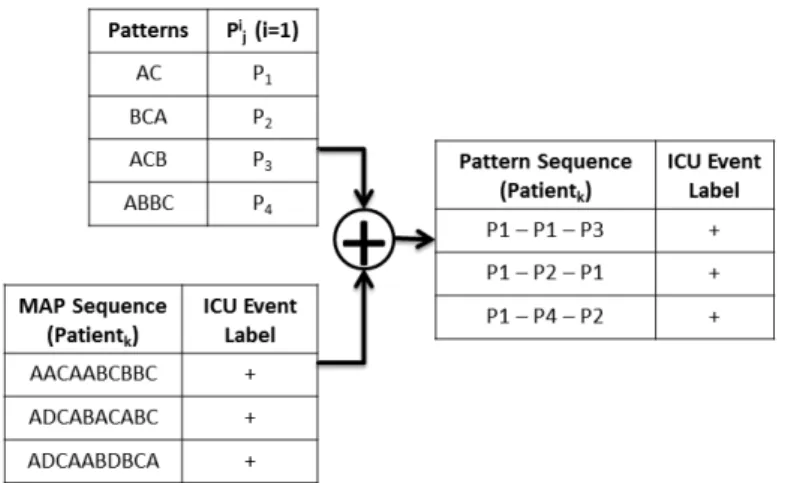
Figure 4: Encoding patient sequences using extracted patterns. Pi
j denotes a sequential pattern. Here,i=1
indicates a single channel or variable. A patient MAP sequence such asAACAABCBBC is converted to
P1−P1−P3. Finally, a new training set of pattern sequences is obtained.
For an HMM with two discrete states S1 and S2, let us have the state transition and
pattern emission probabilities are shown in Table I and Table II. In Figure 5, the state transition diagram is illustrated with output emissions and their probabilities.
Figure 5: Encoding patient sequences using extracted patterns. Pji denotes a sequential pattern. Here,i=1
indicates a single channel or variable. A patient MAP sequence such asAACAABCBBC is converted to
P1−P1−P3. Finally, a new training set of pattern sequences is obtained.
Table 1: Aindicates the state transition function for discrete statesS1 andS2
State Transition Function (A) S1 S2
S1 0.5 0.5
S2 0.7 0.3
Based on the described HMM model, a pattern sequence P1 − P1 − P3 (as shown in
Figure 4) is computed to have a likelihood estimate of 0.72. Accordingly, we classify this instance to be a positive pattern sequence, since its probability likelihood is greater than the threshold of 0.5. Maximum likelihood measures for each of the other pattern sequences are also estimated in a similar manner.
3.3.2. Coupled HMM for multichannel pattern sequences (MCP-CHMM)
For the example shown in Figure 4, we consider a single channel MAP sequence denoted byi inPi
j. Thus, in the context of parallel channels, each variable like HR and RR can have their corresponding set of patterns denoted by Pj2 and Pj3, for the example in Figure 4.
Therefore, for a given patient instance having three sets of sequential patterns given by
Pi
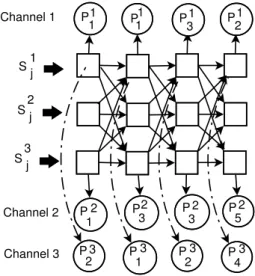
j, each variable (i.e MAP, HR or RR) sequence for a patient is converted to an ordered sequence of patternsPji, where the channel i= 1. . .3. Given the CHMM formulation, each discrete state for a particular channel now becomes a function of three states, based on the markov property. Thus, the state transition and emission probability functions can be realized, by mapping a permutation of three unique states (corresponding to each channel). This can be illustrated by the directed graph (DAG) shown as per Figure 6, where a single
Table 2: Bdenotes the emission probability distribution for 2 states and 4 pattern observations
Emission Distribution (B) P1 P2 P3 P4
S1 0.5 0.2 0.2 0.1
S2 0.7 0.1 0.05 0.15
edge from the previous state in each channel enters the next state of another channel. P1 1 P 1 1 P13 P12 P 2 1 P2 3 P 23 P 25 P 3 2 P 31 P 32 P 34 Channel 1 Channel 2 Channel 3 S1j S j 2 S j 3
Figure 6: A coupled HMM topology for 3 channels. Here,Pi
j denotes a sequential pattern. Here,i indicates
a channel andj corresponds to a specific pattern-id for a variable.
Here, Sji is a discrete hidden state for the channel i and j is the index of a state. Thus, figure 6 illustrates that the emission of a contrast pattern is probabilistically estimated by a a discrete state for that channel, which depends on three states at time tm−1. Here, tm indicates the current iteration at m for time t.
4. Evaluation
Our experimental plan begins with a description of the septic shock event prediction problem, followed by a brief description of the MIMIC-II database (our primary source for data collection). Next, we describe the clinical inclusion and exclusion criteria for the se-lection of patients. For baseline estimations, we employed SVM and HMM models on the continuous time series data for the given patients, using MAP (mean arterial pressure), HR (heart rate), and RR (respiratory rate). The baseline methods are denoted by SVM-MAP, HMM-MAP, HMM-HR, HMM-RR. Single channel patterns based HMM, for the three physi-ological variables are denoted by SCP-HMM-MAP, SCP-HMM-HR, SCP-HMM-RR. Finally, coupled HMM is employed, for both the multivariate continuous times series (CHMM) and multi-channel patterns (MCP-CHMM).
4.1. The Septic Shock Prediction Problem
Sepsis is a severe, systemic inflammatory response and is diagnosed when a patient has an infection (or evidence of an infection) that is associated with two or more of the following critera: (1) abnormal body temperature, (2) increased heart rate, (3) increased respiratory rate, or (4) abnormal white blood cell counts. Severe sepsis is defined as a sepsis associated with organ dysfunction, hypoperfusion, or hypotension. Septic shock is diagnosed when a
septic patient has a systolic blood pressure (SBP) <90 mmHg despite of a treatment of
>600 mL of fluid inputs in the last hour [24, 46].
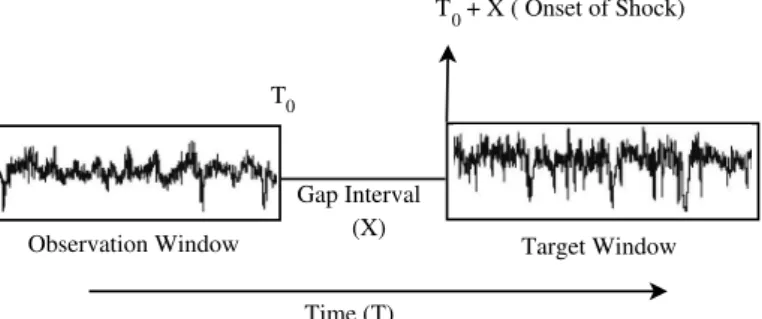
The problem of septic shock prediction can be simply illustrated by Figure 1.
Observation Window Target Window Gap Interval Time (T) T (X) T 0 0 + X ( Onset of Shock)
Figure 7: Observation and Target Windows with a Time Gap Interval
For this problem, we are given a test sample (e.g., a new patient) whose waveform data of an user-defined window of length 60 or 90 minutes have been observed and recorded till the time point T0, the goal is to predict whether a septic shock will happen to this patient
or not at a future target window of 30 minutes (namely, at the time window fromT0+X to
T0+X+ 30) through an HMM classifier. Usually, the observation and the target windows
are separated by an user-defined gap interval X of 30 and 60 minutes. The classifier is constructed using a set of training data. In this work, the classifier (prediction model) is constructed on three non-invasive channels of waveform signals of the patients in the training set. The three channels of waveform data are the commonly measured MAP, HR, and RR for every patient. This research problem is important because it is an early prediction of septic shock at a future time window with a gap interval of a half or one hour between the observation and the forecasting time window.
4.2. The MIMIC II Database
The MAP, HR, and RR waveform data used by this study were downloaded from the Multiparameter Intelligent Monitoring in Intensive Care II (MIMIC II) database which is a publicly available resource developed to support research in clinical decision support and critical care medicine [25]. MIMIC-II version 2.6 consists of clinical and waveform records for more than 30,000 ICU patients collected between 2001 and 2007. The electronic health database along with the waveform records, include numerous patient variables such as high resolution time-stamped physiological waveforms (e.g. blood pressure, heart rate etc.) and clinical variables (e.g. fluid input and output, laboratory tests, patient discharge notes etc.).
4.3. Selection of Patients
As the clinical inclusion criteria, our current study considered adults (i.e >18 years of age) from the MIMIC II database. Each patient consisted of at least one hour of observations for mean aerterial pressure (MAP), heart rate (HR), and respiration rate (RR).
ICD-9 codings were employed to identify septic patients (995.91 or 995.92). Patients with septic shock were identified by examining their clinical chart records. The time of
shock onset was determined using criteria used in [46]. Following from Shavdia et al [46], we define a hypotension observation as any time point where systolic blood pressure (SBP) was <90 mmHg. Consecutive hypotension observations were then aggregated to define a hypotension region. Total fluid intake for one hour prior to the first hypotension observation was then calculated. Any hypotension region that registered a total fluid intake>600 mL was classified as septic shock, with onset defined as the start time of the hypotensive region. Such a definition for shock onset follows the standard definition from [46]. For our experiments, we only considered the first detection of a septic shock onset to construct our observation periods. Towards this purpose, a total of 1,310 patients were diagnosed with sepsis or severe sepsis in MIMIC-II. Among these, 209 patients were diagnosed with a septic shock condition, given our inclusion criteria.
5. Prediction Results
The MIMIC-II database is a publicly accessible resource, subject to an appropriate NIH certification, which consists of >30000 ICU patient records and has been traditionally em-ployed for demonstrating the performance of novel algorithms on benchmarked datasets for critical care applications. The patient records include numerous clinical variables such as laboratory test values, physiological measures, textual notes, medication records and physi-ological waveform signals, mapped to each patient identifier by a unique value.
5.1. Four data sets extracted from MIMIC-II
The sequential contrast patterns CHMM framework was applied to multiple septic shock datasets, based on the data descriptions provided in section 4.3. Accordingly, the total number of samples with sepsis (ICD9 code - 995.91 or 995.92) were found to be 1310. Among these, the number of patients which moved over to a septic shock condition (identified by ICD9 code 785.52) were found to be 209. Thus, our main patient dataset consisted of 209 positive instances and 1101 negative instances. Further, the MIMIC variables extracted for use were mean arterial pressure (MAP), heart rate (HR) and respiratory Rate (RR) for each of the extracted records.
Later, 4 datasets were constructed based on a combination of two factors as given below
• where the gap interval is 30 or 60 minutes, and
• where the observation window is 60 or 90 minutes. See 4.1.
Thus, we have 4 datasets, where each record is defined by a 30 or 60 minutes gap interval, following a 60 or 90 minutes observation window. The allotted time windows are standard references associated with short term ICU prediction problems and is similar to [45]. For our experiments, we only considered the first detection of a septic shock onset to construct our observation periods.
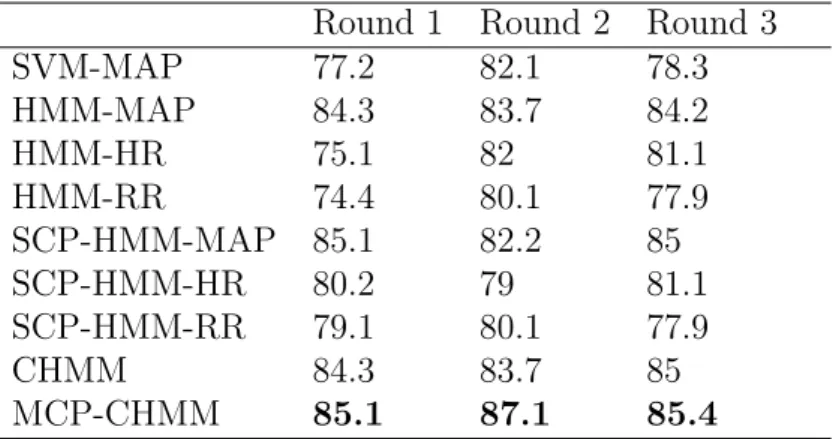
Table 3: A comparison of different models using 5-fold CVA attgap= 60 mins andtobs= 60 mins
Round 1 Round 2 Round 3
SVM-MAP 77.2 82.1 78.3 HMM-MAP 84.3 83.7 84.2 HMM-HR 75.1 82 81.1 HMM-RR 74.4 80.1 77.9 SCP-HMM-MAP 85.1 82.2 85 SCP-HMM-HR 80.2 79 81.1 SCP-HMM-RR 79.1 80.1 77.9 CHMM 84.3 83.7 85 MCP-CHMM 85.1 87.1 85.4
5.2. Cross-validation classification results on the four data sets
A number of previous studies have been carried out for predicting the risk of sepsis and septic shock. These studies largely focus on pre-selected sets of clinical patient features. As these features significantly differ from one study to another, there does not exist any accepted gold standard which we could adapt for evaluating the performances of the models. For this work, we employed multiple rounds of 5-fold cross validation to assess our models’ performance.
For each of these four datasets, the 5-fold cross validation was performed for three rounds. At each round, the 5 different folds were randomly selected as a test set to obtain the corresponding 5-fold cross validation classification accuracy (CVA). In each round, we also used the records’ observation window to train the model of support vector machines (SVMs), single-variable hidden markov models and coupled hidden markov models. Our three rounds of 5-fold cross validation results for each model are presented at Table I to IV for the four datasets.
In detail, each Table (I to IV) records the 5 fold cross validation classification accuracy performance among 9 different types of variable and learning model combinations. These include a machine learning SVM for the MAP variable for estimating baseline performance followed by single channel HMM models for each of HR, RR and MAP respectively. These models are then compared to the HMMs of sequential contrast patterns for single variables (HR, BP and RR). Finally, we consider CHMM models using both the continuous multivari-ate and discretised sequential contrast patterns. Also, each of the four tables progressively reports the CVA performances with different combinations of observation window length and gap interval (for each of the four dataset, respectively).
5.3. Predicting Coupled Discrete Sequences using HMMs: An Illustrative Case Study
A case study is used to demonstrate the prediction of a specific multivariate test sequence using our proposed CHMM framework. The given multivariate instance is composed of three variables, namely the mean arterial pressure, heart rate and respiratory rate. Initially the sequences of continuous time series data were converted to their discretised representations. Thus, each observation test sequence consists of 60 time points for each variable, where
Table 4: A comparison of different models using 5-fold CVA attgap= 30 mins andtobs= 60 mins
Round 1 Round 2 Round 3
SVM-MAP 77.2 82.4 77.1 HMM-MAP 84.7 83.7 84.2 HMM-HR 75.5 82.0 81.1 HMM-RR 74.4 81.0 77.9 SCP-HMM-MAP 85.5 82.7 83 SCP-HMM-HR 80.2 79.1 81.1 SCP-HMM-RR 79.1 80.1 76.9 CHMM 85.0 84.7 85.3 MCP-CHMM 86 87.1 84.8
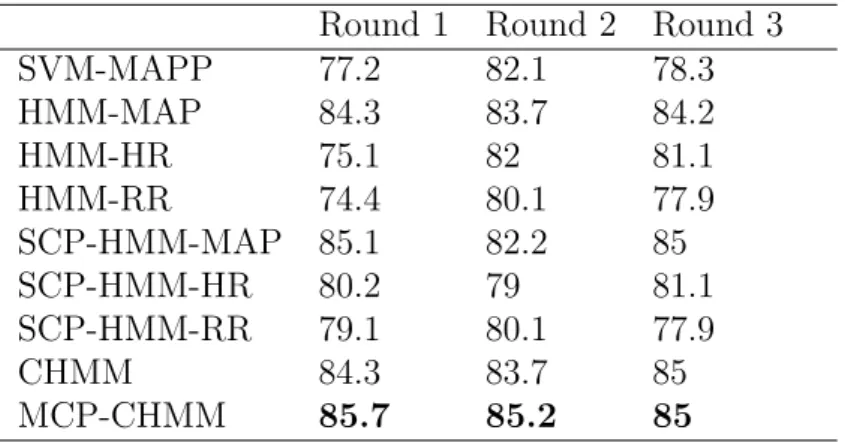
Table 5: A comparison of different models using 5-fold CVA attgap= 30 mins andtobs= 90 mins
Round 1 Round 2 Round 3
SVM-MAPP 77.2 82.1 78.3 HMM-MAP 84.3 83.7 84.2 HMM-HR 75.1 82 81.1 HMM-RR 74.4 80.1 77.9 SCP-HMM-MAP 85.1 82.2 85 SCP-HMM-HR 80.2 79 81.1 SCP-HMM-RR 79.1 80.1 77.9 CHMM 84.3 83.7 85 MCP-CHMM 85.7 85.2 85
Table 6: A comparison of different models using 5-fold CVA attgap= 60 mins andtobs= 90 mins
Round 1 Round 2 Round 3
SVM-MAPP 77.2 82.1 78.3 HMM-MAP 84.3 83.7 84.2 HMM-HR 75.1 82 81.1 HMM-RR 74.4 80.1 77.9 SCP-HMM-MAP 85.1 82.2 85 SCP-HMM-HR 80.2 79 81.1 SCP-HMM-RR 79.1 80.1 77.9 CHMM 84.3 83.7 85 MCP-CHMM 85.1 85.5 85
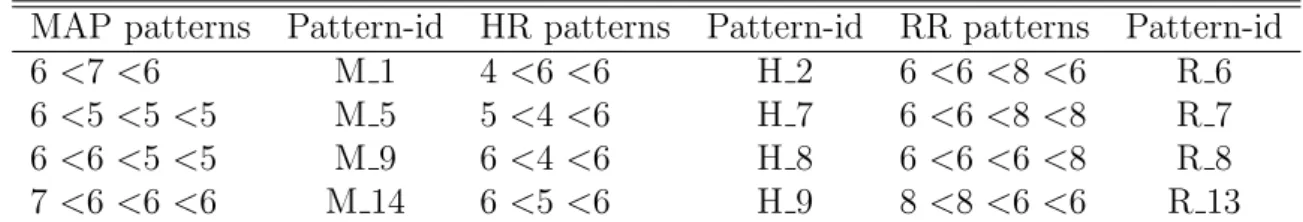
the time-stamped value is converted to a discrete symbol belonging to a set of pre-defined symbols. Each of these discretised sequences was then truncated internally, by reducing a consecutive sequence of 3 similar symbols to 1 symbol. This is because long runs of similar symbols lead to significantly more computational time and have less interpretative value in a clinical context. Some of the sequential contrast patterns that appeared in the given discretized training signals are as shown in Table VI. For each of the discretised signals, we employed a sliding window to move through the given sequence. Subsequently, the existence of patterns in the consecutive passes of the window was used to build a pattern sequence, as shown in Table V. Each pattern is uniquely encoded for each variable´s contrast pattern set. For example, the M1 pattern uniquely identifies the sequence 6<7<6 only for instances of
the mean arterial pressure. In Table VI, we list some of the prominent contrast sequences, which can be found within the variable sequences of Table V. Note that Table VI is a subset of the larger set of contrast patterns. In addition to the contrast patterns, we also consider a “dont-care” pattern denoted by X. Multiples of “dont-care” patterns are inserted at the end of a pattern sequence, so that every variable´s pattern sequence has the same length.
Table 7: A multivariate (MAP, HR, RR) discrete patient sequence composed of an ordered series of contrast patterns
Discretised Sequence Variable Name Sequence of Patterns
6-6-6-6-7-6-6-6-6-6-6-6-6-6-6-7-6-6-6-6-6-6-6-6-6-6- MAP M 1 - M 14 - M 1 - M 14 - M 5 - M 9 - X - X 6-6-6-6-6-6-6-6-6-6-6-6-5-5-5-5-5-5-5-5-5-5-5-5-5-5-5-5-5-5-5-5-5-5 4-5-5-5-5-5-4-6-6-6-6-6-5-6-6-6-6-6-6-6-6-5-6-6-6- HR H 7 - H 2 - H 9 - H 9 - H 8 - H 2 - H 9 - H 9 6-6-6-4-6-6-6-6-5-6-6-6-6-6-6-5-6-5-5-5-5-6-6-6-6-6 -6-6-6-6-6-6-6-6-6 6-6-6-6-6-6-6-6-6-6-6-6-6-6-6-6-6-8-8-8-6-6-6-6 RR R 7 - R 7 - R 8 - R 13 - X - X - X - X -8-8-8-8-6-6-6-6-6-6-6-6-6-6-6-6-5-5-5-5-5-5-5-5-5-5-5-5-5-5-5-5-5-5-5-5
Table 8: Visualizing contrast sequence patterns matching the three variables MAP, HR and RR
MAP patterns Pattern-id HR patterns Pattern-id RR patterns Pattern-id 6 <7 <6 M 1 4 <6 <6 H 2 6 <6 <8<6 R 6 6 <5 <5 <5 M 5 5 <4 <6 H 7 6 <6 <8<8 R 7 6 <6 <5 <5 M 9 6 <4 <6 H 8 6 <6 <6<8 R 8 7 <6 <6 <6 M 14 6 <5 <6 H 9 8 <8 <6<6 R 13
The likelihood for this discrete multivariate test sequence was estimated at the level of 0.71 by CHMM. As we assumed the likelihood threshold for differentiating between a positive and negative classification as 0.5, the given multivariate test sequence was predicted to be a positive case, i.e the given patient multivariate sequence was classified as ‘having a higher risk for the occurrence of a septic shock’. It is also worth noting that converting multivariate discrete sequences to a multivariate time series of contrast patterns, allows an HMM to exploit the order (or offset) information among the patterns, which are crucial for making a robust HMM based prediction.
5.4. Discussion
The experimental results have evidenced that integrating sequential contrast patterns with CHMM models can help provide a robust assessment of septic shock risk. We note that for the same physiological variables, baseline models like SVM and single channel HMMs using continuous variables, report standard performances within the range of 77-84% CVA. However, for the single variable HMMs, the CVA performance tends to be higher for MAP. This is due to MAP being the primary physiological signal used to decide the onset of a septic shock. The discrete sequence single channel HMMs generally post similar CVA performances, with minor variations across the training groups. In the case of a coupled model using continuous MAP, we note that the CVA performance is significantly better than the single variable HMM MAP. However, the continuous CHMM does not necessarily improve upon the discrete single channel HMM using MAP. Finally, it can be seen that a coupled HMM, which considers contrast sequences from multiple physiological variables, tends to have marginally better CVAs than both continuous coupled models as well as single channel discrete HMM models. Our simulations also demonstrate that varying the gap interval size (within the range of 3 to 5) can affect the prediction performance, and that increasing the size of the observation window does not seem to improve the performance of the training models.
Interestingly, we note that HMM models that were trained using sequences of contrast patterns generally outperformed models which used raw continuous signals only. This sug-gests that a patient’s signal trajectory towards sepsis-related complications and significant episodes after ICU admission, can help determine a dynamically evolving patient state. Be-ing able to use a set of discrete episodes to construct a meanBe-ingful observation sequence and then using sequential learning models to predict ICU events like septic shock, hold greater value both in terms of clinical interpretation of episodes as well as in the construction of robust prediction models.
As described, pattern based CHMM models outperform simple measures like APACHE-III, SVM models, neighborhood-based imputation techniques described in [45]. Previously, Ho et al [45] had demonstrated the application of forward and backward selection strategies using EWS feature matrices to obtain accuracies in the range of 72-78%. Our results at 60 minutes of gap interval using discretized patterns and CHMM, also post comparatively similar performances. The results also demonstrate that the integration of coupled HMM with discrete sequential patterns provide better performance, in comparison to using HMM models on continuous variables. Further, it can be said that sequential contrast patterns have interpretive significance, such that a sequence of patterns, when used to describe a variable sequence encodes it into a set of episodes in a sequence. This sequence of episodes clearly allows the CHMM model to perform well in comparison to the direct use of models on continuous time series data.
Results show that our models can predict septic shock events using time series of contrast patterns, which have comparative performances as earlier models. However, one must note that the application of complex septic shock models and the acceptable detection rates in actual practice have been limited to the use of traditional clinical measures like APACHE-III. Integrating sequential patterns using a CHMM, allow us to capture interactions among
discrete patterns of physiological variables, which are useful for predicting labels for patient sequences. For this study, our models were trained using a set of contrast patterns favouring positive instances i.e patients having septic shock. However, there may be certain sequences where the CHMM probabilities are marginally greater or lesser than the user-defined thresh-old, to be labelled as a positive instance. Therefore, it is necessary to also explore models which can deal with predicting instances on the fringe regions of a probability threshold. Accordingly, these cases can be difficult to detect and require further studies.
6. Conclusion
In this study, we have presented a novel integrated framework, consisting of sequential contrast patterns with coupled hidden markov models (CHMM) to predict ICU events like the onset of a septic shock. The method involves the determination of contrast sequences from differentially labelled multivariate patient populations and the method then employs a generalised coupled modelling process for multiple channels of time series of contrast pat-terns. In turn, the CHMM model allows us to account for interactions among patterns from different channels or variables. To verify the effectiveness of pattern sequences, we compared our method with the traditional SVM and continuous single variable HMM counterparts. These methods were all tested using datasets extracted from the MIMIC-II database. Our results demonstrate that the learning models, which account for position or order information among sequential patterns, tend to perform well in comparison to models not exploiting such information. Hence, the current study emphasizes on the integration of meta-information about patterns and intermediate relationships, such as sequence ordering, to improve the performance of sequential learning models.
Thus, the current study demonstrates the importance of training ICU classifier models using informative sequential patterns, in addition to conventional clinical measures. Accord-ingly, the use of sequential patterns to encode discretised sequences, allows easier handling of large scale noisy data commonly encountered in modern clinical studies. Hence, the rec-ommended septic shock prediction framework employing discrete sequential patterns, can provide ICU care systems a novel clinical pattern discovery platform to improve patient outcomes.
Acknowledgment
This work was partly supported by Australia Research Council Discovery Project (DP130102124). Shameek Ghosh is supported by the Dr A.P.J. Abdul Kalam & UTS Doctoral Scholarship,
Australia.
References
[1] D. C. Angus, T. Van Der Poll. Severe sepsis and septic shock. New England Journal of Medicine, 369(9), 840-851, 2013.
[2] Yeh, R.W., Sidney, S., Chandra, M., Sorel, M., Selby, J.V. and Go, A.S., 2010. Population trends in the incidence and outcomes of acute myocardial infarction. New England Journal of Medicine, 362(23), pp.2155-2165.
[3] Torio, Celeste M and Andrews, Roxanne M, 2013. National inpatient hospital costs: the most expensive conditions by payer, 2011. Agency for Health Care Policy and Research (US).
[4] Rivers, E., Nguyen, B., Havstad, S., Ressler, J., Muzzin, A., Knoblich, B., Peterson, E. and Tomlanovich, M., 2001. Early goal-directed therapy in the treatment of severe sepsis and septic shock. New England Journal of Medicine, 345(19), pp.1368-1377.
[5] Capp, R., Horton, C.L., Takhar, S.S., Ginde, A.A., Peak, D.A., Zane, R. and Marill, K.A., 2015. Predictors of Patients Who Present to the Emergency Department With Sepsis and Progress to Septic Shock Between 4 and 48 Hours of Emergency Department Arrival*. Critical care medicine, 43(5), pp.983-988.
[6] Henry, K.E., Hager, D.N., Pronovost, P.J. and Saria, S., 2015. A targeted real-time early warning score (TREWScore) for septic shock. Science Translational Medicine, 7(299), pp.299ra122-299ra122.
[7] E. Rivers, B. Nguyen, S. Havstad, J. Ressler, A. Muzzin, B. Knoblich, E. Peterson, and M. Tomlanovich. Early Goal-Directed Therapy in the Treatment of Severe Sepsis and Septic Shock. New England Journal of Medicine, 345(19):13681377, 2001.
[8] Moskovitch, R., Walsh, C., Wang, F., Hripcsak, G. and Tatonetti, N., 2015, November. Outcomes Prediction via Time Intervals Related Patterns. In Data Mining (ICDM), 2015 IEEE International Conference on (pp. 919-924). IEEE.
[9] Batal, I., Fradkin, D., Harrison, J., Moerchen, F. and Hauskrecht, M., 2012, August. Mining recent temporal patterns for event detection in multivariate time series data. In Proceedings of the 18th ACM SIGKDD international conference on Knowledge discovery and data mining (pp. 280-288). ACM. [10] Yang, J., McAuley, J., Leskovec, J., LePendu, P. and Shah, N., 2014, April. Finding progression stages
in time-evolving event sequences. In Proceedings of the 23rd international conference on World wide web (pp. 783-794). ACM.
[11] Sacchi, L., Dagliati, A. and Bellazzi, R., 2015. Analyzing complex patients temporal histories: new frontiers in temporal data mining. Data Mining in Clinical Medicine, pp.89-105.
[12] H. Cheng, X. Yan, J. Han, C. W. Hsu, Discriminative frequent pattern analysis for effective classifi-cation, In IEEE 23rd International Conference on Data Engineering. ICDE 2007, (pp. 716-725). IEEE, 2007.
[13] J. Klema, L. Novakova, F. Karel,O. Stepankova, Sequential data mining: A comparative case study in development of atherosclerosis risk factors, Systems, Man, and Cybernetics, Part C: Applications and Reviews, IEEE Transactions on, 38(1), 3-15, 2008.
[14] E. Baralis, G. Bruno, S. Chiusano, V. C. Domenici, N. A. Mahoto, C. Petrigni, Analysis of medical pathways by means of frequent closed sequences, In Knowledge-Based and Intelligent Information and Engineering Systems (pp. 418-425), 2010.
[15] M. Berlingerio, F. Bonchi, F. Giannotti, F. Turini, Time-annotated sequences for medical data mining. In Seventh IEEE International Conference on Data Mining Workshops, (pp. 133-138), 2007, IEEE. [16] D. Patnaik, P. Butler, N. Ramakrishnan, L. Parida, B. J. Keller, D. A. Hanauer, Experiences with
mining temporal event sequences from electronic medical records: initial successes and some challenges. In Proceedings of the 17th ACM SIGKDD international conference on Knowledge discovery and data mining (pp. 360-368), 2011, ACM.
[17] L. Sacchi, C. Larizza, C. Combi, R. Bellazzi, Data mining with temporal abstractions: learning rules from time series. Data Mining and Knowledge Discovery, 15(2), 217-247, 2007.
[18] R. Moskovitch, Y. Shahar, Classification-driven temporal discretization of multivariate time series. Data Mining and Knowledge Discovery, 1-43, 2014.
[19] F. Hoppner, S. Peter, Temporal interval pattern languages to characterize time flow. Wiley Interdisci-plinary Reviews: Data Mining and Knowledge Discovery, 4(3), 196-212, 2014.
[20] I. Batal, H. Valizadegan, G. F. Cooper, M. Hauskrecht, A temporal pattern mining approach for classifying electronic health record data, ACM Transactions on Intelligent Systems and Technology (TIST), 4(4), 63, 2013.
[21] I. Batal, G. F. Cooper, D. Fradkin, J. Harrison Jr, F. Moerchen, M. Hauskrecht, An efficient pattern mining approach for event detection in multivariate temporal data, Knowledge and Information Systems,
1-36, 2015.
[22] F. Wang, N. Lee, J. Hu, J. Sun, S. Ebadollahi, A. F. Laine, A framework for mining signatures from event sequences and its applications in healthcare data, Pattern Analysis and Machine Intelligence, IEEE Transactions on, 35(2), 272-285, 2013.
[23] G. Dafe, A. Veloso, M. Zaki, W. Meira Jr, Learning sequential classifiers from long and noisy discrete-event sequences efficiently, Data Mining and Knowledge Discovery, 1-24, 2014.
[24] R. C. Bone, R. A. Balk, F. B. Cerra, R. P. Dellinger, A. M. Fein, W. A. Knaus, R. M. Schein, and W. J. Sibbald. Definitions for sepsis and organ failure and guidelines for the use of innovative therapies in sepsis. The ACCP/SCCM Consensus Conference Committee. American College of Chest Physicians/Society of Critical Care Medicine. Chest, 101(6):16441655, 1992.
[25] M. Saeed, M. Villarroel, A.T. Reisner, G. Clifford, L.W. Lehman, G. Moody et al., Multiparameter Intelligent Monitoring in Intensive Care II (MIMIC-II): a public-access intensive care unit database, Critical care medicine, 39(5), 952, 2011.
[26] Z. Syed, C. Stultz, M. Kellis, P. Indyk, J. Guttag, Motif discovery in physiological datasets: a method-ology for inferring predictive elements, ACM Transactions on Knowledge Discovery from Data (TKDD), 4(1), 2, 2010.
[27] J. Lin, E. Keogh, S. Lonardi, B. Chiu, A symbolic representation of time series, with implications for streaming algorithms, In Proceedings of the 8th ACM SIGMOD workshop on Research issues in data mining and knowledge discovery, (pp. 2-11), 2003.
[28] G. Dong, J. Li, Efficient mining of emerging patterns: Discovering trends and differences, In Proceedings of the fifth ACM SIGKDD international conference on Knowledge discovery and data mining, (pp. 43-52), 1999.
[29] X. Ji, J. Bailey, G. Dong, Mining minimal distinguishing subsequence patterns with gap constraints, Knowledge and Information Systems, 11(3), 259-286, 2007.
[30] Rezek, I., & Roberts, S. J. (2000). Estimation of coupled hidden Markov models with application to biosignal interaction modelling. In NEURAL NETWORKS SIGNAL PROCESS PROC IEEE (Vol. 2, pp. 804-813).
[31] Zhou, H., Chen, J., Dong, G., Wang, H., & Yuan, H. (2015). Bearing fault recognition method based on neighbourhood component analysis and coupled hidden Markov model. Mechanical Systems and Signal Processing.
[32] Audhkhasi, K., Osoba, O., & Kosko, B. (2013, August). Noisy hidden Markov models for speech recognition. In Neural Networks (IJCNN), The 2013 International Joint Conference on (pp. 1-6). IEEE. [33] Cao, L., Ou, Y., & Yu, P. S. (2012). Coupled behavior analysis with applications. Knowledge and Data
Engineering, IEEE Transactions on, 24(8), 1378-1392.
[34] Zhong, S., Ghosh, J. (2002, May). HMMs and coupled HMMs for multi-channel EEG classification. In Proceedings of the IEEE International Joint Conference on Neural Networks (Vol. 2, pp. 1254-1159). [35] Kristjansson, T. T., Frey, B. J., Huang, T. S. (2000). Event-coupled hidden Markov models. In
Mul-timedia and Expo, 2000. ICME 2000. 2000 IEEE International Conference on (Vol. 1, pp. 385-388). IEEE.
[36] Mooney, C. H., Roddick, J. F. (2013). Sequential pattern mining–approaches and algorithms. ACM Computing Surveys (CSUR), 45(2), 19.
[37] Shen, W., Wang, J., Han, J. (2014). Sequential Pattern Mining. In Frequent Pattern Mining (pp. 261-282). Springer International Publishing.
[38] Li, W., Han, J., Pei, J. (2001). CMAR: Accurate and efficient classification based on multiple class-association rules. In Data Mining, 2001. ICDM 2001, Proceedings IEEE International Conference on (pp. 369-376). IEEE.
[39] Cheng, H., Yan, X., Han, J., Yu, P. S. (2008, April). Direct discriminative pattern mining for effective classification. In Data Engineering, 2008. ICDE 2008. IEEE 24th International Conference on (pp. 169-178). IEEE.
[40] D. Fradkin, F. Morchen (2015). Mining sequential patterns for classification. Knowledge and Informa-tion Systems, 1-19.
[41] Zaki, M. J., Carothers, C. D., & Szymanski, B. K. (2010). VOGUE: A variable order hidden markov model with duration based on frequent sequence mining. ACM Transactions on Knowledge Discovery from Data (TKDD), 4(1), 5.
[42] J. Ayres, J. Flannick, J. Gehrke, T. Yiu, Sequential pattern mining using a bitmap representation, In Proceedings of the eighth ACM SIGKDD international conference on Knowledge discovery and data mining (pp. 429-435), 2002.
[43] S. Chan, B. Kao, C. L. Yip, M. Tang, Mining emerging substrings. In Eighth International Conference on Database Systems for Advanced Applications, (pp. 119-126), 2003.
[44] Z. Xing, J. Pei, E. Keogh, A brief survey on sequence classification, ACM SIGKDD Explorations Newsletter, 12(1), 40-48, 2010.
[45] J. C. Ho, C. H. Lee, J. Ghosh, Septic shock prediction for patients with missing data, ACM Transactions on Management Information Systems, 5(1), 1, 2014.
[46] D. Shavdia, Septic shock: Providing early warnings through multivariate logistic regression models, Doctoral dissertation, Massachusetts Institute of Technology, 2007.
[47] F. Gwadry-Sridhar, B. Lewden, S. Mequanint, M. Bauer, Comparison of Analytic Approaches for Determining Variables-A Case Study in Predicting the Likelihood of Sepsis. HEALTHINF, pp. 90-96, 2009.
[48] C. H. Tang, P. M. Middleton, A. V. Savkin, G. S. Chan, S. Bishop, N. H. Lovell, Non-invasive classifi-cation of severe sepsis and systemic inflammatory response syndrome using a nonlinear support vector machine: a preliminary study. Physiological measurement, 31(6), 775, 2010.
[49] R. A. Lukaszewski, A. M. Yates, M. C. Jackson, K. Swingler, J. M. Scherer, A. J. Simpson et al., Presymptomatic prediction of sepsis in intensive care unit patients, Clinical and Vaccine Immunology, 15(7), 1089-1094, 2008.
[50] S. W. Thiel, J. M. Rosini, W. Shannon, J. A. Doherty, S. T. Micek, M. H. Kollef, M. H, Early prediction of septic shock in hospitalized patients. Journal of Hospital Medicine, 5(1), 19-25, 2010.
[51] R. D. Pereira, R. J. Almeida, U. Kaymak, S. M. Vieira, J. Sousa et al., Predicting septic shock outcomes in a database with missing data using fuzzy modeling: Influence of pre-processing techniques on real-world data-based classification. In Fuzzy Systems (FUZZ), 2011 IEEE International Conference on (pp. 2507-2512), 2011.
[52] A. S. Fialho, F. Cismondi, S. M. Vieira, J. a. M. C. Sousa, S. R. Reti, M. D. Howell, and S. N. Finkel-stein. Predicting Outcomes of Septic Shock Patients Using Feature Selection Based on Soft Computing Techniques. In Information Processing and Management of Uncertainty in Knowledge-Based Systems. Applications, volume 81 of Communications in Computer and Information Science, pages 6574. Springer Berlin Heidelberg, 2010.
[53] J. Paetz. Knowledge-based approach to septic shock patient data using a neural network with trape-zoidal activation functions. Artificial Intelligence in Medicine, 28(2):207230, 2003.
[54] McGarry, K. (2005). A survey of interestingness measures for knowledge discovery. Knowledge Eng. Review, 20(1), 39-61.
[55] Novak, P. K., Lavra, N., & Webb, G. I. (2009). Supervised descriptive rule discovery: A unifying survey of contrast set, emerging pattern and subgroup mining. The Journal of Machine Learning Research, 10, 377-403.
[56] Fang, G., Pandey, G., Wang, W., Gupta, M., Steinbach, M., & Kumar, V. (2012). Mining low-support discriminative patterns from dense and high-dimensional data. Knowledge and Data Engineering, IEEE Transactions on, 24(2), 279-294.