Jaume Benseny Quintana
School of Electrical Engineering
Thesis submitted for examination for the degree of Master of Science in Technology.
Espoo 18.04.2016
Thesis supervisor and advisor:
Author: Jaume Benseny Quintana
Title: Assessment of wireless solutions in emerging broadband markets
Date: 18.04.2016 Language: English Number of pages: 9+53
Department of Communications and Networking COMNET
Professorship: Network Economics
Supervisor and advisor: Prof. Heikki Hämmäinen
Although broadband markets have grown steadily since the advent of the mobile Internet, penetration levels for developing countries are far from reaching the ordinary citizen. This thesis analyses three hypotheses as bottlenecks to the growth of emerging mobile broadband markets: (i) the low competence of users, (ii) the low quality of service, (iii) the high access price and, based on the results, alternative wireless solutions are studied to accelerate the Internet diffusion.
Bottleneck hypotheses are evaluated through a quantitative bottleneck analysis that includes measured mobile QoS levels and macroeconomic indicators from a total of 9 cities including emerging (6) and advanced markets (3).
Provided that low quality of service and data prices are identified as the main bottlenecks, a qualitative value network analysis evaluates wireless access technologies, caching technologies, collaborative business environments and, operator revenue models seeking a cost-effective solution.
As a result, the thesis concludes that the affordability of broadband Internet is lim-ited, in the first place, by the least cost-effective network technology (network costs need to be minimized), secondly by the level of competition in the market (profits of operators need to be minimized), and finally by business models of operators which could include subsidies from advertisers, content providers, governments, or implement a freemium model (access prices are minimized).
Keywords: Broadband market, Scalable Networks, Affordable Internet, Wireless Access, Alternative Networks
Preface
I want to thank Professor Heikki Hämmäinen for his dedicated help and guidance.
I am also grateful to the Network Economics team for their friendship and advice: to Benjamin who introduced me to the SCALA programming language, to Alexandr for his supervision as tutor, to Tapio who taught me how to design value networks, to Arturo for his pro-activeness and support, to Nancy for referring me to the best sources, and to Joonas and Kalevi.
Finally, this thesis would have not been possible without the decisive and encour-aging support of Sonja and both my Catalan and Finnish families.
Otaniemi, 18.04.2016
Contents
Abstract ii Preface iii Contents iv Abbreviations vi 1 Introduction 1 1.1 Motivation . . . 1 1.2 Research Questions . . . 1 1.3 Scope of Research . . . 2 1.4 Research Methods. . . 3 1.5 Structure of Thesis . . . 4 2 Literature Review 5 2.1 Enablers of International Internet Capacity . . . 52.1.1 Satellite Network Technologies . . . 5
2.1.2 Submarine and Terrestrial Fiber Technologies . . . 6
2.1.3 Comparison between Satellite and Fiber Technologies . . . 7
2.2 Enablers of Wireless Last-mile Internet . . . 8
2.2.1 IEEE Wireless Technologies in Unlicensed Frequencies . . . . 8
2.2.2 3GPP Wireless Technologies in Licensed Frequencies . . . 9
2.2.3 Comparison between IEEE and 3GPP Wireless Technologies . 11 2.3 Enablers of Digital Content . . . 14
2.3.1 IXPs, Caches, and Content Delivery Networks . . . 14
2.3.2 Caching in Mobile Networks . . . 15
2.3.3 Content Cacheability . . . 15
2.4 Enablers of Internet Affordability . . . 16
2.4.1 Role of Competition and Regulation . . . 16
2.4.2 Mobile Virtual Network Operators . . . 17
2.4.3 Open Access . . . 17
2.4.4 Network Ecosystem KPIs for an Affordable Internet . . . 17
2.5 Results . . . 18
3 Statistical Analysis of Wireless Last-mile Internet Capacity 20 3.1 Netradar Platform . . . 20
3.2 City and Country Selection . . . 20
3.3 Netradar Data Extraction . . . 20
3.4 Netradar Dataset Basic Statistics . . . 21
3.5 Estimation of Available Capacity . . . 22
4 Bottleneck Analysis 25
4.1 Methodology and Bottleneck Hypotheses . . . 25
4.2 Model of Mobile Broadband Market . . . 25
4.3 Identification of Dominant Bottleneck . . . 26
4.4 User Competence Bottleneck . . . 27
4.4.1 Level of User Competence . . . 28
4.4.2 Device Features . . . 29
4.5 Pricing Bottleneck . . . 29
4.5.1 Mobile Prices and Subscription Levels . . . 29
4.5.2 Market Competition and Regulation . . . 30
4.6 Capacity Bottleneck . . . 32
4.6.1 Mobile Internet Available Capacity . . . 32
4.6.2 Analysis of App Requirements . . . 33
4.7 City Analysis and Comparison . . . 33
4.8 Results . . . 34
5 Value Network Analysis 35 5.1 Value Network Analysis Research . . . 35
5.2 Value Network Analysis Method . . . 35
5.3 Value Network Analysis . . . 35
5.3.1 Techno-economic context . . . 37 5.3.2 WISP-driven VNC . . . 39 5.3.3 Community-driven VNC . . . 40 5.3.4 MNO-driven VNC . . . 41 5.3.5 Comparison between VNCs . . . 42 5.4 Results . . . 43 6 Conclusions 44 6.1 Results . . . 44 6.2 Results Assessment . . . 45 6.3 Future Research . . . 46 References 47
A Bottleneck chain diagram 51
Abbreviations
3GPP 3rd Generation Partnership Project ARPU Average Revenue Per User
BH Backhaul portion of a network BHO Backhaul Operator
BS Base Station
CAGR Compound Annual Growth Rate CAPEX Capital Expenditure
CDI Critical Design Issue
CDMA-CA Carrier sense Multiple Access with Collision Avoidance CDN Content Delivery Network
CFI Competition Framework Index CPE Customer Premises Equipment
CN Community Network
DSL Digital Subscription Loop
DVB-S2 Digital Video Broadcasting - Second Generation DWDM Dense Wavelength Division Multiplexing
EDFA Erbium Doped Fiber Amplifiers
ETSI European Telecommunications Standards Institute FH Fronthaul portion of a network
FSS Fixed Satellite Services
GAIA The Global Access to the Internet for All GGC Google Global Cache
GNI p.c. Gross National Income per capita HHI Herfindahl-Hirschman Index HTTP Hypertext Transfer Protocol HTTPS HTTP Secure
HTS High-Throughput satellite Services KPI Key Performance Indicator
OFDM Orthogonal Frequency-Division Multiplexing OFDMA Orthogonal Frequency-Division Multiple Access QoS Quality of Service
ICT Information and Communication Technologies IDI ICT development Index
IIB Internet International Bandwidth IP Internet Protocol
IRTF Internet Research Task Force
IEEE Institute of Electrical and Electronics ISM Industrial, Scientific and Medical ISP Internet Service Provider
INFODEV Information for Development Program ITU International Telecommunication Union
ITU-R International Telecommunication Union - Radiocommunications IXP Internet eXchange Point
LEO Low Earth Orbit satellite LTE Long Term Evolution
NO Network Operator
OCDE Organisation for Economic Co-operation and Development OPEX Operational Expenditure
OTT Over The Top content providers PSN Publish and Subscribe Networking
RIFE architectuRe for an Internet For Everybody ROI Return on Investment
RTT Round Trip Time SMS Short Message Service
SONET Synchronous Optical Networking SP Service Provider
TCP Transmission Control Protocol TLS Transport Layer Security Protocol UE User Equipment
UHF Ultra High Frequency UN United Nations VHF Very High Frequency VNA Value Network Analysis VNC Value Network Configuration VNO Virtual Network Operator VOD Video On Demand service VOIP Voice Over IP service WI-FI "Wireless Fidelity"
WIMAX Worldwide Interoperability for Microwave Access WISP Wireless Internet Service Provider
List of Figures
1 Structure of Thesis . . . 4
2 RTT reduction in a transition from satellite to terrestrial connection in Kenya [15] . . . 6
3 LTE Network Architecture [22] . . . 10
4 Functional split between E-UTRAN and EPC in LTE [22] . . . 11
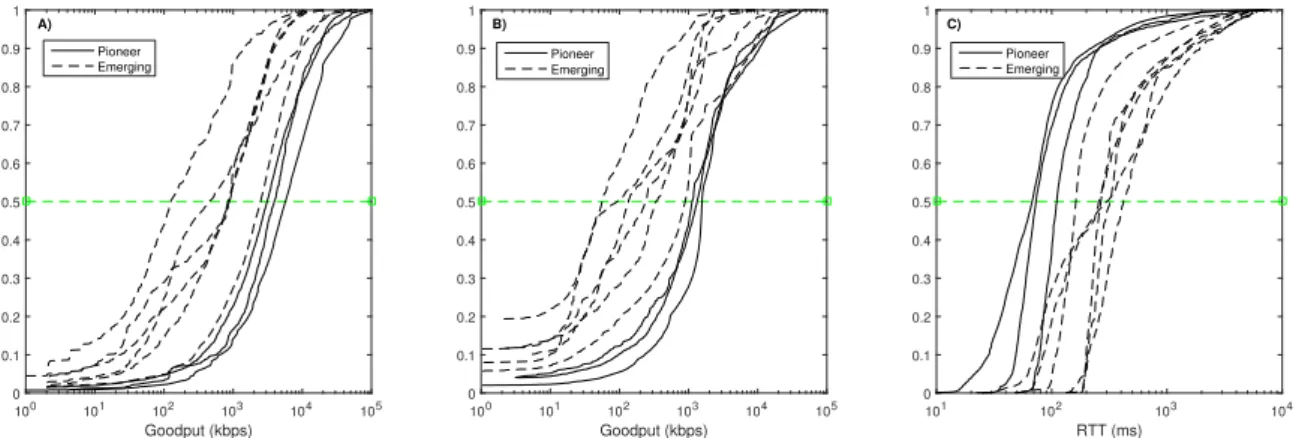
5 CDFs of Network Values for Advanced mobile and Emerging Cities -A) Download Goodput, B) Upload Goodput, C) RTT . . . 21
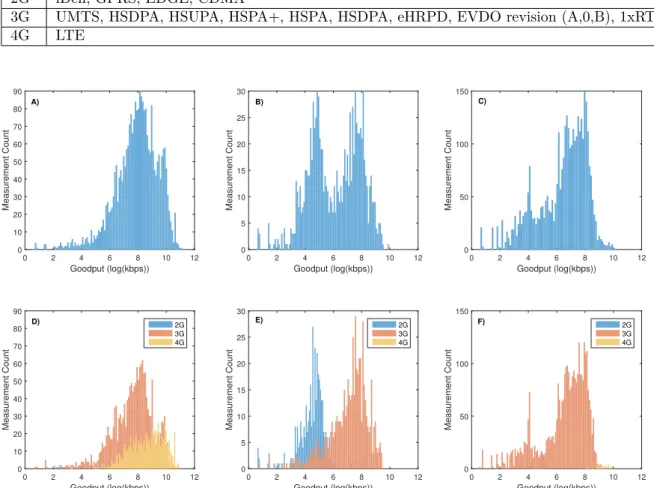
6 Histograms of Download Goodput (log scale) - A) London, B) Banga-lore, C) Jakarta, D) London by Network Tech Generation, E) Ban-galore by Network Tech Generation, F) Jakarta by Network Tech Generation . . . 22
7 Comparison between MOS and data price . . . 27
8 Comparison between data subscriptions and price . . . 31
9 WISP-driven VNC . . . 39
10 Community-driven VNC . . . 40
11 MNO-driven VNC . . . 41
List of Tables
1 Comparison between cost drivers of international capacity enablers . 7
2 Comparison between technical features of last-mile enablers. . . 12
3 Comparison between cost drivers of the last-mile enablers . . . 13
4 Comparison between implications of operating in developing countries 13 5 Network Ecosystem KPIs for an Affordable Internet . . . 18
6 National Indicators for Countries of Selected Cities . . . 21
7 Mapping of Network Technologies to Network Generations . . . 22
8 Available capacity per mobile generation technology . . . 23
9 Data sources in the mobile market model . . . 27
10 Identified dominant bottlenecks . . . 28
11 User competences bottleneck-chain . . . 28
12 Price bottleneck-chain . . . 30
13 Capacity bottleneck-chain . . . 32
14 Summary of dominant bottlenecks and associated causes . . . 33
15 RIFE Stakeholders . . . 36
16 Business roles and technical components . . . 37
17 Enablers of value and drivers of cost . . . 38
18 Comparison of Benefits and Costs between VNCs . . . 42
19 Summary of revenue models . . . 43
1.1
Motivation
The first wave of Internet services arrived in developing countries through personal computers and fixed-line connections, just as it had happened before in Western Europe and the United States. Unfortunately, only privileged citizens had access at few aggregation points such as Internet cafes and Universities. To address this disparity between citizens, at the beginning of the millennium governments and international organizations actively supported the diffusion of the Internet. For instance, in 2003 India implemented a state-scale program to deploy and promote e-kiosks. Lamentably, the associated e-literacy campaigns showed low participation rates. The most frequent reason not to participate was "Computers are of no use to me" [1]. Another similar example is the e-Sri Lanka programme funded by the World Bank in 2005. In this case, the observed low Internet usage was caused by: the lack of local content, the lack of awareness of relevant online resources and language difficulties [2]. Therefore the diffusion of the fixed-Internet was not only limited by its geographical availability, but also by a low user adoption rate.
With the emergence of mobile broadband technologies, the mobile phone has become the key enabler of Internet access in developing countries. According to a survey carried out in 2011, more than 80% of Internet users in Namibia, Uganda and Ethiopia accessed the Internet via a mobile phone. For South Africa, Kenya, Nigeria, Tanzania, and Rwanda, the corresponding number was 70% [3]. However, the disparity between mobile penetration levels remains huge across developed (84%) and developing (21%) countries [4].
Nevertheless, the mobile broadband market is rapidly developing worldwide and an endless number of questions remain open: Why is the mobile broadband penetration expanding at different rates in different countries? And what are the main constraints that limit Internet diffusion? Are constraints from the fixed-Internet going to affect the mobile Internet as well?
1.2
Research Questions
The main objectives of the thesis research are to identify the constraints to emerging broadband markets and, to identify network technologies, Value Network Configura-tions (VNCs) and operator revenue models that could accelerate this in developing countries. Two research questions are addressed:
Q1: What are the bottlenecks the diffusion of the Internet faces in emerging broadband markets?
Three bottleneck hypotheses are preliminarily identified by analyzing aspects of demand and supply of the broadband market.
1. Low level of competence of users. Demand for Internet is not satisfied due to the inability of users to operate (mobile) devices or applications.
2. Low quality of service. Providers of the broadband market do not supply enough capacity or this is not properly delivered to users (e.g. low service availability, limited coverage).
3. High access price. Demand might be constrained by low-income levels of users and/or competition between suppliers might need to be increased via the regulatory framework.
Q2: Which value network configurations could accelerate the development of the broadband market in developing countries?
The following topics are taken into account when addressing the research question:
1. How could operators benefit from operating on a shared and open infrastructure? Are costs reduced? Is market competition affected?
2. What stakeholders would be interested in subsidizing the access cost of users? As a long-term investment (e.g. to support m-education)? As an operational saving (e.g. e-government, e-health services)? As partnership with operators (e.g. m-banking, advertisement)?
3. What business strategies and pricing structures might best address the needs of low-income users and local businesses (e.g. zero-rating applications, transaction-based pricing, bundle of services)?
1.3
Scope of Research
The thesis research focuses on the technological and economic factors that affect the development of the broadband market when providing services to underserved regions and communities in developing countries. In this thesis, an underserved region is defined as a geographical location which lacks the ICT infrastructure to provide broadband services to the population. And, an underserved community is understood as a group of users that cannot afford market prices of Internet access. A relevant organization that works in this context is the Global Access to the Internet for All (GAIA) Research Group [5]. This is an Internet Research Task Force (IRTF) initiative that aims to increase the visibility of the challenges and opportunities for enabling global Internet access in terms of technological and socio-economic factors.
The thesis defines as the baseline the situation of several emerging mobile broad-band markets (as a sub-case of emerging broadbroad-band market) including observed QoS, the price of data and, macroeconomic indicators. Next, thesis research explores the potential of alternative networks [6] to provide underserved communities taking the mentioned baseline as reference.
Alternative network deployments are defined by GAIA as: "Set of network access models that have emerged in the last decade with the aim of providing Internet connection, following topological, architectural and business models that differ from the so-called "mainstream" ones, where a company deploys the infrastructure connecting the users, who pay a subscription fee to be connected and make use of it."
Therefore, it is in the scope of this thesis research to explore ecosystem around Alternative Networks. Although previous research on business models to support these and their associated services exist (telephony [7] and data [8]), scalability and sustainability problems persist [9], particularly in developing countries. Part of this research is executed in the context of the Horizon 2020 architectuRe for an Internet For Everybody (RIFE) Project [10] which aims at developing a system architecture to keep costs of deployment at an affordable level for communities, while providing novel community-oriented services.
1.4
Research Methods
First, an extensive literature review presents the main enablers of international Internet bandwidth as well as last-mile connectivity in developing countries. Major attention is devoted to the comparison between technical and businesses features between wireless access technologies. In addition, the benefits of Content Delivery Networks (CDNs) are also introduced as the principal enablers of digital content. Finally, the role of regulation and competition is described based on guidelines elaborated by the ITU as well as the observed impact of prices in emerging markets. Complementary approaches to competition are also reviewed including Mobile Virtual Network Operators (VNOs) and the Open Access.
Second, a statistical analysis of network measurementsfrom the Netradar platform is performed to characterize the main indicators of delivered QoS of mobile networks in emerging markets. Measurements gathered in a crowd-sourced effort by individual users are statistically analysed to determine what is the median download and upload goodputs as well as latencies provided by different mobile technology generations and measured by multiple mobile devices.
Third, a quantitative bottleneck analysis of diverse data from nine sample countries is conducted to identify the main constraints of Internet broadband sub-scriptions. Candidate bottlenecks (capacity, price and user competence) are evaluated through an Internet broadband market model that assumes consumers maximize consumer surplus. The data includes mobile network measurements from a large city in 9 countries as well as national indicators of business, technical, and social factors. The studied countries include three advanced mobile markets: Finland, UK, and Spain and six emerging mobile markets: Brazil, India, Iran, Mexico, Indonesia, and Tanzania. As a result, the dominant bottleneck in each city is identified and recommendations suggested.
Last, literature review and identified constraints are utilized in a qualitative Value Network analysisto identify plausible scenarios, related business strategies as well as operator’ revenue models that aim at adding new Internet broadband subscribers. Network technologies, business contracts and subscriptions are assessed to reach underserved communities and regions. Two viewpoints are taken, one concentrating on the requirements of the RIFE project [10] and the other considering a mobile operator point of view.
1.5
Structure of Thesis
Figure1 presents the 6 chapters of the thesis, the principal topics per chapter and, the links between these.
Chapter 2 introduces the technological enablers of both international and last-mile capacity from a technical and business standpoint. Chapter 3 estimates the capacity delivered in the last-mile by analyzing mobile network measurements. Chapter 4 studies the bottlenecks to the development of the mobile broadband market by combining the information gathered in Chapter 2 and 3. Chapter 5 assumes the results obtained in Chapter 4 as a starting point and explores three value network configurations that could accelerate broadband Internet diffusion. Finally, Chapter 6 prioritizes and discusses results obtained along previous chapters and summarizes the major outcomes.
2
Literature Review
2.1
Enablers of International Internet Capacity
2.1.1 Satellite Network TechnologiesSince the 1990s, the satellite industry has identified underserved regions, particularly those form Sub-Saharan Africa, as markets of enormous potential. In fact, satellite operators distribute digital television and high-end telecommunication services to the consumer and the corporate segment (e.g. oil, gas, banking, mining and government), respectively.Moreover, according to the 12th edition of theGlobal Satellite Capacity Supply & Demand Study issued in 2015 [11], total demand for data services provided through High-Throughput satellite Services (HTS) is expected to grow up to the 3 Tbps driven by new enterprises that require from IP trunking in landlocked countries (e.g. Democratic Republic of Congo).
The key advantage of satellite network technologies is the ability to provide a reliable and quickly deployable backhaul connectivity with minimal infrastructure requirements on the client side. The downside is the lack of scalability resulting from the high cost of manufacturing and launching a new satellite. In other words, the marginal cost of adding additional capacity is high and, as a result, cost of transmission per bit do not largely decrease with volume. Additionally, the delivered capacity through satellite technologies is severely limited not only by the shared medium but also by large latency times, link impairments (e.g. multipath, fading, rain attenuation and shadowing), bandwidth asymmetry (approx. 1:10 regarding uplink:downlink) and, the consequent dysfunctions in connection oriented protocols (e.g. RTT fairness, multiple segment loss of TCP) [12]. Fortunately,
performance-enhancing proxies (PEPs) improve the end-to-end performance of protocol including TCP. In addition, low-earth-orbit satellites (LEO) provide latencies below the 300 ms.
The latest standard for broadband satellite communications named Digital Video Broadcasting - Second Generation (DVB-S2) was defined by European Telecommuni-cations Standards Institute (ETSI) in 2003 [13]. This enables: 1) Broadcast Services for standard definition TV and HDTV, 2) Interactive Services including Internet Access for consumer applications, 3) Professional Applications, such as Digital TV contribution and News Gathering, TV distribution to terrestrial VHF/UHF trans-mitters, Data Content distribution and Internet Trunking [13]. Compared to its predecessor, the DVB-S2 standard typically provides a 30% capacity increase [13]. This was developed around three key concepts: 1) best transmission performance achieved by the adoption of improved channel coding and efficient modulations starting with QPSK up to 32APSK, 2) reasonable receiver complexity by keeping a single-chip decoder and finally 3) improved flexibility that enables point-to point services and point-to-multipoint services.
2.1.2 Submarine and Terrestrial Fiber Technologies
Submarine cables have been laid on the sea-bed since 1850 and in 2006, these accounted for 99% of all international traffic. Regarding Africa, the last unconnected coastal cities of the continent, in the east cost, got access to the SEACOM cable (1280 Gbps) in July 2009. During following years, several other cables reached the same area and, according to the conclusions of the FEAST project [14], in 2010 Africa become the best interconnected continent in the world through submarine cable.
The research project PingER [15] monitored the migration of local services from satellite links to terrestrial fiber routes by measuring Round Trip Times (RTT) from the US and Italy on the days following the start of operation of the SEACOM cable. Figure 2 shows how RTT times were reduced from 400ms associated with satellite links to values between 200-300ms. This phenomenon was observed at the continental level including countries such as Angola, Ethiopia and Mozambique.
Figure 2: RTT reduction in a transition from satellite to terrestrial connection in Kenya [15]
The advance of terrestrial fiber towards landlocked countries in the African continent is happening lead by governments and wholesale operators (e.g. Liquid Telecom, EASSy consortium) to increase the utilization of the massive available submarine capacity. The following projects are ongoing: Central African Backbone, East Africa Broadband Network, Maritime Communications for Safety on Lake Victoria, South Africa Region Backbone, West Africa Network, ECOWAS Power Pool-based Fibre Network.
The technology that enables high-throughput communication through fiber strands (single optical fiber made of glass) both in submarine and terrestrial networks is known as Dense Wavelength Division Multiplexing (DWDM). This goes beyond existing single-channel optical links utilized in Synchronous Optical Networking (SONET) networks by introducing concept of spectral grids as parallel optical channels of vari-able wave-length [16]. Such new approach is implemented by the new Erbium Doped Fiber Amplifiers (EDFAs) in substitution of Optical-Electrical-Optical re-generators. Consequently, optical channels can be multiplexed across more wavelengths including C band (1525–1565 nm) and L band (1570–1610 nm). One of the crucial benefits of DWDM is that EDFA enables easy upgrade of existing SONET infrastructure due to compatibility with old single-wavelengths and ability to amplify any optical signal in its operational range. Last but not least, it enables the transport of over
100 different wavelengths per fiber and reduces the number of required repeaters to compensate for optical power loss, which can be distanced up to 100 km [16].
2.1.3 Comparison between Satellite and Fiber Technologies
The two enablers of international Internet capacity are compared first, based on the potential to deliver large volumes of capacity, second on their requirements in terms of capital investment, third regarding operational costs with focus on service provision and, finally, a summary is presented in Table 1 taking into account the 4 basic business activities performed by NOs.
In terms of aggregated capacity, while the expected global capacity through HTS is limited to 3 Tbps in 2015 [11], submarine cables already provide several hundred Tbps to the African continent alone. Such disparity is caused by the dissimilar transmission mediums. While satellite technology transmits through a unique and shared medium, fiber allows the multiplex of communication between glass fibers and wave-lengths. With respect to capital investment, the manufacture and launch of one new satellite demands several hundred millions dollars. In contrast, terrestrial cable is currently deployed in China and India at aprox. $2000/km including the cable itself [17]. Regarding operational costs, preservation of terrestrial fiber infrastructure (sensitive to vandalism and public works) is significantly higher than satellite terrestrial stations and receiving antennas. However, compared to copper lines used in telephony, the market value of fiber cable is almost zero and incentives for thieves are nonexistent. In terms of service provision costs, satellite connectivity can be directly provided to the point of need through reliable and quickly deployable backhaul connectivity. This only requires the installation of a satellite dish the costs of which are negligible compared to the price of the subscription. On the other hand, fiber connectivity might require from extra links to connect the point of need with the closest point of presence. The cost of such additional infrastructure, which might include several sites (e.g. base stations of a MNO), might become relevant in the context of larger networks.
Table 1: Comparison between cost drivers of international capacity enablers
Activities Terrestrial fiber Satellite
Equipment acquisition and network deploy-ment
• Low marginal cost of adding additional capacity
•Deployment of 1km costs $2000 in developing countries
• High marginal cost of adding additional capacity
•Spectrum license required
• A new satellite in orbit costs several hundred million dollars Network promotion
and contract manage-ment
•Typically, small network of re-tailers
•Typically, centralized manage-ment
Service provisioning • Typically, an operator is re-quired to connect point of pres-ence and point of need
•Service delivered straight to the point of need
Network infrastructure operation
•Maintenance of a capillary-like terrestrial network
•Maintenance of few ground sta-tions
As a result, it can be concluded that the scalability of satellite technologies is severely limited by the broadcast nature of the radio medium and the constant marginal cost of serving additional customers. Conversely, fiber technologies transmit over an economical, durable and highly multiplex-able medium that provides an scalable solution able to deliver high volume of data at a lower price.
2.2
Enablers of Wireless Last-mile Internet
2.2.1 IEEE Wireless Technologies in Unlicensed Frequencies
Wireless technologies that operate in the Industrial, Scientific and Medical (ISM) radio band reduce the network deployment cost of access operators because no longer require spectrum licenses. As an example, in this section the 802.11 and the 802.16 families of protocols standardized by the Institute of Electrical and Electronics Engineers (IEEE) are presented. While 802.11 is used as access technology that provides tens of Mbps in a 100 m range, the 802.16 is employed as backhaul connectivity enabling 72 Mbps in a 50 km point-to-point with line of side conditions (802.16d) [18]. Both protocols present also differences with regard to media access control mechanisms. While 802.11 implements a connectionless approach based on contention as explained further in this section, media access control in the 802.16 is strictly controlled scheduling algorithm which allows certain guarantee on QoS in a point-to-multipoint setting. As a result, the combination of both protocols fits well the requirements of the last-mile where Digital Subscriber Loop (DSL) cannot be deployed because of the lack of telephone lines.
The network equipment acquisition costs are low because network equipment and device manufacturers benefit from economies of scale and scope caused by: the suc-cessful standardization and certification processes by the Worldwide Interoperability for Microwave Access (WiMAX) Forum and the Wi-Fi Alliance, the large installed base of 802.11, the growing spread of 802.16 (more than 477 operators have deployed 802.16 networks in 150 countries [19]), the benefits of scale in terms of learning for users and vendors. As a result, operators in developing countries are able to locally acquire and economically deploy a network through small investment cycles. The downside is the lack of scalability of networks implementing IEEE technologies due to limitations of its infrastructure working mode (e.g. roaming between operators, handovers between access points) as explained later on in this section. From a service provisioning point of view, in the context of cities or campus networks, users can access the network with User Terminals (UE) when in coverage. Alternatively, households require from installation of Customer Premises Equipment (CPE).
Regarding the 802.11 family of standards enabling the access to the network, the 802.11b and the 802.11g versions use the 2.400–2.500 GHz spectrum and provide a maximum theoretical bandwidth of 11 Mbps and 54 Mbps respectively. Alternatively, the 802.11a and 802.11ac use the 4.915–5.825 GHz spectrum and implement different number of channels according to country regulations; its maximum throughput is also 54 Mbps. Although the 4.915–5.825 Ghz band counts with the advantage that it was used later in time and less interference is present, its range of action is smaller
due to propagation characteristics. Transmission over multiple frequency carriers is implemented through the Orthogonal Frequency-Division Multiplexing (OFDM) modulation in all versions of the standard after 802.11b [20]. Possible interference between base stations is controlled by the limited power at which radio emission is permitted. As mentioned earlier, the typical radius of coverage of 802.11 access point is of 100 m, nevertheless outdoor ranges can be improved to few kilometers through the use of high gain directional antennas at both the router and remote devices. An extreme example is the WiFi-based Long Distance [21].
The 802.11 family of standards implements the Carrier Sense Multiple Access -Collision Avoidance (CSMA-CA) as medium access protocol. This determines when frames are transmitted based on a randomized back-off time. As a result, the radio spectrum is not used optimally and, its total capacity decreases under congestion. QoS conditions cannot be guaranteed with the 802.11 and interferences from other radio-frequency sources in the shared spectrum provoke degradation of service [20]. Present versions of 802.11 standard implement robust security network access techniques such as Wi-Fi Protected Access II to exchange secure cryptographic keys after a 4 way handshake and cipher of communication with the Advanced Encryption Standard. The basic building block of the 802.11 architecture is the Basis Service Set in which wireless stations can establish either direct connection in ad-hoc mode or through an access point. An Extended Service Set is the result of the interconnection of multiple Basis Service Sets.
2.2.2 3GPP Wireless Technologies in Licensed Frequencies
Since the first call was made in July 1rst 1991, mobile services and technologies have spread to all countries in the world. Mobile technologies were developed as the evolution of fixed voice telephony and therefore required network connections to be maintained across adjacent cells. For this to be possible, several key features are required including a centralized management, a strict QoS guarantee and, an exclusive use of the radio spectrum.
Spectrum licences define the frequency band, the geographical limits and, the duration of usage rights of the radio spectrum. More importantly, these are assigned by national regulatory authorities which may introduce additional conditions (e.g. the network coverage, roll-out requirements) and typically require costly fees from operators. In addition, 3GPP network equipment is developed and heavily patented by 3rd Generation Partnership Project (3GPP) industry alliance in charge also of GSM, GPRS, EDGE, UMTS, HSPA, and LTE maintenance. Moreover, network equipment is globally distributed by a limited number of manufacturers resulting in high prices of the network infrastructure. As a result of both costly equipment and licenses, the deployment of 3GPP technologies require from a large upfront capital investment which forces operators to invest via large cycles and, imposes strict business constraints to guarantee the return of the investment.
The 3GPP technologies advantage is the ability to deliver a large volume of network capacity to an extensive and geographically dispersed population thanks to: the use of exclusive and centrally allocated frequencies, an scheduled medium
access and, large coverage radius per base station (30 km in rural areas). Moreover, from a service provision point of view, users are able to access the network through economical and available mobile devices when in coverage. Both manufacturers of 3GPP network equipment and mobile devices benefit from economies of scale and scope, however, while prices of 3GPP network remain high because of patents and a market dominant position, the price of mobile devices dropped as global competition increases.
As an example, the Long Term Evolution (LTE) mobile communication standard defines Orthogonal Frequency-Division Multiple Access (OFDMA) as the mechanism to manage the radio access on the download link interface and, the Single Carrier Frequency Division Multiple Access in the uplink. The later reduces power require-ments of the User Equipment (UE). LTE was developed to support a wide range of bands starting from 700 MHz up to 2.7 GHz and implements adaptive modulation up to 64 QAM. As a result, the highest theoretical throughput is 300 Mbps in the downlink and 75 Mbps in the uplink. Figure3shows the overall network architecture of LTE including network elements and standardized interfaces.
Figure 3: LTE Network Architecture [22]
This is divided in two, the access network named as E-UTRAN which is composed of Base Stations (BSs) with name eNodeB and, the the core network known as EPC which requires from several logical entities including: (1) Serving Gateway or S-GW that acts as IP gateway and local mobility anchor, (2) the PDN Gateway or P-GW that provides UEs with IP configuration and enforces QoS levels and, (3) the Mobility Management Entity or MME which processes the signalling between the core network and the UE. Further detail on the distribution of functions is shown in 4. The EPC is purely packet-switched and implements IP including both the control plane (signalling) and the user plane (user data).
More importantly, in LTE, a bearer is defined as a IP packet flow with particular QoS requirements between the P-GW and the UE. Based on this, LTE is able to provide adaptive QoS to UEs by assigning multiple bearers. In addition, user authentication is performed based on the unique authentication key provided by the operator in the form of a physical SIM card. Finally, communication in the radio link is ciphered and multiple algorithms are allowed.
Figure 4: Functional split between E-UTRAN and EPC in LTE [22]
2.2.3 Comparison between IEEE and 3GPP Wireless Technologies The IEEE and 3GPP families of wireless standards represent two fundamentally different approaches to the provision of network services due to the different nature of the business models these were designed to support. As mentioned early, the 3GPP umbrella of technologies was elaborated as the natural extension of subscription based business models of mobile operators. Alternatively, technologies developed by the IEEE address the business logic of equipment manufacturers that commercialize products through single monetary transactions. According to Lehr [23], the former offer a vertically integrated, top-down, service-provider approach to delivering wireless services, while in the later case, this is decentralized and user centric.
The present section compares the 2 families of technologies from multiples angles. First, technical features with impact to the resulting broadband service are taken into account. Second, drivers of costs faced by NOs are presented and, third, their translation to the context of developing countries is assessed. This comparison assumes that services provided through IEEE technologies implement 802.11ac as access technology and 802.16d as WAN technology while in the side of 3GPP technologies, LTE is the enabling standard. This way, technologies are compared based on a analogous deployment setting with a similar range between an imaginary point of presence connected to the backbone network and the customer.
Table 2 compares the technical features of both technologies as presented in previous sections.
If we analyse the bandwidth-to-coverage ratio per base station, it becomes clear that the 3GPP family of technologies serve larger cells and cover larger distances than those from the IEEE. However, as counter-effect, the supplied bandwidth is significantly smaller. Regarding the utilization of the radio spectrum, the former allocates this in a centralized way and it controls access through an strict scheduler
Table 2: Comparison between technical features of last-mile enablers
Technical features 802.11ac / 802.16d LTE
Cell coverage •100 m (802.11ac)
•point to point backhaul link of 50 km (802.16d) •30 km (reasonable performance in rural areas) •100 km (macro-cell theoretical max) Frequency bands •2.400-2.500 Ghz (802.16d) •4.915–5.825 GHz (802.11ac) •700 MHz-2.700 GHz Medium access control •OFDM (frequency multiplexing
modulation)
•CSMA/CA (access control)
•OFDMA (download)
•SC-FDMA (upload) Radio interference
con-trol
•Power limitation
•Shared and non-coordinated use of the spectrum
•Exclusive and centralized allo-cation of spectrum
Bandwidth per link (theoretical max)
•500 Mbps
•point to point backhaul link of 72 Mbps (802.16d)
•300 Mbps
Ad-hoc connectivity •Built-in •No Mobility within a single
operator coverage
•local mobility (100 m)
• Optional extension to ESS (campus network)
•continuous mobility (handover)
Roaming between oper-ators
•Optional RADIUS service •Built-in QoS mechanims •Optional coordination functions
between UEs
•Adaptive assignation of packet flows with guaranteed QoS (bear-ers)
algorithm. Less efficiently, the later implements a contention based access with impact on service performance in case of network congestion. Moreover, interferences from other radio-frequency sources are also possible due to non-exclusivity over the ISM radio band.
The second step of the comparison analyzes the drivers of cost faced by NOs when implementing the mentioned wireless technologies. For simplicity, operation of these is divided in 4 activities. Table3 compare the two technologies under study.
The fundamental conclusion that can be extracted from Table3 is that, although the deployment of IEEE technologies require less capital that 3GPP, these do not scale up as cost-efficiently. Therefore, for large sized networks, the overhead costs of operation of IEEE technologies could, at the long term, overcome those of the deployment of 3GPP. Due to the fact that IEEE technologies fit well networks of reduced size, network promotion and management activities are more receptive to customer feedback which could allow service flexibility. However, as described previously, the contention nature of the radio access mechanisms of IEEE technologies does not guarantee the provision of QoS and therefore such flexibility is limited, for example, in latency sensitive services.
So far, this comparison has assumed that the economic actor providing the network service resembles the traditional NO. Nevertheless, other approaches exist such as those of the Community Networks (CN) [8] in which a crowd-sourced approach to the deployment and operation of infrastructure change the traditional cost structure of
Table 3: Comparison between cost drivers of the last-mile enablers
Activities 802.11ac / 802.16d LTE
Equipment acquisition and network deploy-ment
•Small investment cycles
•Low-cost equipment available
•No spectrum license required
•Large investment cycles
•Heavily patented technology
•Spectrum license required
• Few and global equipment providers
Network promotion and contract manage-ment
•Local management
•Service more easily customized
•Customer Premises Equipment (CPE) bundling with subscription
•Centralized management
•Network of retailers
•UE bundling with subscription Service provisioning •CPE installation required •Access with UE when in
cover-age
• Metering and billing scale up with size
Network infrastructure operation
• Generally, costs increase with scale
•Generally, costs decrease with scale
NO and challenges the previously identified scalability problems of IEEE technologies. The third step of the comparison shown in Table 4 presents the economic impli-cations of working in developing countries:
Table 4: Comparison between implications of operating in developing countries
Activities 802.11ac / 802.16d LTE
Equipment acquisition and network deploy-ment
• Local distributors typically available
•Small investment cycles reduces business uncertainty (predictable demand)
•Low labor costs
•Typically, imported from manu-facturers with no presence in the country
• Large investment cycles in-creases business uncertainty (un-certain demand)
•Low labor costs Network promotion
and contract manage-ment
•Low customer acquisition costs
•Dramatically high transit costs
•Low customer acquisition costs
• Bargaining power due to size when negotiating transit costs Service provisioning •Low cost of equipment as
disin-centive to theft
•Low regulation requirements for installation
•Low installation costs
•High cost of equipment requires enhanced security
•High installation costs
Network infrastructure operation
•Availability of free training con-tent
• Difficulties to find skilled per-sonnel
As a result of the last comparison, it can be concluded that 3GPP technologies face more difficulties than those of the IEEE in developing countries. The financial risks resulting from a larger initial capital investment might limit the deployment of 3GPP technologies due to uncertain demand and, income inequality leading to low ARPU. In addition, the available number of skilled technical personnel competent with 3GPP technologies is limited due to the few number of 3GPP equipment manufacturers and the comparatively higher prices of their products.
As final conclusion of the three-step comparison, it can be argued that the com-bination of 802.11 and 802.16 standards (used respectively as access and WAN technologies) is able to rapidly address unserved demand thanks to the short invest-ment cycle of its deployinvest-ment. This is mainly explained because of the availability of low-cost of equipment, local distributors in the computer retail business and, personnel with computer science competence from local universities. On the other hand, the 3GPP technologies require from larger investment cycles due to first, the large scale nature of their networks, second, the limited number of equipment manufacturers, and third, the requirement of spectrum licenses. As a result, a large capital expenditure is required upfront which, in the context of developing countries, might face business uncertainty due to uncertain demand and revenues. Nevertheless, 3GPP technologies enable larger coverage sites per base station, better utilization of the spectrum and improved mechanisms to guarantee QoS. In addition, they scale up in a cost-effective way and, in the long run, operational costs could overcome initial savings in capital expenditure as the network grows in size and complexity.
One example of the inability of 802.11 standards to deliver services due to congestion, it is the case of a village in rural Zambia were a 256 kbps satellite link was updated to a 2 Mbps terrestial wireless link [24]. Although performance of the overall Internet service rapidly improved, after 3 months users began to use more bandwidth-hungry applications and congestion in form of failed uploads and downloads and longer RTT times appeared. As a conclusion of the experience, authors of [24] assert that traffic prioritization techniques are required to guarantee certain basic network protocols to work.
2.3
Enablers of Digital Content
2.3.1 IXPs, Caches, and Content Delivery Networks
Investments in network infrastructure are concentrated in the first-mile (as companies pay for hosting) or in the last-mile (as end-users pay for access).This phenomenon was defined as the middle-mile problem by Leighton [25]. The rapid growth of demand for video (in both developing and developed countries) worsens this problem particularly in peering and transit points which are already overloaded.
Content Delivery Networks (CDNs) were developed to offload cacheable con-tent from central servers onto a network of caches, and thus, distribute concon-tent to backbones of operators. As result, the degree of distribution of content towards the interior of Internet Service Providers (ISPs) increases and, at the same time, this reduces the crossed number of peerings and transit points. As a counter-effect, protocols that manage global-scheduling, load-balancing and cache-management suffer from scalability problems [25].
In the context of underserved regions, such problems are magnified by the lack of Internet Exchange Points (IXPs) and content caches. As a result, users often request content placed in a distant continent [26]. Public and private effort addresses this need such as: The African Internet eXchange System project which provides capacity building and technical assistance to support the establishment of National IXPs, and
the Google Global Cache (GGC) with more than 3000 caches across Africa [26]. As an example of the middle-mile problem, according to Fanou [26], GGC caches located in Africa discriminate by country. More precisely, Fanou speculates that Google might enforce such behaviour in its cache-management algorithms to avoid particular peering points in which operators charge high fees. As a result of this, the overall performance of the distribution of content becomes suboptimal.
2.3.2 Caching in Mobile Networks
Operators are reluctant to locate third-party systems within their networks because they cannot control the amount of traffic these generate. However, in the context of isolated networks with very limited backhaul connectivity, the benefits of storing content at the edge of the network might counter-balance the inconveniences.
To this purpose, Costa presents in [27] the possibility of introducing Software Defined Networks (SDN) in the context of LTE mobile networks. More precisly, the idea consists in transforming the LTE data plane into a network of simplified access points and SDN-enabled switches. Costa’s approach proposes the removal of GPRS Tunneling Protocol that channels the communication between eNodeB and both S-GW and P-GW and substitute this by Ethernet VPN tunnels. Experiments performed by Costa show that mobility management, QoS and security could rely on L2 and L3 transport controlled by a floating SDN-controller acting as S-GW and P-GW. As a result of this change on the LTE architecture, caches could be placed beside any switch in the access network and, this way, content could be placed closer to the BS reducing latencies and avoiding network bottlenecks.
The introduction of SDN in mobile networks would as well introduce comple-mentary benefits in terms of cost reduction and flexibility beyond the scope of this analysis.
2.3.3 Content Cacheability
Although caching theoretically is a very efficient way to optimize content delivery, in reality not all content that traverses the Internet is cacheable. As an example, Ramanan [28] analysed HTTP traffic in an operational LTE network and found that 9% of the data volume and 54% of the requests could be considered cacheable. Among the popular hosts considered, Netflix and YouTube constitute the bulk of the cacheable data volume whereas Facebook and Google constituted the bulk of cacheable URL requests.
Although content might be classified as cacheable, several technical aspects might prevent this to happen. For example, content could be protected by cache control (HTTP headers), personalized, provided through load balancing (same content server by different URLs) or have an expected low hit-rate (e.g. user generated content) [28]. In addition, the widespread use of Hypertext Transfer Protocol Secure (HTTPS) protocol requires from a particular technical solutions supported by business
agreements between content providers and operators.
According to Elkadi [29], cacheability is “the technical ability and economic feasibility of caching a type of Internet traffic without degradation in the user quality
of experience or the violation of any copyright law”. Elkadi defines a total of 13 parameters to assess cacheability of content not only from a technical perspective but also taking into account business and user behaviour aspects.
2.4
Enablers of Internet Affordability
2.4.1 Role of Competition and RegulationAs introduced previously, affordability is one of the main constraints to both access and usage of broadband Internet in developing countries [4]. To measure the evalua-tion of prices, the ITU collects prices of ICT services (fixed telephone, mobile-cellular and fixed broadband) from 144 countries since 2008.
Regarding the role of competition, quantitative analysis from the 2008-2013 period show that market concentration measured by the Herfindahl-Hirschman Index (HHI) is significantly correlated to mobile-cellular prices in developing countries, and the sign indicates that increased competition reduces prices. According to the same analysis, levels of regulation are also correlated with mobile-cellular prices but with a weaker statistical significance. For instance, its estimated that prices of voice calls and SMS could decrease a 3% per cent if countries with lowest regulation levels would introduce regulatory changes such as: making interconnection prices public, publishing reference interconnection offers, allowing infrastructure sharing for mobile operators, permitting secondary trading of spectrum and implementing mobile number portability. As a result, the ITU emphasises that efforts should focus on ensuring higher levels of competition particularly in those markets where dominants operators hold more than 60% of the market share.
Complementary, the Information for Development Program (infoDev) in col-laboration with the ITU produced the ICT Regulation Toolkit [30] as a practical web-based tool intended for ICT policymakers and regulators around the world. This provides a global overview of how telecommunication policy is best implemented with practical materials highlighting experience and results. The main regulatory challenges identified by [30] in developing countries where wireless demand has exceeded fixed demand are:
• The establishment of a regulatory regime requires from a demanding legal and administrative infrastructure. For example, resources to build large cost models.
• Regulatory of access prices requires from new approach due to the rapid deployment of new infrastructure. For example, policies to unbundle network elements assume that fixed incumbents enjoy a near monopoly position which may not be the case.
• Policies regarding retail pricing need to adapt to emerging technologies such as Voice over IP (VoIP). For example, per minute rates is a product of fixed-telephony.
2.4.2 Mobile Virtual Network Operators
According to the ITU [4], there is not enough evidence to assert that small but disruptive operators in the form of Mobile Virtual Network Operators (MVNOs) could have an impact on prices. However, these allow incumbent Mobile Network Operators (MNOs) to adopt complementary approaches such as: segmentation-driven strategies where MVNOs enable specific marketing mix and target particular customer segments, network utilisation-driven strategies where MVNOs exploit unused capacity and increase monetization of the infrastructure and, product-driven strategies in which MVNO can address customers with highly specialized service requirements.[30] Complementary to this, T. Smura [31] defines that MVNO can be classified across two dimensions. First, MVNO could operate as either (1) Service Providers (SP) that sell subscriptions and bill customers, or as (2) MVNOs that own a mobile core network and establish interconnection agreements with other operators. Second, a VNO can adopt a cost leadership business strategy or alternatively a service differentiation strategy. Market analysis performed by the author revealed that, in developed countries, most VNOs belong to the SP/CostLeader group. Smura classification is used in our VNA with a wider scope beyond mobile operators. As a result, VNOs are classified as SP or NO.
2.4.3 Open Access
The Open Access concept introduced by Comstedt [32] is a broad approach to policy and regulation that aims at lowering the cost of business entry for new operators by introducing a neutral technology that enables competition at all layers in an IP network. In the context of developing countries, the open access model aims at avoiding facility-based competition that would require from the development of multiple independent infrastructures and adopt a public utility model which is not necessarily publicly owned. This model is particularly interesting for fiber networks which last for decades and retail competition can happen on the edges. Open access is now recognized as important for Africa and the World Bank supports its introduction to partially manage the EASSy submarine cable[17].
The open access model is also implemented to bridge the digital divide in developed countries. For example, cities such as Philadelphia and San Fransciso provide their own Wi-Fi services and Stockholm and Amsterdam own municipal fiber. It is also the case of Community Networks such as guifi.net [8].
2.4.4 Network Ecosystem KPIs for an Affordable Internet
According to H. Hämmäinen, the affordability of Internet access can be assessed through technical and business Key Performance Indicators (KPIs) across three domains of the network ecosystem: network cost, network competition, and user access subsidy. These are presented in the Table 5.
Table 5: Network Ecosystem KPIs for an Affordable Internet
Network Cost Domain
objective: minimize provider cost examples
1. Optimize network resources improve routing, computing and data managment 2. Minimize transmission cost use unlicensed spectrum
3. Minimize charging&billing cost acquire wholesale instead of retailavoid AAA/HSS systems
Network Competition Domain
objective: minimize provider profit examples
4. Inter-protocol competition choice: e.g. multihoming, IP&ICN, (no)-cache 5. Inter-node competition decentralize: e.g. no single point of failure/control 6. Inter-actor competition multiply actors per business role
User Access Domain
objective: minimize price examples
7. Ad revenue advertiser subsidizes users 8. Delayed benefit government subsidizes users 9. Freemium rich subsidize poor
10. Microloan banks subsidize users, increased productivity, delayed payback
11. Cache value local cache content/ads subsidize access to global Internet
2.5
Results
The scalability of satellite technologies is severely limited by the shared nature of the radio medium and the elevated marginal cost of adding additional capacity. Conversely, fiber technologies transmit over an economical, durable and highly multiplex-able medium that provides an scalable solution able to deliver high volume of data at a lower price.
The submarine network capacity interconnecting continents is largely available and a steady growth is expected in order to address the global demand. In addition, several national and cross-border projects are deploying terrestrial fiber further inland even in the African continent. Therefore, the enablers of large scale capacity approach underserved regions.
The comparison between families of wireless network technologies bridging the last-mile revealed that 3GPP technologies theoretically are a more scalable solution to provide broadband services to a large and dispersed population compared to those of IEEE. This is true because of the comparatively lower bandwidth-to-coverage ratio of 3GPP base stations, improved use of the spectrum of their radio access technology and QoS control mechanisms. From an implementation point of view, IEEE technologies require from a much lower initial capital investment and, although the associated operational costs increase rapidly with size, these might not challenge the sustainability of small operators. In the context of developing countries, a commitment of large capital might be difficult due to business uncertainty (e.g. income inequality leading to low ARPU) and the unavailability of both local providers and skilled personnel.
The delivery of digital content to underserved regions is constrained by overloaded transit and peering points. Therefore, more IXPs and caches are required in developing countries to reduce the middle-mile problem. Technologies exist to introduce CDNs closer to the end-user, even to move caches into BSs of MNOs. Related to this, content cacheability depends not only on technical aspects (e.g. type of content, network infrastructure) but also on business (e.g. copyright, hit-rate) and user aspects (e.g. time, location).
The affordability of Internet broadband access is affected by multiple aspects of the Network Ecosystem at multiple layers. Strong correlation exists between low mobile market concentration and low mobile cellular prices. Weak association exists between high regulatory levels of a telecommunication sector and low prices of mobile cellular services. Moreover, competition in the telecommunications market might be increased by the introduction of VNOs and/or the adoption of the Open Access concept. Finally, the affordability of Internet broadband access can be evaluated through KPIs addressing the network cost, network competition and user cost subsidy domain.
3
Statistical Analysis of Wireless Last-mile
Inter-net Capacity
3.1
Netradar Platform
Netradar is a client-server network measurement platform developed by researchers from Aalto University and launched in February 2013. The platform consists of a suite of mobile applications (for different mobile platforms) and associated measurement servers distributed in several locations around the world. The application sends and receives bulk data to and from the measurement server to estimate network properties such as TCP download and upload goodput and latency (Round Trip Time or RTT). The application also simultaneously collects a variety of device information including geospatial location and device model.
The Netradar client by default performs measurements on demand, in other words, whenever directed to measure by the user selecting the start button in the client user interface. However, the client can also be configured such that measurements are performed in the background (without the need for user intervention) at fixed or random intervals. In the context of the current study, we do not differentiate between measurements that are initiated by the user in the client user interface or in the background.
During any single network measurement, any part of the Netradar client mea-surement process (RTT meamea-surement or TCP meamea-surement) might fail for a variety of reasons. For example, the mobile network might not be available (no signal) or the Netradar measurement server might be offline. We leave analysis of these failed measurements for future work.
3.2
City and Country Selection
Availability of Netradar data from emerging mobile markets is limited to densely populated areas and therefore large cities were selected as targets of the research. From a total of 22 candidate cities, 6 were selected from emerging mobile markets based on data availability, geographical location and values of national ICT development Index (IDI) [4]. All Netradar measurements were performed between 2013-2015 while the national indexes are from 2013. Table 6 shows that the national indicators of the selected cities greatly vary thus ensuring a rich comparison.
The disparate number of measurements across cities is the result of different adop-tion levels of Netradar applicaadop-tion between cities. However the network measurement procedure is the same regardless of the location, thus ensuring comparability. We note that the measurements span many operators in each city thus providing an advantage over studies with operator centric data collection.
3.3
Netradar Data Extraction
The Netradar measurement data for each city was extracted from the full global Netradar database based on approximate urban bounding rectangles (except for
Table 6: National Indicators for Countries of Selected Cities
City, Country IDI rank IDI value GNI p.c. subs per 100 inh.a % data subsb Meas c London, UK 5 8.50 39110 123.80 64.10 2662 Helsinki, Finland 8 8.38 47110 171.70 68.00 674931 Barcelona, Spain 28 7.38 29180 106.90 75.50 770
Mexico City, Mexico 65 5.50 9940 85.80 12.00 4013
Tehran, Iran 94 4.29 5780 84.20 1.60 821
Sao Paulo, Brazil 95 4.29 11690 135.30 34.90 951
Jakarta, Indonesia 106 3.83 3580 121.50 9.70 3752
Bengalore, India 129 2.53 1570 70.80 7.50 1038
Dar es Salaam, TZ 153 1.76 630 55.70 15.80 596 aMobile cellular subscriptions per 100 inhabitants [4]
b% of Mobile cellular subscriptions that include data from annual reports of operators and regulators. cNumber of Netradar measurements for the selected city
Helsinki which was based on municipal boundaries). The measurements were then processed to ensure the validity of each measurement value including sanity checks based on theoretical maximum network technology values.
3.4
Netradar Dataset Basic Statistics
The cumulative distribution functions (CDFs) of download goodputs in emerging mobile markets (dashed lines) and in advanced mobile markets (solid lines) are shown in Figure5. Interestingly we find two distinct CDF shape patterns. Helsinki, London, Barcelona, Mexico City and Tehran show uniform CDF growth and their download goodput distribution is unimodal as shown, for example, with London in Figure
6A. Whereas Jakarta, Bangalore and Sao Paulo show non-uniform CDF growth indicating a multimodal distribution as shown, for example, with Bangalore and Jakarta in Figures 6B and6C.
Goodput (kbps) 100 101 102 103 104 105 0 0.1 0.2 0.3 0.4 0.5 0.6 0.7 0.8 0.9 1 Pioneer Emerging Goodput (kbps) 100 101 102 103 104 105 0 0.1 0.2 0.3 0.4 0.5 0.6 0.7 0.8 0.9 1 Pioneer Emerging RTT (ms) 101 102 103 104 0 0.1 0.2 0.3 0.4 0.5 0.6 0.7 0.8 0.9 1 Pioneer Emerging A) B) C)
Figure 5: CDFs of Network Values for Advanced mobile and Emerging Cities - A) Download Goodput, B) Upload Goodput, C) RTT
Next we group measurements by mobile generation technology as detailed in Table7. We find that distribution shapes are the result of overlapping measurements
from different mobile generation technologies. As an example Figure 3A shows that the single mode observed in London is the result of a combination where 4G takes the right tail of the distribution and 3G the left side. The same grouping analysis is performed for upload goodput and latency and we find similar unimodal or multimodal shapes as for download goodput.
Table 7: Mapping of Network Technologies to Network Generations
Gen Technologies
2G iDen, GPRS, EDGE, CDMA
3G UMTS, HSDPA, HSUPA, HSPA+, HSPA, HSDPA, eHRPD, EVDO revision (A,0,B), 1xRTT 4G LTE Goodput (log(kbps)) 0 2 4 6 8 10 12 Measurement Count 0 10 20 30 40 50 60 70 80 90 Goodput (log(kbps)) 0 2 4 6 8 10 12 Measurement Count 0 5 10 15 20 25 30 Goodput (log(kbps)) 0 2 4 6 8 10 12 Measurement Count 0 50 100 150 Goodput (log(kbps)) 0 2 4 6 8 10 12 Measurement Count 0 10 20 30 40 50 60 70 80 90 2G 3G 4G Goodput (log(kbps)) 0 2 4 6 8 10 12 Measurement Count 0 5 10 15 20 25 30 2G 3G 4G Goodput (log(kbps)) 0 2 4 6 8 10 12 Measurement Count 0 50 100 150 2G 3G 4G A) B) C) D) E) F)
Figure 6: Histograms of Download Goodput (log scale) - A) London, B) Bangalore, C) Jakarta, D) London by Network Tech Generation, E) Bangalore by Network Tech Generation, F) Jakarta by Network Tech Generation
3.5
Estimation of Available Capacity
As described in [33] five major factors affect and limit mobile capacity including: radio technology, radio conditions (coverage), congestion caused by other users, mobile device and handovers. As seen in the Section 3.4, measurements grouped by mobile technology typically present unimodal distributions therefore we assume that the radio technology associated with the mobile generation is the principal constraint to capacity. Thus next we compare capacity between cities based on mobile generations.
To compare the available capacity between cities, we compare medians due to significant outliers. To compare spreads between cities we compare inter-quartile ranges (IQR) as a fraction of the median. The IQR is calculated as the difference between the 75th and 25th quartiles, Q3−Q1. These comparisons are detailed in Table 8. To ensure reliability medians are not detailed when the number of measurements (for that generation) is smaller than 100. We also does not include measurements with unknown mobile generation technology that were utilized in the overall analysis.
Table 8: Available capacity per mobile generation technology
Download Capacity (kbps)
2G IQR 3G IQR 4G IQR City level IQR Helsinki 234 0.94 4342 1.67 26179 1.17 5691 2.11 Barcelona 2905 1.21 11003 1.11 3928 1.65 London 2477 1.74 6431 1.95 3096 2.17 Mexico City 1982 1.47 6665 1.46 2500 1.73 Sao Paolo 783 1.78 8044 1.37 885 2.88 Jakarta 85 1.45 928 2.18 841 2.46 Bangalore 99 0.95 1599 1.59 457 4.26 Tehran 33 1.65 438 1.91 126 4.85 Upload Capacity (kbps)
2G IQR 3G IQR 4G IQR City level IQR Helsinki 96 1.49 1519 0.94 7768 1.86 1568 1.41 Barcelona 985 1.61 4930 1.74 1127 2.22 London 934 1.33 5719 1.80 1332 1.69 Mexico City 650 1.39 6522 1.02 893 1.75 Sao Paolo 201 2.98 2540 1.94 236 3.89 Jakarta 20 1.06 136 5.37 93 7.49 Bangalore 48 1.55 745 1.97 135 8.11 Tehran 26 1.98 157 1.92 56 3.24 Latency (ms)
2G IQR 3G IQR 4G IQR City level IQR
Helsinki 178 1.73 72 0.79 34 1.39 68 0.88 Barcelona 84 0.73 58 0.39 73 0.78 London 117 0.72 95 0.43 111 0.66 Mexico City 168 0.75 146 0.40 162 0.66 Sao Paolo 263 0.95 235 0.50 267 0.83 Jakarta 506 1.60 273 2.21 301 2.02 Bangalore 383 1.07 135 1.56 256 1.61 Tehran 764 1.49 332 0.83 420 1.29
As expected, Table 8shows that available capacity in advanced mobile markets present higher goodputs and lower latencies than in emerging mobile markets. For example, 2G download capacities in Bangalore and Jakarta are two times smaller than in Helsinki while in the case of Tehran capacity is seven times smaller. Interestingly for 3G download, Mexico City and Bangalore show significantly higher capacities
than the rest of the emerging mobile markets. Regarding 4G, we find that download capacity is similar to upload capacity in London and Mexico City; this could be a sign of congestion.
3.6
Results
Although 3G technology is available in all cities, the measured download goodput is significantly lower in the emerging than in the advanced mobile markets. The same applies to 2G and 4G. Among emerging mobile markets alone, the median value of download goodput presents high variability. For example, if Tehran (min) and Mexico City (max) are considered outliers, the value in Bangalore still doubles the one in Sao Paolo.
4
Bottleneck Analysis
4.1
Methodology and Bottleneck Hypotheses
The Theory of Constraints defines system as a chain of interconnected activities in which the weakest link limits the overall throughput of operation. A systematic man-agement approach is derived from this assertion which claims that the performance of the entire system needs to be optimized by actively managing constraints that restrict organisational goal achievement [34] [35]. In this chapter, The Theory of Constraints is used as a conceptual framework to analyse the mobile broadband market from a system-oriented perspective in the context of a competitive and dynamic marketplace with the main goal of increasing mobile data subscriptions. Three hypotheses are assumed as potential bottlenecks limiting the mobile Internet diffusion:
• Hypothesis 1: Level of competence of users and mobile device features are the main bottlenecks in mobile Internet diffusion in emerging mobile markets
• Hypothesis 2: Pricing is the main bottleneck in mobile Internet diffusion in emerging mobile markets
• Hypothesis 3: Capacity is the main bottleneck in mobile Internet diffusion in emerging mobile markets
The bottleneck analysis executed in this chapter has two steps. First, per each city, a model of the mobile broadband market is evaluated and, as a result, the dominant bottleneck is identified by comparing obtained values across cities. Second, all three hypotheses are analysed in detail to understand the underlying causes of dominant bottlenecks. More precisely, socio-economic and regulatory factors such as levels of market concentration, regulatory frameworks (ITU Tracker), Gross National Income per capita, deployed mobile technology are taken into account. Finally, in the result section, dominant bottlenecks and their most likely cause are listed and recommendations issued.
Overall, the analysis takes into account data from 9 cities, 3 from advanced markets (Helsinki, London, Barcelona) and 6 from emerging mobile markets (Bangalore, Jakarta, Tehran, Mexico City, Sao Paulo, Dar es Salaam) as described in 3.2.
4.2
Model of Mobile Broadband Market
The mobile broadband market is modeled as a chain of multiplicative coefficients that take the total population as input (C) and give as result the number of subscriptions (S) in a particular country. Two coefficients are taken into account in the analysis: B0 as Market Satisfaction that addresses the satisfaction rate of users’ economic
Utility and, B1 as User Competence.
We introduce the consumer problem as the maximization of consumer surplus (CS) depending on Utilit


![Figure 3: LTE Network Architecture [22]](https://thumb-us.123doks.com/thumbv2/123dok_us/509894.2560150/19.892.166.771.517.690/figure-lte-network-architecture.webp)
![Figure 4: Functional split between E-UTRAN and EPC in LTE [22]](https://thumb-us.123doks.com/thumbv2/123dok_us/509894.2560150/20.892.206.726.149.466/figure-functional-split-e-utran-epc-lte.webp)