ESPON Policy Brief
4
Urban Partnership Themes
in a Wider Territorial Context
Over the last years, the movement in favour of an integrated European urban policy has gained momentum. Improving urban quality of life, addressing social challenges in cities, facilitating mobility and communications and ensuring that all cities fully contribute to national economic growth and job creation are important and interlinked objectives.
This discussion reaches an important milestone in June 2016, when EU member states and the European Commission will agree on an Urban Pact for Europe. During the Dutch Presidency in the
first half of 2016, pilot partnerships on four priority themes have been launched to test the proposed
new form of multi-level and multi-stakeholder cooperation: Air Quality, Housing, Urban Poverty and Inclusion of Refugees and Migrants (Figure 1).
The Urban Pact recognises that a growing number of urban challenges are of a local nature, but require a wider territorial solution. The increasing global competition and independencies call for a wider outlook on development opportunities and challenges than before. It also means that cities need better benchmarking of their comparative advantages and openness towards cooperation with other cities.
The Pact of Amsterdam stresses the need for evidence and recognises ESPON as a valuable
contributor of specific research activities to the selected themes of the EU Urban Agenda. Indeed,
territorial evidence can support the work of partnerships by helping to understand the diversity and territorial context of urban realities and to draw evidence-based policy proposals (either legislative
or financial).
In order to demonstrate the potential contribution of ESPON to the work of urban partnerships, this
Policy Brief aims at:
(1) showing examples of European-wide territorial evidence related to the first 4 partnerships of the Urban Pact that reveals the diversity facing cities within the same urban theme;
(2) presenting some observations and policy considerations that are relevant from a wider territorial perspective;
(3) informing the partnerships and all interested stakeholders of the approved plans to provide new evidence on the priority themes listed in the Urban Pact within the ESPON 2020 Cooperation Programme.
Key policy messages
Examples of EU wide evidence demonstrate a large diversity facing cities within each of the 4 urban themes. Analysis of presented evidence suggests a number of important messages that should be
taken into account in the work of partnerships and in the envisaged Action Plans:
1. Aknowledge diversity Understanding urban diversity within each priority theme is an
important precondition and starting point to arrive at proposals for Better Regulation, Better
Funding and Better Knowledge that would be relevant for different types of urban areas in the
European urban fabric. Neglecting urban diversity would result in a misused potential of the unique polycentric structure of Europe (Figure 1).
2. Consider territorial context The key social, economic and environmental opportunities
and challenges facing European cities in an era of globalisation cannot be defined solely within existing administrative boundaries but need to consider a wider territorial context, the
stronger international competition and the larger functional urban areas within which today’s
urban development takes place. Equally, the achievement of wider EU territorial development policies cannot be addressed without reference to the key role of Europe’s metropolitan areas, cities and towns.
3. Promote territorial cooperation Metropolitan regions, cities and towns, even very small
towns today need to consider joining forces in order to increase their development opportunities
and competitiveness. This model of cooperation is in principle relevant at all levels of the European urban fabric. The cooperation with neighbouring metropolitan regions, cities and towns is about exploring competitive advantages, enhancing agglomeration economies and together reaching a higher level of critical mass. Such cooperation needs leadership, dedication and drive in terms of governance in a wider territorial context.
Regional level: NUTS 0 (2010) Source: ESPON EGTC, 2016
Origin of data: EU Urban Agenda, May, 2016
© EuroGeographics Association for administrative boundaries
This map does not necessarily reflect the opinion of the ESPON Monitoring Committee
Partnerships of Member States and Urban Areas
0 240 480km © ESPON EGTC, 2016 EUROPEAN UNION London Utrecht Constanta Helsinki Milano Vienna Riga Scottish Cities Alliance
Barcelona Metropolitan Areas
Athens Berlin Amsterdam Birmingham Kortrijk Lille Daugavpils Timisoara Lodz Keratsini
Regional level: NUTS 3 (2010) Source: ESPON EGTC, 2016
Origin of data: Eurostat, JRC, EFGS, LandScan, REGIO-GIS, ESPON EGTC
© EuroGeographics Association for administrative boundaries
This map does not necessarily reflect the opinion of the ESPON Monitoring Committee
Type of NUTS3 region FUA & MEGA classifiaction
Global nodes 0 240 480km © ESPON EGTC, 2016 EUROPEAN UNION Acores Guyane Madeira Réunion Canarias Martinique Guadeloupe Valletta Roma Riga Oslo Bern Wien Kyiv Vaduz Paris Praha Minsk Tounis Lisboa Athina Skopje Zagreb Ankara Madrid Tirana Sofiya London Berlin Dublin Tallinn Nicosia Beograd Vilnius Kishinev Sarajevo Helsinki Budapest Warszawa Podgorica El-Jazair Stockholm Reykjavik København Bucuresti Amsterdam Luxembourg Bruxelles/Brussel Ljubljana Bratislava
Figure 1. First partnerships of Urban Areas and Member States within the Urban Pact (left) and European urban structure (right)
Priority theme ‒ Air quality
Air pollution is an environmental and a social issue with negative effects on human health, ecosystems, the built environment and the climate. It is a complex problem posing multiple challenges in terms of management and mitigation which it does not confine within administrative or natural boundaries.
Examples of evidence
There are a number of pollutants that affect air quality. Ground level ozone, nitrogen dioxide and particulate matter (PM) are identified as the main three pollutants that have the most significant impact on human health.
The map on the left in the Figure 2 presents the number of exceedances of the 120 mg/m3 threshold
for the 8-hours average, indicating that Southern Europe is particularly exposed to ozone. The most exposed areas in 2013 mainly concerned the cities in Po Valley (Milan, Verona, Turin, Genoa and Bologna), Southern France (Marseille, Nice, Lyon), Portugal (Lisbon), Spain (Madrid, Sevilla, Malaga, Barcelona and Alicante), Austria (Vienna), Germany (Dresden) and Czech Republic (Ostrava). The map in the middle in the Figure 2 presents the annual mean of nitrogen dioxide concentrations.
The concentrations should not be exceeding the annual limit value of 40 mg/m3. The cities’ footprint
in 2013 was clearly marked with annual background concentrations ranging from 20 to 20 mg/m3 in
most of the places, and reaching or being close to the limit value in few ones, especially in Milan and other cities in Po Valley, Paris and Lyon, London and Dusseldorf areas, but also in cities in Belgium and the Netherlands.
The map on the right in the Figure 2 displays the number of exceedances of the daily limit value of
PM10 of 50 μg/m3. The threshold of 35 days exceeding this value was reached in 2013 in Po Valley
(especially Milan and Verona areas), Paris and Lyon areas in France, Austria (Vienna), Germany (Dresden) and Czech Republic (Ostrava).
Figure 2. The main three pollutants that have the most significant impact on
human health: ozone (left), NO2 (middle), PM10 (right)
! ! ! ! ! ! ! ! ! ! ! ! ! ! ! ! ! ! ! ! ! ! ! ! ! ! ! ! ! ! ! ! ! ! ! ! ! ! ! ! ! ! ! Acores Guyane Madeira Réunion Canarias Martinique Guadeloupe Valletta Roma Riga Oslo Bern Wien Kyiv Vaduz Paris Praha Minsk Tounis Lisboa Athina Skopje Zagreb Ankara Madrid Tirana Sofiya London Berlin Dublin Tallinn Nicosia Beograd Vilnius Kishinev Sarajevo Helsinki Budapest Warszawa Podgorica El-Jazair Stockholm Reykjavik København Bucuresti Amsterdam Luxembourg Bruxelles/Brussel Ljubljana Bratislava
Regional level: NUTS 0 (2013) Source: Ensemble MACC-III validated re-analyses, 2013 Origin of data: MACC-III project, 2013 © EuroGeographics Association for administrative boundaries
Number of days when the 8-hours daily ozone average exceeded 120 µg/m3, 2013
This map does not necessarily reflect the opinion of the ESPON Monitoring Committee 0 5 10 15 20 25 30 35 40 0 240 480km © ESPON EGTC, 2016 EUROPEAN UNION ! ! ! ! ! ! ! ! ! ! ! ! ! ! ! ! ! ! ! ! ! ! ! ! ! ! ! ! ! ! ! ! ! ! ! ! ! ! ! ! ! ! ! Acores Guyane Madeira Réunion Canarias Martinique Guadeloupe Valletta Roma Riga Oslo Bern Wien Kyiv Vaduz Paris Praha Minsk Tounis Lisboa Athina Skopje Zagreb Ankara Madrid Tirana Sofiya London Berlin Dublin Tallinn Nicosia Beograd Vilnius Kishinev Sarajevo Helsinki Budapest Warszawa Podgorica El-Jazair Stockholm Reykjavik København Bucuresti Amsterdam Luxembourg Bruxelles/Brussel Ljubljana Bratislava
Regional level: NUTS 0 (2013) Source: Ensemble MACC-III validated re-analyses, 2013 Origin of data: MACC-III project, 2013 © EuroGeographics Association for administrative boundaries
Annual averages of NO2 concentrations,
2013
This map does not necessarily reflect the opinion of the ESPON Monitoring Committee 0 240 480km © ESPON EGTC, 2016 EUROPEAN UNION 0 5 10 15 20 25 30 35 40 ! ! ! ! ! ! ! ! ! ! ! ! ! ! ! ! ! ! ! ! ! ! ! ! ! ! ! ! ! ! ! ! ! ! ! ! ! ! ! ! ! ! ! Acores Guyane Madeira Réunion Canarias Martinique Guadeloupe Valletta Roma Riga Oslo Bern Wien Kyiv Vaduz Paris Praha Minsk Tounis Lisboa Athina Skopje Zagreb Ankara Madrid Tirana Sofiya London Berlin Dublin Tallinn Nicosia Beograd Vilnius Kishinev Sarajevo Helsinki Budapest Warszawa Podgorica El-Jazair Stockholm Reykjavik København Bucuresti Amsterdam Luxembourg Bruxelles/Brussel Ljubljana Bratislava
Regional level: NUTS 0 (2013) Source: Ensemble MACC-III validated re-analyses, 2013 Origin of data: MACC-III project, 2013 © EuroGeographics Association for administrative boundaries
Number of exceedances of the daily limit PM10 values of 50 µg/m3,
2013
This map does not necessarily reflect the opinion of the ESPON Monitoring Committee
0 10 20 30 40 50
0 240 480km
© ESPON EGTC, 2016 EUROPEAN UNION
Observations and policy considerations
Air pollution levels in Europe’s cities are heavily influenced by a combination of meteorological conditions, topography and extent of urbanisation. For example, the cities in the Po Valley face
the challenge of high density of anthropogenic emissions and the frequent occurrence of stagnant
meteorological conditions. All this makes it one of the ‘hot spots’ for air pollution. On the other hand, cities in the UK experience reduced levels of air pollution than they otherwise would due to the prevailing winds. Although European air quality is projected to improve in the future with the full implementation of existing legislation, the uneven distribution of air pollution exceedances will require tailored solutions in specific urban contexts for the protection of human health and the environment. In addition, as air pollution drifts across urban regions, a combined partnership and transnational effort will be required across the entire EU territory.
Integrated strategies in urban cross-border regions to reduce emissions should be considered to further protect human health and the environment in Europe and its cities, including greater cooperation in promoting a shift to more sustainable energy and transport sources, improving energy efficiency in buildings and transport as transnational green infrastructure networks. Holistic solutions are important that involve technological development, structural changes, include the optimization of infrastructures and urban planning, and provide for behavioural changes. This could be supported by a functional approach to the planning and management of urban regions in order to maximize the use of public transport, reducing car use and promoting a corresponding re-localisation of economic activities. At the same time, it is vital to share experiences in order to see how cities are facing more or less the same challenges and how different cities are trying to implement air quality legislation.
Priority theme ‒
Housing affordability
Housing affordability is most commonly described as the percentage of income that a household is spending on housing costs. According to Eurostat’s definition, a household is considered ‘overburdened’ when the total housing costs (‘net’ of housing allowances) represent more than 40% of disposable income (‘net’ of housing allowances), where housing costs include mortgage or housing loans interest payments for owners and rent payments for tenants. Utilities (water, electricity, gas and heating) and any costs related to regular maintenance and structural insurance are likewise included.
Examples of evidence
In 2014, 57.1 million people, or 11.4% of the EU population lived in households that spent 40 % or more of their equivalised disposable income on housing. The proportion of the population whose housing costs exceeded 40 % of their disposable income was highest for tenants living in the cities (13.1%), and lowest in rural areas (9.7%).
The EU-28 average masks significant differences between Member States: at one extreme there were
a number of countries where a relatively small proportion of the city population lived in households
where housing costs exceeded 40% of their disposable income, notably Malta (1.5%), Cyprus (5.2%), Norway (5.4%), Ireland, France (both 7.0%) and Finland (7.4%). At the other extreme, around just over two out of every five people in Greek cites and around one in five in Danish, German and Dutch cities spent more than 40% of their disposable income on housing (Figure 3).
The recovery from the financial crisis had different impacts on different parts of Europe regarding incomes and housing expenditures. Figure 3 shows that the share of population whose housing costs exceeded 40% of their disposable income has increased between 2009 and 2014 by 17 percentage points (pp) in the cities of Greece and by 5 pp in the cities of Slovenia, Luxembourg, Belgium and Bulgaria. On the contrary, the situation has improved the most in the cities in Denmark (8 pp), Norway and Hungary (6 pp respectively).
Observations and policy considerations
Housing affordability is a key issue in Europe’s cities. The ability to provide affordable housing in economically attractive areas is a key determinant for competitiveness. While the situation varies significantly across countries, available indicators point to the fact that housing-related expenditure is rising, especially in countries hardest hit by the crisis and austerity. Government intervention and policies profoundly influence housing affordability.
Housing affordability is not only relevant for the social policy of Member States and the EU, but can
also be considered from an economic policy point of view as an asset for development of urban
regions. The role of the supply of and access to affordable housing and the provision of other services and infrastructures are important factors for economic growth.
The availability of social housing and other affordable housing options can have an impact on the
stability of housing markets and therefore of the whole urban economy. There is a clear need for government investments in providing social and affordable housing through making use of EU structural funding and through initiatives such as EIB Affordable Housing Finance.
The heterogeneous nature of housing affordability across the EU territory suggests significant opportunities for Europe’s cities to collaborate and exchange best-practices. Achieving affordable quality housing could benefit from cities working in partnership to exchange best-practice and to build the case for increased investment in social housing.
0 10 20 30 40 EL DK DE NL BE CZ CH UK HU RO AT ES BG PL SK IT EE LU LV SE SI PT IS LT HR FI IE FR NO CY MT 2014 2009
Origin of data: Eurostat 2016
Figure 3. Housing cost overburden rate in cities (% of the urban population), 2009 & 2014
Priority theme ‒
Urban poverty and social exclusion
Poverty and social exclusion are social phenomena that affect urban areas all over Europe and not
only cities and regions in countries hit by the economic crisis of the last years. There are population groups in urban regions of prosperous countries, which face social exclusion phenomena, similar to those of less prosperous countries. The pilot partnership is focusing its attention on spatial concentration of structural poverty in deprived neighbourhoods (and regeneration of these areas) and child poverty.
Looking at different indicators, poverty and social exclusion can be defined in different ways: being severely materially deprived, living in a jobless household or household with very low work intensity and facing income poverty, i.e. living in a household with an “equivalised disposable income” (i.e. adjusted for the size and composition of households) below the at risk of poverty threshold set at 60% of the national median equivalised disposable income are some of the definitions.
Examples of evidence
In 2014, 122.3 million people, or 24.1% of the EU population were at risk of poverty or social exclusion.
The proportion of the population at risk of poverty or social exclusion in urban areas was slightly
higher in rural areas (27.1%) compared to cities (24.4%), but the ratio varies between countries, degrees of development and urbanisation.
The EU-28 weighted average masks significant variations between Member States. In 2014, about a third of the population living in cities was at risk of poverty or social exclusion in Greece and Bulgaria. The at-risk-of-poverty-or-social-exclusion figure was between 30 and 25% in Romania, Austria, Italy, United Kingdom, Portugal, Latvia, Spain, Ireland and Cyprus. At the other end of the scale, the lowest shares of persons being at risk of poverty or social exclusion were recorded in Iceland (10.7%), Norway (12.8%), Czech Republic (14.8%) and Slovakia (15.0%) (Figure 4).
The financial crisis, austerity and the recovery had different impacts on different parts of Europe regarding incomes and housing expenditures. Overall, the at-risk-of-poverty-or-social-exclusion rate in cities has increased between 2009 and 2014 by 11 percentage points (pp) in Greece, 6 pp in Portugal and Belgium, 5 pp in Estonia, Spain and Slovenia. It decreased by 8 pp in Latvia, 7 pp in Luxembourg and 6 pp in Bulgaria (Figure 4).
0 10 20 30 40 EL BG BE RO AT IT UK PT LV ES IE CY EE DK DE HU MT HR LT SI FR NL PL SE FI LU CH SK CZ NO IS 2014 2009
Figure 4. People at risk of poverty or social exclusion in cities (% of the urban population), 2009 & 2014
Observations and policy considerations
The economic crisis of the recent years has influenced to a different extent urban poverty and social exclusion in cities and regions in Europe, resulting among others in high unemployment rates.
Processes and patterns of exclusion and impoverishment may be observed at both macro and
micro-regional scales. Geographical distance has a direct role in driving poverty and social exclusion, especially in peripheral regions, where living costs are raised, access to services is more difficult, and social isolation is a real issue. These effects emphasise the “fixed” characteristics of localities. Other key issues (economic migration, urbanisation) relate to the mobility of individuals and groups. Although poverty is related to different issues, such as being deprived from covering basic needs, being unemployed or facing income poverty, social exclusion covers different aspects of the social life of people and refers rather to groups than individuals. At the same time, urban poverty and social exclusion often concern only some parts of cities.
Policies aimed at tackling urban poverty and social exclusion should consider widening the focus
upon income poverty, and also consider living costs and other less tangible related aspects, such as income inequality. Long-term trends, such as demographic ageing, may also have impacts on urban poverty and social exclusion which should be acknowledged.
It is important to adapt and further develop Urban forms of the SIP (Social Investment Package) giving more attention to adequate and sustainable social protection, such as by investing more in
developing human skills and capacities in order to improve the opportunities of the people
at-risk-of-poverty-or-social-exclusion to integrate in society and the labour market, and by ensuring that social protection systems respond adequately to people’s needs at critical moments during their lives.
Priority theme ‒
Inclusion of Refugees and Migrants
The recent events related to the Syrian civil war and the subsequent influx of refugees towards Europe have increased the need to define effective measures in Europe; its regions and cities need new approaches in managing this unprecedented migration crisis. Many efforts are already in place in welcoming and managing the many migrants and refugees. Moreover, while a European response
is currently being debated it is important to learn and be aware of the territorial and urban aspects of
the current refugee inflow to Europe.
Examples of evidence
The number of asylum applications and the number of people granted asylum or similar status has
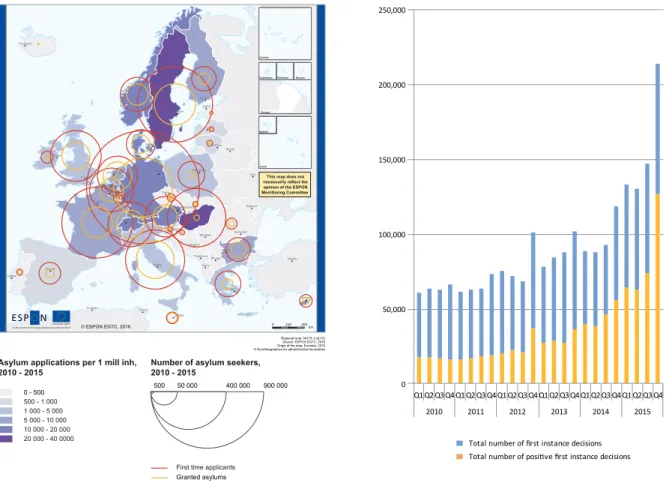
increased since over the recent years, according to data from Eurostat. Between 2010 and 2015, a total of 3.2 million first time asylum requests have been registered in EU member states and around 870,000 people have been granted asylum by first instance decisions averaging the Europe-wide acceptance rate to 39%. This is more than in any previous refugee crisis that has hit Europe since the Second World War. 1.32 million migrants and refugees have entered the EU and the partner states in 2015, compared to 595,000 in 2014 and 403,000 in 2013. This equals to approximately 0.26% of the entire population of the EU (508.2 million, 1 January 2015). The high inflow of arrivals
to Europe underlines the need for the implementation of measures aimed at creating facilities and
The countries that have received the most asylum requests within the last 5 years are Germany with 875,000 requests, Sweden with 390,000 requests, France with 344,000 requests, and Italy with 240,000 requests respectively. The overall acceptance rates have been the highest in Bulgaria (85%), Malta (77%), Denmark (58%), Netherlands (56%), Sweden (54%), Switzerland and Italy (51%). The
number of applications has been the lowest in the majority of the countries in Central and Eastern
Europe, but also in small countries in Western Europe such as Liechtenstein and Luxembourg, but also in Portugal, Ireland, Cyprus, Iceland and Malta. Looking at the proportion of asylum seekers in relation to the population of the respective countries, Sweden has had the biggest share of asylum applications compared to other European countries. For every one million people in Sweden, there are 40,000 asylum seekers from which 11,000 have been accepted so far. The pressure has been very strong also in Hungary (24,000 per mill inh), Malta (21,000 per mill inh), Switzerland (16,000 per mill inh) and Norway (15,000 per mill inh) (Figure 5).
Observations and policy considerations
Refugee crisis is predominantly an urban issue. More than 60% of the world’s refugees are in urban areas, and nearly 20% just in the world’s 20 largest cities. Therefore, municipalities, cities and towns in arrival, transit and destination countries in Europe play a special role regarding the social, humanitarian and financial assistance needed in relation to the current refugee flows. It is
most often the cities where asylum seekers wait for a decision on their refugee status and where aid
and necessary services are provided to them, their families and children. It is also in cities where
Figure 5. First time asylum applications and granted asylums, 2010 - 2015 Acores Guyane Madeira Réunion Canarias Martinique Guadeloupe
Regional level: NUTS 3 (2013) Source: ESPON EGTC, 2016 Origin of the data: Eurostat, 2016 © EuroGeographics for administrative boundaries
This map does not necessarily reflect the opinion of the ESPON Monittoring Committee
Asylum applications per 1 mill inh,
2010 - 2015 Number of asylum seekers,2010 - 2015
0 240 480km © ESPON EGTC, 2016 EUROPEAN UNION 20 000 - 40 0000 10 000 - 20 000 5 000 - 10 000 1 000 - 5 000 500 - 1 000 0 - 500 500 50 000 400 000 900 000 Acores Guyane Madeira Réunion Canarias Martinique Guadeloupe Valletta Roma Riga Oslo Bern Wien Kyiv Vaduz Paris Praha Minsk Tounis Lisboa Athina Skopje Zagreb Ankara Madrid Tirana Sofiya London Berlin Dublin Tallinn Nicosia Beograd Vilnius Kishinev Sarajevo Helsinki Budapest Warszawa Podgorica El-Jazair Stockholm Reykjavik København Bucuresti Amsterdam Luxembourg Bruxelles/Brussel Ljubljana Bratislava ! ! ! ! ! ! ! ! ! ! ! ! ! ! ! ! ! ! ! ! ! ! ! ! ! ! ! ! ! ! ! ! ! ! ! ! ! ! ! ! ! ! !
First time applicants
Granted asylums 0 50,000 100,000 150,000 200,000 250,000 Q1 Q2 Q3 Q4 Q1 Q2 Q3 Q4 Q1 Q2 Q3 Q4 Q1 Q2 Q3 Q4 Q1 Q2 Q3 Q4 Q1 Q2 Q3 Q4 2010 2011 2012 2013 2014 2015
Total number of positive first instance decisions Total number of first instance decisions
The refugees and migrants have been coming from more than 140 different countries and entail a large heterogenity in terms of education, skills, culture and language. In practical terms, this diversity
is important to take into account for the means of integration of people into society and labour
markets. It depends upon the development of comprehensive tailor-made integration measures that meet the individual needs concerning the vast number of countries of origin and different educational, language and cultural backgrounds.
Effective integration policies and efforts are needed at regional and urban level in order to harvest
the potential regional and local benefits, including support in finding jobs, housing, social services, education, health care, etc.
Early investment in integration is essential and has proven itself to pay off in the long run. Past experience with the reception of significant number of refugees and migrants has shown that, in the longer term, not investing in integration facilities and support leads to higher economic and social costs in terms of unemployment, social benefits, poor school performance, social tensions, segregations, etc.
Complementing with bottom-up approaches involving different actors, levels of governance and with the help and cooperation with all stakeholders, local inhabitants, civic society, organisations and employers seem to be key for an effective and successful integration policy. Coordinating efforts among European cities in defining approaches and mobilizing resources for integration could support cities in this process. In support of an improved dialogue, a platform for exchange of knowledge between stakeholders would be vital to share experiences, to see how cities facing more or less the same challenges and cities with different challenges and context, are trying to integrate refugees.
Disclaimers:
The content of this publication does not necessarily reflect the opinion of the ESPON 2020 Monitoring Committee.
ISBN: 978-2-919777-96-9 © ESPON
Reproduction is authorized provided the source is aknowledged and a copy is sent to the ESPON EGTC.
ESPON 2020 - More information ESPON EGTC
4 rue Erasme, L-1468 Luxembourg - Grand Duchy of Luxembourg Phone: +352 42 59 91 4700
Email: info@espon.eu
www.espon.eu, Twitter, LinkedIn
The ESPON EGTC is the Single Beneficiary of the ESPON 2020 Cooperation Programme. The Single Operation within the programme is implemented by the ESPON
The contribution of ESPON to the European Urban Agenda: plans for new territorial
evidence
In previous years, ESPON has developed a wealth of knowledge and evidence relating to the territorial dimension of the European urban fabric. This knowledge includes applied research and targeted analysis on urban agglomerations; territorial cooperation and governance; functional urban regions and metropolitan networks; the role of cities in territorial development; cross-border polycentric metropolitan regions and city networks; secondary growth poles in various territorial contexts; and the functional role of small and medium sized towns.
So far, a wide number of ESPON projects have dealt with different aspects of urban development and the role of cities in territorial development including: the future orientation of cities (FOCI), territorial impact of globalisation (TIGER), second tier cities (SGPTD), small towns (TOWN), urban functions (BEST METROPOLISES) and poverty and social exclusion (TIPSE). In 2014, ESPON also produced Territorial Observation No 13 “Evidence for a European Urban Agenda” which synthesises much of the urban focussed territorial evidence produced by the ESPON 2006 and 2013 programmes. Going forward, the launch of the ESPON 2020 Cooperation Programme also brings new opportunities for providing evidence to better understand Europe’s cities in a wider territorial context. ESPON will invest over €15 million in funding policy-driven applied research and analyses over the period to 2020. In 2015, seven projects were launched which include critical thematic areas relevant to the EU urban agenda, such as the geography of new employment dynamics, SMEs in Europes regions and cities; inner peripheries and territories facing challenges to access to services of general interest; global FDI flows towards Europe; territories and low carbon economy; comparative analyses of planning systems of spatial governance; and possible territorial futures for Europe. In addition, ESPON has allocated over €7 million for targeted stakeholder analyses, where policymakers can develop and submit their own research proposals which will be considered for implementation by ESPON. These projects would be of specific interest to the thematic partnerships in achieving better knowledge exchange, better use of financial instruments and better regulation. ESPON will also continue to
develop and maintain a database of European territorial evidence and to develop online analytical
tools for territorial analysis which will be of specific interest to urban policymakers in developing evidence informed policies.