Defending Mobile Phones from Proximity Malware
Gjergji Zyba, Geoffrey M. Voelker
Department ofComputer Science and Engineering University of California
La Jolla, CA, USA
{gzyba, voelker}@cs.ucsd.edu
Michael Liljenstam, Andr´as M´ehes
Ericsson ResearchStockholm, Sweden [email protected]
Per Johansson
California Institute forTelecommunications and Information Technology
La Jolla, CA, USA [email protected]
Abstract—As mobile phones increasingly become the target of propagating malware, their use of direct pair-wise communica-tion mechanisms, such as Bluetooth and WiFi, pose considerable challenges to malware detection and mitigation. Unlike malware that propagates using the network, where the provider can employ centralized defenses, proximity malware can propagate in an entirely distributed fashion. In this paper we consider the dynamics of mobile phone malware that propagates by proximity contact, and we evaluate potential defenses against it. Defending against proximity malware is particularly challenging since it is difficult to piece together global dynamics from just pair-wise device interactions. Whereas traditional network defenses depend upon observing aggregated network activity to detect correlated or anomalous behavior, proximity malware detection must begin at the device. As a result, we explore three strategies for detecting and mitigating proximity malware that span the spectrum from simple local detection to a globally coordinated defense. Using insight from a combination of real-world traces, analytic epidemic models, and synthetic mobility models, we simulate proximity malware propagation and defense at the scale of a university campus. We find that local proximity-based dissemination of signatures can limit malware propagation. Globally coordinated strategies with broadcast dissemination are substantially more effective, but rely upon more demanding infrastructure within the provider.
I. INTRODUCTION
Mobile phones are increasingly becoming the target of malware, with over 200 malware variants discovered by early 2007 [1]. The potential effects of virulent malware propaga-tion on consumers and mobile phone providers are severe, including identity and information theft, permanently disabling devices (“bricking”), and excessive fees to customers or loss of revenue for mobile phone providers.
As on the Internet, malware can use the mobile phone network to propagate. However, malware quickly encounters resource bottlenecks due to how mobile phone networks are provisioned. More importantly, with the ability to both cen-trally monitor and block propagating malware, mobile phone networks can quickly detect malware and employ defenses to contain it before it infects much of the susceptible device population [2].
Mobile malware, however, has another opportunity for propagation. It can propagate through direct pair-wise com-munication mechanisms, such as Bluetooth or WiFi, between devices in geographic proximity [3], [4]. Although slower than propagating over the network,proximity malwarehas the
compelling advantage of being unobserved by the provider network — making detecting proximity malware substantially more challenging.
In this paper we consider the dynamics of mobile phone malware that propagates by proximity contact, and we evaluate potential defenses against it. The dynamics of proximity propa-gation inherently depend upon the mobility dynamics of a user population in a given geographic region. Unfortunately, there is no ideal methodology for modeling user mobility. Traces of mobile user contacts reflect actual behavior, but they are difficult to generalize and only capture a subset of all contacts due to a lack of geographic coverage. Analytic epidemiological models are efficient to compute and scale well, but simplify many details. Synthetic models are flexible and provide the necessary geographic coverage, but lack the full authenticity of user mobility traces.
Lacking a single ideal method, we use all three approaches to study proximity malware propagation at the scale of a uni-versity campus. For evaluating detection and defense, we use the Levy walk synthetic mobility model because it provides complete geographic coverage of user contact dynamics, and previous work has shown it to be much more realistic than other synthetic models [5]. We also use traces from Bluetooth scanners collected over seven months on the UCSD campus to corroborate the propagation results from the synthetic model. Finally, we use an analytic model as yet another method to cross-validate the baseline results of our simulator. Using multiple methods provides confidence in the implementation of our simulator and mobility modeling.
Defending against proximity malware is particularly chal-lenging since it is difficult to piece together global dynamics from just pair-wise device interactions. Traditional network defenses depend upon observing aggregated network activity to detect correlated or anomalous behavior. With proximity malware, however, observations are inherently local since they do not involve network infrastructure. Proximity malware detection, therefore, must begin at the device.
We explore three strategies for detecting and mitigating proximity malware: local detection, in which devices detect when they become infected and disable further propagation; proximity signature dissemination, in which devices create content-based signatures of malware and disseminate them via proximity communication as well; andbroadcast signature
dissemination, in which a centralized server aggregates obser-vations from individual devices, detects propagating malware, and broadcasts signatures to mobile devices. These strategies span the spectrum from simple local detection to a globally coordinated defense. We find that proximity signature dis-semination can limit malware propagation to a fraction of the susceptible population, and do so without relying upon provider network infrastructure. However, with the assistance of the provider, broadcast dissemination is most effective.
The rest of this paper is organized as follows. Section II discusses related work on self-propagating malware in mobile phone networks. Section III describes the infection models we consider, our simulation and analytic methods, and traces we use as input. Section IV describes three defense strategies to proximity malware, and Section V evaluates their effectiveness on containing propagation. Finally, Section VI concludes and outlines directions for further work.
II. RELATED WORK
A number of studies have demonstrated the threat of mal-ware propagation on mobile phones through proximity contact such as Bluetooth. Su et al. gather Bluetooth scanner traces and use simulation to demonstrate that malware propagation via Bluetooth is viable, and explore its propagation dynamics [6]. Kostakos et al. also simulate the propagation of proximity malware on extensive scanner traces of a downtown city center [7]. Yan et al. develop a detailed Bluetooth worm simulation [8] and analytic model [9], and show that mobility can have a significant effect on propagation dynamics by simulating with different mobility models [10]. Bose and Shin show that a worm that uses both SMS/MMS and Bluetooth can propagate faster than by messaging alone [11].
Initial work has explored defending mobile devices against malware propagating using the provider network. Bose and Shin propose a proactive approach to identify vulnerable devices, and to rate-limit and quarantine SMS communica-tion [12]. Van Ruitenbeek et al. also investigate propagacommunica-tion of MMS/SMS malware and various responses [13]. Previously, we evaluated aggressive malware propagating over provider networks using messaging and VoIP, and argued that the centralized infrastructure of mobile provider networks makes centralized defenses effective at limiting the spread of malware to a small fraction of the susceptible population [2]. De-fending against proximity malware, however, poses different challenges since the provider network is no longer involved in propagation and therefore cannot be the first line of defense.
Recently, Bose et al. and Kim et al. have proposed two techniques for using behavioral signatures [14] and power sig-natures [15] for locally detecting malware on mobile devices. Our work is complimentary to these approaches in that they represent methods for deciding when a device has become infected (although malware may continue to propagate in the meantime). Our study investigates how such local detection impacts the overall propagation of malware in a population, particularly if devices actively coordinate to mitigate it.
Proximity malware propagation fundamentally depends upon user mobility dynamics. Previous approaches to represent mobility have used scanner traces, synthetic random walk models, and analytic techniques. We draw upon all three approaches to inform our study. But, our primary goal is to understand the effectiveness of defenses, not to develop new mobility and modeling techniques. The Bluetooth scan-ner traces we gather, for example, are similar to previous efforts [6], [7]. Previous work on analytic models strives to accurately describe malware propagation over Bluetooth or other forms of proximity connections [9], [16]–[18]. We use simple epidemic models to verify the operation of our simulator and as a means for validating our simulation results. Further, since analytic models do not capture spatial locality, they can only roughly approximate mobility dynamics and are heavily dependent on the mobility assumptions [10]. Going beyond simple random walk models [8], we use the Levy walk model for generating synthetic mobility traces; this model can describe the mobility patterns of a human being relatively well for concentrated areas [5]. Recently, Gonz´alez et al. tracked mobile devices at large geographic scales (up to 1,000 km), showing that the Levy walk model is not as representative at those scales [19]. We focus at much smaller scales, where spatial locality makes proximity malware most virulent.
III. METHODOLOGY
In this section we describe our methodology for studying proximity malware propagation. Fundamental to propagation is modeling how devices encounter each other as a basis for infection. We explore the use of three methods — traces of real user encounters, a synthetic model of user mobility, and an analytic model — and discuss how the methods can com-plement and corroborate each other, while also highlighting limitations in the process.
A. Simulating malware propagation
We simulate relatively simple, aggressive proximity mal-ware. Such malware may exploit vulnerabilities in the com-munication stack [6], or it may depend upon user interaction for successful infection [3]. Although relying upon user in-teraction may seem naive, such social networking “exploits” can be surprisingly effective. For example, the Cabir [3] worm periodically searches for discoverable devices via Bluetooth. If it finds a device, it asks to send a file using the OBEX protocol and waits for the remote user to accept. Cabir locks itself on that device until the victim accepts or goes out of range. In either case, it will search again for other devices. Commwarrior [4] uses both MMS and Bluetooth to propagate. With Bluetooth, it searches for nearby discoverable devices as Cabir does. Instead of locking itself on one device, though, it asks multiple devices for a file transfer and sends to each device that accepts the file transfer a copy of the infectious file (as long as they remain within range).
We implemented a software simulator to model malware propagation and evaluate defense strategies. Our simulator accepts as input device encounters, i.e., events corresponding
to when two devices start or stop being able to communicate with each other. We generate such events either from real traces or synthetic models. When two devices come within range of each other, the simulator adds them to a proximity list for each device. When devices move too far away to communicate, the simulator removes them from the lists. At any point in time, the simulator tracks whether devices are infected, communicating, disabled, etc.
The simulator models aggressive malware propagation. If an infected device is not busy (not currently communicating with another device), it will randomly pick up an idle device (not currently communicating) from its proximity list that it has not communicated with before. If it is unable to find a new idle device, it will remain idle until another device contacts it or is added to its proximity list. An infection takes some amount of time corresponding to delays due to Bluetooth association, file transfer, user interaction, malware execution time, etc. After this parameterizedinfection latency, the simulator changes the state of a vulnerable target to infected, and both devices are free to continue the propagation. The simulator also models a fraction s of the mobile devices as susceptible targets of infection. Parameterizing susceptibility in a device population models such variabilities as hardware platform, software ver-sioning, or user response, all of which may prevent malware from infecting a particular device. The simulator outputs the state of devices over time and the interactions that cause an infection. We use this output to compare different propagation scenarios and methodologies.
B. Real Traces
The primary advantage of trace data is that it reflects actual user behavior. Complementing other efforts [6], [7], we collected trace data of user contacts using Bluetooth sensors installed at six active locations (the food court, main library entrance, etc.) on the UCSD campus. The sensors continuously scan for the presence of discoverable Bluetooth devices, sampling on average every 10 seconds, and store the scan results to a central database. Each record stores the unique ID for the device and the time that the device enters or leaves the proximity of a scanner; we assume that a device has left if it does not appear in a sensor scan list after 60 seconds. Over the span of seven months, these scanners recorded more than 1.6 million events for over 8,000 devices.
We transform raw scan data into device contact events in two steps. First, we calculate the time intervals for which a device is within range of a sensor. Then, for each sensor, we determine all devices whose intervals overlap in time, and define such devices to be in proximity contact with each other. As with previous studies, we make the assumption that two devices can communicate with each other if they are detected by the same sensor. Note that this assumption may include devices that may not actually be able to directly communi-cate since the actual locations of the devices is not known relative to the scanner position; for malware propagation, this assumption tends to be conservative since it may provide more opportunities for propagation than in actuality.
0 10 20 30 40 50 60 70 80 90 100 0 10 20 30 40 50 60 70 80 Encounters (%)
Encounter duration (seconds) NCSU
SF KAIST
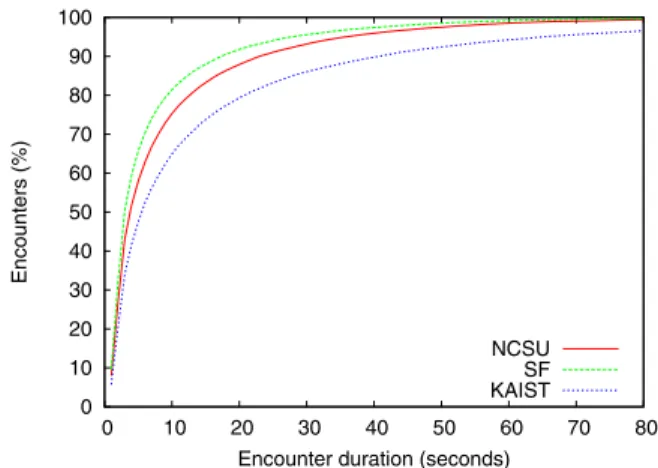
Fig. 1. CDF of encounter durations using the Levy walk mobility model.
Since malware will take time to propagate between two devices, we keep track of the durations for which two devices are in contact. The simulator tracks malware propagation time to model whether the contact duration of two devices is long enough for malware to successfully propagate between them. C. Synthetic Traces
One limitation with using real traces is that it is difficult to cover an entire geographic area with sensors. As a result, real traces will not capture device contacts outside of sensor range, potentially influencing propagation results. An alternative is to use a synthetic mobility model to produce device contacts for an entire geographic area, albeit an area simplified from any particular real location.
We use the Levy walk mobility model to generate synthetic device contact events. Previous work has shown that the Levy walk model can describe the mobility patterns of a human being relatively well for a campus-sized area [5] (although perhaps not at larger scales [19]). A Levy walk is a collection of flights, angles, and wait times. A flight is a straight line of movement of a given distance. An angle denotes the turning angle at the end of the flight. A wait time is the waiting time between two subsequent flights. Flight length and wait time are calculated from the Levy distribution with some scale factorc (10 for flight length and 1 for wait time) and two parameters aandb.
Parameters a and b affect the flight length (and speed, consequently) and wait time distributions, respectively. Rhee et al. derive parameters for various user traces collected across a wide range of settings, from university campuses to amuse-ment parks [5]. The parameter values typically range between 0.5–1.5 and reflect the geographic characteristics of the place; some places tend to have more “localized” movements than others. Note that smaller values reflect longer flight lengths and wait times. From their experiments, for example, the “San Francisco” (SF) traces(a= 0.75, b = 1.68)give the highest contact rate, “KAIST” traces(a= 0.97, b= 0.45)the lowest, and the “NCSU” traces(a= 0.86, b= 0.99) strike a balance between the two. A contact between two devices happens when the devices come within 10 meter range of each other (a reasonable distance for Bluetooth).
0 20 40 60 80 100 120 140 160 180 0 20 40 60 80 100 120 140 Number of Devices
Number of unique encounters
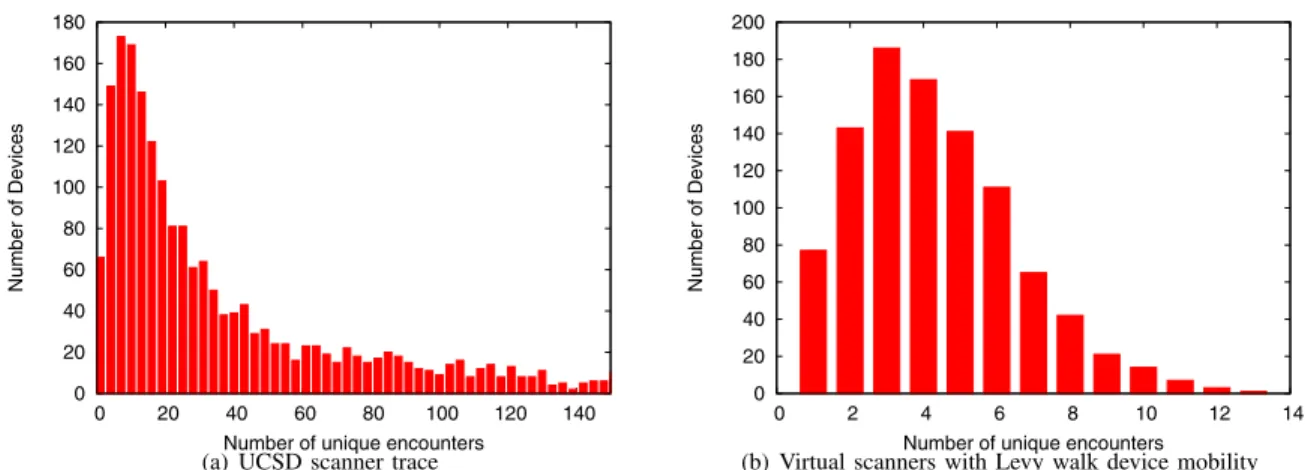
(a) UCSD scanner trace
0 20 40 60 80 100 120 140 160 180 200 0 2 4 6 8 10 12 14 Number of Devices
Number of unique encounters
(b) Virtual scanners with Levy walk device mobility Fig. 2. Distributions of unique device contacts:ydevices encounteredxother unique devices.
Recall that the simulator takes into account the infection latency, or the time it takes one device to infect another. For a successful infection, the devices must be in range long enough for a transfer to take place. Figure 1 shows the distribution of contact durations for the “SF”, “NCSU”, and “KAIST” parameterizations of the Levy walk model. Unless otherwise specified, in our experiments we use an infection latency of 10 seconds. Although this value might seem high at first, Bluetooth handshakes take at least five seconds, and transferring malware files the size of Cabir and Commwarrior double that time. As a result, infection latency substantially reduces the number of infection opportunities in practice. For the “NCSU” Levy parameters, for example, only 25.4% of all encounters have sufficient duration to permit an infection. D. Analytic Epidemic Models
To verify the operation of our simulator and to provide an additional means of comparison, we also employ a simple ana-lytical SI epidemic model [20]. This model and enhancements have been usefully applied to malware propagation on the Internet, and we apply it to the problem of proximity malware as well. The model has the form:
ds(t)
dt = −βs(t)i(t) (1) di(t)
dt = βs(t)i(t) (2) where, at timet,s(t)is the number of susceptible individuals, i(t) is the number of infected individuals, and the total population is constant, so that ∀t, s(t) +i(t) = N. β is the infection parameter (describing disease infectiousness).
This epidemic model, using differential equations, is an approximation of the average behavior for large populations of what is in actuality a stochastic process. The model assumes homogeneous mixing and is based on the law of mass action formulation. Homogeneous mixing means, roughly, that at any given time any two individuals have an equal probability to have a contact. The law of mass action, in a population context, implies that the rate of contacts between populations is proportional to the product of the sizes of the populations.
To calculate the infection parameter β, we consider the device encounters used to drive our simulations and compute the mean encounter rater over all devices. If all contacts are infectious, β is the pairwise contact rate, i.e., β = rxy for devicesxandy. In practice, because a minimum contact time is required for Bluetooth to transmit the infection, we let
β =p1·rxy=p1·Nr 2
where p1 denotes the fraction of contacts long enough for a
single (infectious) transmission.
Given the mean encounter rate r, the device population N, and the fraction p1 as inputs, it is straightforward to
numerically calculate the number of infections over time. E. Corroboration and validation
Finally, we explore ways in which we can use these three methods of generating device encounters to complement and corroborate each other. For studying proximity malware de-tection and defense in Section V, we primarily use synthetic contacts generated by the Levy walk model. The traces and analytic model are helpful, however, for corroborating results when using a synthetic mobility model and validating the implementation of our simulator.
1) Bridging real traces and synthetic models: Consider the UCSD Bluetooth traces. They represent a finite number of scanners placed at specific locations in a larger geographic region. We can perform a similar experiment with the Levy walk model, randomly placing “virtual” scanners in a region and recording the contacts only observed at those virtual scanners. We can then compare the real trace and synthetic model from similar perspectives. We perform this experiment for the Levy walk model for 1,000 devices in a 9 km2 campus-sized geographic region with six scanners. We use the “NCSU” parameters [5] for generating Levy walks, which strike a balance between the “SF” and “KAIST” extremes. For each simulation run, we generate a Levy trace and randomly choose 1% of the devices to initiate the malware propagation. We repeat this experiment 100 times, choosing different initial devices on each run.
0 20 40 60 80 100 0 1 2 3 4 5 6 7 Infected Devices (%) Months
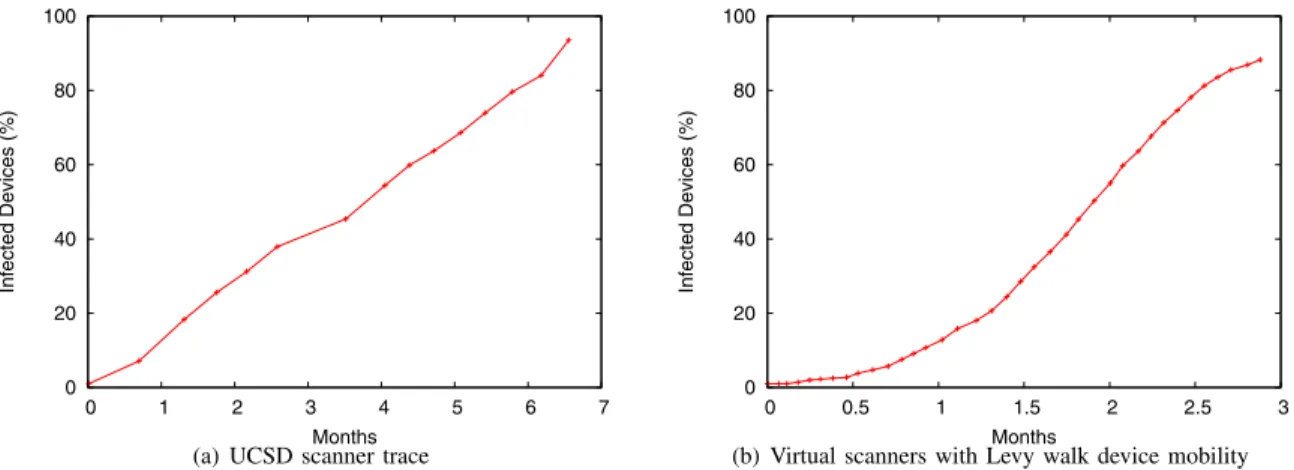
(a) UCSD scanner trace
0 20 40 60 80 100 0 0.5 1 1.5 2 2.5 3 Infected Devices (%) Months
(b) Virtual scanners with Levy walk device mobility Fig. 3. Malware propagation over time based upon contacts from real scanner traces (UCSD) and simulated virtual scanners (Levy walk).
First, we compare the contact distributions from the UCSD trace and the virtual scanner traces from the Levy walk model. The contact distribution is an important metric reflecting the mobility characteristics of users in an area, particularly as it applies to propagating malware. Figure 2 shows the contact distributions for the UCSD and Levy traces. Each graph shows the number of devices y that encountered x other unique devices; e.g., in the UCSD trace 170 devices had 10 encounters with unique devices. As with previous studies of contact, we see that a few devices are very popular while many have far fewer contacts. Although we do not expect the absolute parameters of the distributions to be the same for the two approaches, it is encouraging that this popularity property holds for both synthetic and real traces.
Next, we also simulate the propagation of malware using both contact traces. We simulate a very simple scenario where all devices are vulnerable and infecting a device on contact is instantaneous. We use the same percentage of initial infected devices as above. For this experiment, Figure 3 shows the percentage of infected devices as a function of time for the UCSD and Levy traces, respectively. In both figures, each point shows the median percentage across all of the different cases of initial devices. We do not expect these infection results to be good predictors of an actual infection due to their limited geographic coverage, which results in unrealistically long infection times (months!). However, in terms of evalu-ating the characteristic behavior of the underlying processes, we again find it encouraging that the curves exhibit roughly similar behavior — albeit with some variation, particularly at the ends of the distribution.
We consider these experiments a form of sanity check. Keeping that perspective in mind, though, we find it en-couraging that the synthetic model, when used under similar constraints as real-world traces, produces roughly similar behavior in contact distributions and malware propagation as the scanner data. We also note, however, that the results in Figure 3(b) reflect the use of “virtual” scanners, which only sample a spacial subset of an entire region, and will therefore differ from results that model all of the device contacts for an entire region (which we use when evaluating defenses in
0 20 40 60 80 100 0 1 2 3 4 5 Infected Devices (%) Hours Epi-SF Hom-SF Levy-SF Epi-KAIST Hom-KAIST Levy-KAIST
Fig. 4. Malware propagation according to the epidemic model, homogeneous mixing contacts, and the Levy walk model.
Section V). Using contacts based solely on real scanner traces can predict malware propagation orders of magnitude slower than contacts based on an entire region, a limitation that needs to be kept in mind when using scanner traces as the basis for proximity malware propagation.
2) Bridging the analytic and synthetic models: We can also use the analytic model in validating the implementation of the simulator. The simple SI model assumes homogeneous mixing. We can also generate a synthetic trace of homogeneous random contacts at a constant rate, and compare malware propagation based on the SI model and simulation using the homogeneous trace.
Figure 4 shows the results of a numerical solution of the epidemic model (“Epi”) and results from two kinds of simulations, one using the “homogeneous mixing” of devices in an area (“Hom”) and the other using the Levy walk model (“Levy”). The graph shows the percentage of vulnerable devices infected as a function of time. For each method, we show curves for two contact rates, the “San Francisco” (SF) and “KAIST” parameter sets described in Section III-C; these two sets represent the extremes in contact rates among the traces evaluated in [5]. For both the homogeneous mixing and Levy walk scenarios, we simulate a simple infection where all devices are vulnerable, and infection latency is 10 seconds.
Comparing the results of the epidemic model and simulation using homogeneous mixing contacts, we find that they are in close agreement, validating that the simulator operates as expected. Of course, homogeneous mixing contacts are not a good approximation for encounters of mobile devices. Previ-ous work [10], [16] has shown that simulations of proximity malware propagation using random walks or random waypoint mobility generally do not appear to match results from the simple epidemic model, as the contact structure tends to differ from homogeneous mixing. However, as these mobility models are not considered particularly realistic, it was not clear what the implications are for comparing the epidemic model with more realistic mobility models such as Levy walks.
Comparing the results of the epidemic model and simulation using the Levy walk model provides insight on this question. For the SF scenario, with higher mobility, there is a small discrepancy between the simulations and the epidemic model, such that Levy walk contacts result in somewhat slower spread of the malware. Intuitively this is not surprising, as one would expect spatial locality in the contacts resulting from Levy walks that is not present in a homogeneous mixing model. The spatial locality implies that initially only contacts occurring in a subregion around the initial infection location can transmit the infection. Hence, this behavior slows down the spread of the malware. For the “KAIST” scenario, with shorter flight lengths and longer pause times resulting in less “mixing”, this discrepancy is more pronounced.
IV. PROXIMITYMALWAREDEFENSE
We evaluate a set of defenses under the following general scenario. We assume that devices have a trusted defense software component that can examine messages and files transferred between devices, securely record persistent infor-mation about these transfers, and control device hardware when necessary (e.g., disable radio communication). These assumptions may be strong, but not unreasonable given the increasing prevalence of trusted computing modules. However, if malware has the ability to disable defense software, we can predict what the result will be: unchecked propagation through a population, as in Figure 3 and previous work.
We model malware detection at the device using one or multiplecontactswith other infected devices as evidence. This approach idealizes the use of a particular detection technique. For example, a device may be able to detect that it has become infected on first contact with another infected device using a behavioral technique like system call anomaly detection. Or the device may have received a signature, from another device or the network, that enables it to use content analysis to detect on first transmission that a message or file is malware.
Alternately, a device can be suspicious about being con-tacted by multiple other devices to transfer the same file, eventually concluding that the other devices are likely infected and the file they are sharing is malware. Having multiple independent devices try to communicate the same file is reasonably suspicious behavior, and certainly characteristic of propagating malware. A paranoid setting might label a file as
malware after only two such contacts; a more lenient, perhaps more risky, setting might wait for three or more contacts. Such a technique requires storing hashes of file content managed as a cache, and is vulnerable to polymorphic attacks.
Note that, for any technique that requires more than one contact, after the first contact we assume the device is infected and can infect other devices. Also, any of these techniques may lead to false positives. Without good workload studies on communicating Bluetooth applications, however, it is difficult to evaluate what the false positive rate of any particular technique may be. This issue remains an open question.
Based upon this general scenario, we explore the following three defense strategies. We abstract any specific technique by parameterizing the number of contacts with infected devices required for a device to decide whether it has become infected. A. Local detection
The first strategy simply uses local evidence to detect malware and prevent further dissemination by the device, such as by disabling the Bluetooth or WiFi radio. Preventing further propagation by disabling communication may inconvenience the user, but voice and messaging with the provider network remain possible. Disabling the malware prevents further prop-agation but makes no attempt to notify other devices or the network about the presence of malware. It serves as a useful baseline for comparison. We parameterize local detection with a threshold number of contactsn with other devices: after n unique contacts, the device decides that it is infected and stops propagating the malware.
B. Proximity signature dissemination
The second strategy extends local detection with an active mitigation component. In this strategy, each device maintains a tableS of signatures of malware files, such as an MD5 hash over the file content. After a deviceX infers that it is infected, it disables1the malware and warns subsequent devices about it.
DeviceXcomputes a content-based signaturesover the file(s) that triggered the infection recognition (e.g., the hash it has used to track file transfers in the first place). WhenX comes into proximity contact with another deviceY,X disseminates the signaturestoY. IfY is infected, it immediately disables the malware.Y then addssto its signature tableS. Whenever another device shares a file with Y, Y will check the file against the signatures in S. The device can then either delete the file, or warn the user about the file.
We note that this strategy makes a number of assumptions. It is, in effect, a “white worm” [21]. Such worm defenses have not been effective in the Internet environment, but it remains an open question for proximity malware. It also assumes that a device can trust signatures received from other devices. Using signed signature transfers between the defense software components on both devices would be one mechanism for establishing this trust.
1For example, the trusted component may start filtering outgoing infection attempts.
C. Broadcast signature dissemination
The third strategy relies upon the network provider to dis-seminate signatures using a broadcast mechanism. In addition to standard unicast messaging, providers are also able to send data packets over broadcast at low cost [22].
In this strategy, whenever a device decides that it is infected, it sends the malware content to an anti-virus server in the provider network (e.g., using MMS). The server, since it presumably contains far greater processing power than the mobile devices, can compute a better quality signature. Also, due to access to anti-virus experts, the server may also be able to compute a patch that contains information on how devices may “cure” themselves, i.e., remove the infection from the device. Manual involvement in generating patches is also a possibility.
Then, when the provider’s anti-virus server receives at least m alerts from unique devices for a particular malware instance, it broadcasts a generated signature to the entire mobile network. This signature immediately cures all infected devices and renders uninfected devices invulnerable.
V. EXPERIMENTAL RESULTS
In this section we evaluate the three mitigation strategies described above. We implemented them in our simulation framework and use the Levy walk mobility model as the basis for generating device contacts. Unless otherwise specified, we simulated 100 devices in a 1km2 region with one initially infected device, and used ten random Levy walk traces with 100 random initial device selections each. Since it is tractable to extend the epidemic model to capture the effects of the local detection strategy, we presents results for that method as well for comparison.
A. Local Detection
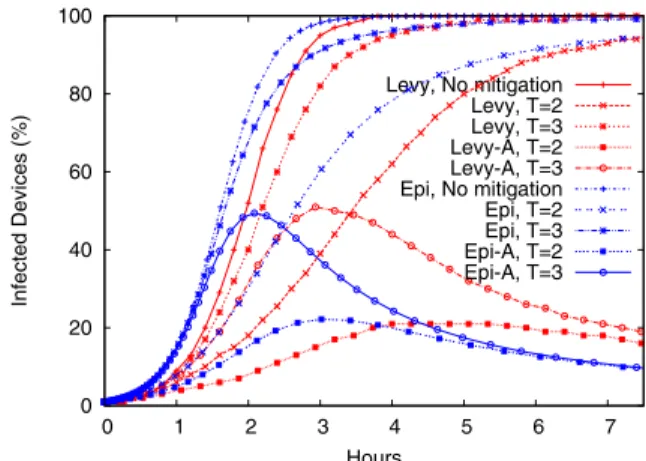
Local detection removes infected devices from the popu-lation by disabling them, but otherwise does not actively try to prevent malware propagation. Figure 5 shows that local detection does little to prevent proximity malware propagation. For a variety of experiments, the graph shows the percentage of devices that are infected over time. We assume that all of the devices are susceptible; Section V-D relaxes this assumption. The “Levy” curves show results from simulations with the Levy walk model. The “No mitigation” curve shows the unre-strained propagation of malware. Malware propagation infects over 80% of devices in just over 2 hours. The “T=n” curves simulate local detection with a threshold ofncontacts (e.g., a device decides that it has been infected if it has been contacted bynother unique devices transferring the same file to it, and it sees itself also transmitting that file). An aggressive threshold of two delays propagation by another 3 hours. Increasing the threshold to three substantially reduces the effectiveness, only delaying propagation by about 30 minutes. Higher thresholds have little impact whatsoever. The curves for a threshold of four (not shown) nearly overlap the “No mitigation” curve; we simulated for higher threshold values with the same effect.
0 20 40 60 80 100 0 1 2 3 4 5 6 7 Infected Devices (%) Hours Levy, No mitigation Levy, T=2 Levy, T=3 Levy-A, T=2 Levy-A, T=3 Epi, No mitigation Epi, T=2 Epi, T=3 Epi-A, T=2 Epi-A, T=3
Fig. 5. Effects of local detection on malware propagation, evaluated both with Levy walk simulations and the epidemic model.
These results use the “NCSU” Levy walk parameterization. We also simulated the effects using the other parameteriza-tions. For this and other results below, the effects are similar to those shown in Figure 4: parameters corresponding to higher contact rates (“SF”) propagate malware more aggressively (shift the curves left), and those with lower rates (“KAIST”) do the opposite. Because the results do not fundamentally change with different Levy parameters, we continue to show results for the “NCSU” parameters.
As a point of comparison, we also present results using the analytic epidemic model (Section III-D). We extend it to model device local detection and shutdown as follows. Once a device disables itself it enters the removed stateR, and transitions to the removed state occur as the number of received infection messages reaches the contact threshold. Typically, we expect this transition to happen in an encounter between two already infected devices.
During experimentation with this model, however, we found an unexpected effect to be significant: depending on the behavior of the malware, it is possible that an infected device gets removed in the course of an encounter with an uninfected device. If the encounter lasts long enough, and the malware aggressively tries to propagate itself (with high frequency and without keeping track of which devices it has come from) the newly infected device may contact the already infected device. Thus, in a quick “reflected infection” exchange, the previously infected device receives an infection message. Thus, for a small threshold value like two, a single encounter with an uninfected device could lead to shut-off. We let p2
be the probability of an encounter between an infected and a susceptible device resulting in such a “reflected infection” exchange. Hence, for a threshold value of 2:
ds(t) dt = −βs(t)i(t) (3) di(t) dt = βi(t) [(1−p2)s(t)−i(t)] (4) dr(t) dt = βi(t) [p2s(t) +i(t)] (5) where r(t)is the number of removed devices at timet.
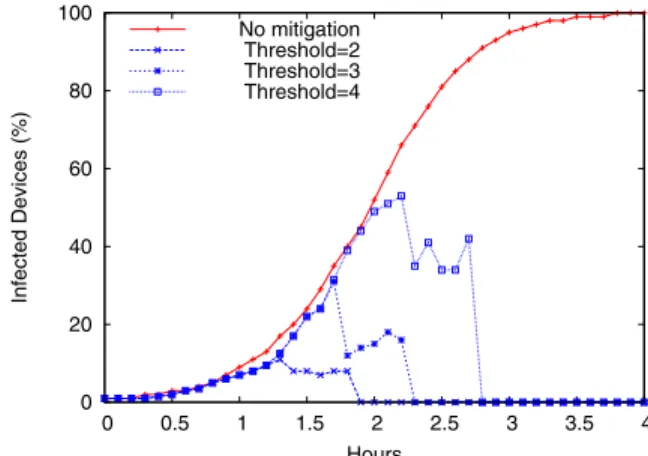
0 20 40 60 80 100 0 0.5 1 1.5 2 2.5 3 3.5 4 Infected Devices (%) Hours No mitigation Threshold=2 Threshold=3 Threshold=4
Fig. 6. Infection over time using proximity-based signature dissemination.
The model can also be extended to higher threshold values in a similar fashion. For a given infection latency, we determinep2
according to the fraction of encounters whose duration meets the infection latency threshold (Figure 1).
The “Epi” curves in Figure 5 show the results of the epidemic model when modeling local detection. As seen earlier (Section III-E2), the epidemic model tends to predict somewhat faster infection propagation than the results based on the Levy walk simulation, but are otherwise in agreement with those results. In particular, it is in agreement with the simulation in terms of the general trend: that some effect can be achieved using a threshold value of 2, but this diminishes quickly as the threshold is increased.
The curves denoted by “A” show the fraction of devices actively propagating the infection, i.e., infected and not dis-abled. Even though the dynamics of the two models differ somewhat, they predict approximately the same peak fraction of simultaneously active infected devices.
B. Proximity Signature Dissemination
With proximity signature dissemination, infected devices generate malware signatures and disseminate them via prox-imity contacts as well. Figure 6 shows the simulation results of this strategy for various thresholds using the Levy walk model to generate contacts. The results show that proximity signature dissemination does limit propagation: the strategy contains the infection to just a subset of the population. As expected, aggressive (lower) thresholds have a more significant impact than conservative (higher) thresholds.
An advantage of this strategy is that it is done entirely with the individual devices themselves; no anti-virus service for signature creation and dissemination takes place. Given that no infrastructure by the mobile provider is needed, we consider this mitigation strategy to be very effective. With relatively few Bluetooth flooding applications being used, for example, we argue that an aggressive threshold of two or three would be reasonable in the short term — in the current environment, being contacted to transfer the same file from multiple independent devices is suspicious. However, as Bluetooth applications evolve, the threshold question would likely have to be revisited.
0 20 40 60 80 100 0 0.5 1 1.5 2 2.5 3 3.5 4 Infected Devices (%) Hours No mitigation Threshold=2 Threshold=3 Threshold=4
Fig. 7. Infection over time using broadcast-based signature dissemination.
C. Broadcast Signature Dissemination
With broadcast signature dissemination, when devices de-cide that they have become infected they send the malware files to a central server, nominally controlled by the network provider. Once a sufficient number of devices m contact the server about the same malware instance, the server — either automatically or with manual help from experts — generates a patch that can disable the malware, and broadcasts it to devices. Figure 7 shows the simulation results of this strategy for various contact thresholds, again using the Levy walk model to generate contacts. We model a central server that triggers a broadcast after m = 20 devices contact it. Note that, since devices can be patched during the propagation, the percentage of infected devices can decrease over time.
The results show that, under these assumptions, broadcast dissemination is highly effective at not just limiting, but also removing malware from the network. While this strategy does require the mobile provider to invest resources and take action (e.g., maintenance of anti-virus server, possibly manual generation of recover-enabled signatures by anti-virus experts), an increase in malware incidents could motivate the cost. An alternative model is that providers could label it a premium service and charge customers, perhaps along similar business models as current anti-virus vendors.
D. Susceptibility
Our previous experiments have assumed that all devices in the population are susceptible. In our final experiment, we relax this assumption by varying the percentages of suscep-tible devices in the population. As discussed in Section III-A, parameterizing s can represent hardware, software, or user features that determine malware susceptibility. For instance, malware that exploits a vulnerability in Symbian, independent of device, would have a value of s corresponding to the prevalence of Symbian phones in a population. Alternately, for malware that requires user interaction to propagate (e.g., accept a file transfer),scan reflect the fraction of users willing to accept such transfers.
Figure 8 shows the effects of varying sbetween 20–100% of the population. Note that we calculate the percentage of
0 20 40 60 80 100 0 2 4 6 8 10 Infected Devices (%) Hours 20% susceptibility 40% susceptibility 60% susceptibility 80% susceptibility 100% susceptibility
Fig. 8. Malware propagation with varying degrees of susceptible populations. Percentage of infected devices is over the susceptible population.
infected devices relative to the susceptible population. The results show that malware still effectively infects the entire susceptible population, but that reducing sincreases the time it takes for complete propagation. The effects become more pronounced for smaller values ofs. At 40% and 20%, malware takes increasingly longer to propagate through the population as the density of susceptible devices decreases substantially.
VI. CONCLUSIONS
The challenging threat of proximity malware is that it can propagate among mobile devices without being observed by the provider network. This behavior makes the propagation of proximity malware difficult to detect and mitigate. In this paper we evaluated three strategies to address this problem. These strategies use multiple contacts with other infected devices as evidence to determine locally that malware is propagating. A baseline strategy that performs local detection and containment has only marginal impact on propagation. A more active strategy that combines local detection with proximity dissemination of signatures has a much more dra-matic effect, limiting malware propagation to only a fraction of the susceptible population. Finally, a global strategy relies upon the provider network to coordinate local observations and generate patches to not only contain the malware, but also to patch devices through broadcast communication.
A number of open problems remain. For example, more sophisticated malware could adapt to these strategies to bypass their detection mechanisms — thereby requiring further esca-lation and refinement in defense techniques, a process inherent to network security. We have also focused on proximity malware disseminating in a campus-sized geographic region. Investigating the spread of proximity malware in larger regions remains an open question. Of particular concern is proximity malware that also strategically uses the provider network to combine long-distance infections with local propagation. Rather than flooding the network with traffic, thereby raising alarms, such hybrid malware could use infrequent communi-cation to minimize chances of detection. We are continuing to pursue this topic in ongoing work.
ACKNOWLEDGMENTS
We would like to thank Jeffrey G. Cuenco for his valuable help in collecting the bluetooth scan data in the UCSD campus.
REFERENCES
[1] J. Leyden, “Mobile malware menace hits high – McAfee,” Feb. 2007, http://www.theregister.co.uk/2007/02/12/mobile malware/.
[2] C. Fleizach, M. Liljenstam, P. Johansson, G. M. Voelker, and A. Mehes, “Can you infect me now?: malware propagation in mobile phone networks,” inWORM ’07, 2007, pp. 61–68.
[3] F-Secure, “F-Secure Virus Information Pages: Cabir,” http://www. f-secure.com/v-descs/cabir.shtml.
[4] ——, “F-Secure Virus Information Pages: Commwarrior,” http://www. f-secure.com/v-descs/commwarrior.shtml.
[5] I. Rhee, M. Shin, S. Hong, K. Lee, and S. Chong, “On the levy-walk nature of human mobility,” inIEEE INFOCOM, Pheonix, AZ, 2008. [6] J. Su, K. K. W. Chan, A. G. Miklas, K. Po, A. Akhavan, S. Saroiu,
E. de Lara, and A. Goel, “A preliminary investigation of worm infections in a bluetooth environment,” inWORM’06, 2006, pp. 9–16.
[7] V. Kostakos, “Experiences with urban deployment of Bluetooth (given at UCSD),” Mar. 2007, http://www.cs.bath.ac.uk/∼vk/files/pres ucsd.pdf. [8] G. Yan and S. Eidenbenz, “Bluetooth worms: Models, dynamics, and
defense implications,” in Proceedings of the 22nd Annual Computer Security Applications Conference (ACSAC), 2006.
[9] ——, “Modeling propagation dynamics of bluetooth worms,” in Pro-ceedings of the 27th International Conference on Distributed Computing Systems (ICDCS’07), June 2007.
[10] G. Yan, H. D. Flores, L. Cuellar, N. Hengartner, S. Eidenbenz, and V. Vu, “Bluetooth worm propagation: mobility pattern matters!” inASIACCS ’07, 2007, pp. 32–44.
[11] A. Bose and K. G. Shin, “On mobile viruses exploiting messaging and bluetooth services,” inSecurecomm, Baltimore, MD, Aug. 2006. [12] ——, “Proactive Security for Mobile Messaging Networks,” in
Proceed-ings of the 5th ACM Workshop on Wireless Security, Sep. 2006. [13] E. V. Ruitenbeek, T. Courtney, W. H. Sanders, and F. Stevens,
“Quanti-fying the Effectiveness of Mobile Phone Virus Response Mechanisms,” inProceedings of the 37th Annual IEEE/IFIP International Conference on Dependable Systems and Networks, 2007, pp. 790–800.
[14] A. Bose, X. Hu, K. G. Shin, and T. Park, “Behavioral Detection of Malware on Mobile Handsets,” inProc. of MobiSys, Jun. 2008. [15] H. Kim, J. Smith, and K. G. Shin, “On Detecting Energy-Greedy
Anomalies,” inProc. of MobiSys, Jun. 2008.
[16] J. Mickens and B. Noble, “Modeling epidemic spreading in mobile environments (wise’05),” inProceedings of the 4th ACM workshop on Wireless security, Sept 2005.
[17] C. J. Rhodes and M. Nekovee, “The opportunistic transmission of wireless worms between mobile devices,” http://arxiv.org/abs/0802.2685, Last accessed 2008-04-09, 2008.
[18] H. Zheng, D. Li, and Z. Gao, “An epidemic model of mobile phone virus,” inProc. of SPCA’06, Jan. 2006.
[19] M. C. Gonz´alez, C. A. Hidalgo, and A.-L. Barab´asi, “Understanding individual human mobility patterns,” Nature, vol. 453, pp. 779–782, 2008.
[20] D. J. Daley and J. Gani,Epidemic Modelling: An Introduction. Cam-bridge University Press, Studies in Mathematical Biology, 1999. [21] N. Weaver and D. Ellis, “White worms don’t work,”;login:, Dec. 2006. [22] 3GPP, “Multimedia Broadcast Multicast Service,” http://www.3gpp.org/