Introduction
Clustering, which is an unsupervised learning technique, has been widely applied in diverse field of studies such as machine learning, data mining, pattern recognition, image analysis, and bioinformatics. However, Pirim et al.1 stated that no tering algorithm exists with the best performance for all clus-tering problems. This fact makes it necessary to intelli gently apply algorithms specialized for the task at hand. Our quest for useful information from noisy gene expression data to gain insight and create new hypothesis is not insignificant. The first step is creating clusters of gene expression data that are simi-lar in expression and are dissimisimi-lar to gene expression data in other clusters. Similarities in data are commonly measured with distance; two or more genes are objects of a particular cluster if they are closely related based on a given distance. Though several clustering approaches are available, difficulty still arises in finding a suitable clustering technique for given experimental datasets.
Clustering can be accomplished based on genes, samples, and/or time variable, depending on the type of dataset.2 The significance of clustering both genes and samples cannot be ignored in gene expression data; genes form a cluster that
displays related expression across conditions, while samples form a cluster that displays related expression across all genes. In gene-based clustering, the genes are regarded as the objects, while the samples are regarded as the features. In sample-based clustering, the samples can be segregated into identical groups where the genes are treated as features and the sam-ples as objects.3 The peculiarity of gene-based clustering and sample- based clustering is centered on different characteristics of clustering tasks for gene expression data.4
Clustering could be partial or complete; a partial clus-tering does not allocate every gene to a cluster while a com-plete clustering does. Partial clustering has a tendency to be more suitable for gene expressions due to the fact that the gene expression data often comprises some irrelevant genes or sam-ples. In gene expression, partial clustering allows some genes in the expression data not to belong to well-defined clusters because at most times genes in the expression data could repre sent noises that allows its impact to be correspondingly less on the outcome; in addition, by not allowing some genes in the expression data to belong to well-defined clusters, it aids in neglecting quite a number of irrelevant contributions. Partial clustering thus helps in avoiding situations where an
Expression Data
Jelili oyelade
1,2,*, itunuoluwa isewon
1,2,*, funke oladipupo
1, olufemi aromolaran
1,
Efosa Uwoghiren
1, faridah ameh
1, moses achas
3and Ezekiel adebiyi
1,21Department of Computer and Information Sciences, Covenant University, Ota, Ogun State, Nigeria. 2Covenant University Bioinformatics
Research (CUBRe), Covenant University, Ota, Ogun State, Nigeria. 3Department of Computer Science and Information Technology,
Bells University of Technology, Ota, Ogun State, Nigeria. *JO and II are joint first authors.
AbstrAct: Gene expression data hide vital information required to understand the biological process that takes place in a particular organism in relation to its environment. Deciphering the hidden patterns in gene expression data proffers a prodigious preference to strengthen the understanding of functional genomics. The complexity of biological networks and the volume of genes present increase the challenges of comprehending and interpretation of the resulting mass of data, which consists of millions of measurements; these data also inhibit vagueness, imprecision, and noise. Therefore, the use of clustering techniques is a first step toward addressing these challenges, which is essential in the data mining process to reveal natural structures and iden-tify interesting patterns in the underlying data. The clustering of gene expression data has been proven to be useful in making known the natural structure inherent in gene expression data, understanding gene functions, cellular processes, and subtypes of cells, mining useful information from noisy data, and understanding gene regulation. The other benefit of clustering gene expression data is the identification of homology, which is very important in vaccine design. This review examines the various clustering algorithms applicable to the gene expression data in order to discover and provide useful knowledge of the appropriate clustering technique that will guarantee stability and high degree of accuracy in its analysis procedure.
Keywords: clustering algorithm, homology, biological process, gene expression data, bioinformatics CiTATion: oyelade et al. clustering algorithms: their application to gene Expression
data. Bioinformatics and Biology Insights 2016:10 237–253 doi: 10.4137/BBi.s38316.
TYPE: review
RECEivED: may 18, 2016. RESubmiTTED: september 05, 2016. ACCEPTED foR PubliCATion: september 09, 2016.
ACADEmiC EDiToR: J. T. Efird, Associate Editor
PEER REviEw: seven peer reviewers contributed to the peer review report. reviewers’ reports totaled 1359 words, excluding any confidential comments to the academic editor.
funDinG: authors disclose no external funding sources.
ComPETinG inTERESTS: Authors disclose no potential conflicts of interest.
CoRRESPonDEnCE: [email protected]
CoPYRiGhT: © the authors, publisher and licensee libertas academica limited. this is an open-access article distributed under the terms of the creative commons cc-By-nc 3.0 license.
Paper subject to independent expert blind peer review. all editorial decisions made by independent academic editor. Upon submission manuscript was subject to anti-plagiarism scanning. Prior to publication all authors have given signed confirmation of agreement to article publication and compliance with all applicable ethical and legal requirements, including the accuracy of author and contributor information, disclosure of competing interests and funding sources, compliance with ethical requirements relating to human and animal study participants, and compliance with any copyright requirements of third parties. this journal is a member of the committee on Publication Ethics (coPE). Provenance: the authors were invited to submit this paper.
interesting subgroup in a cluster is preserved by not forcing membership of unrelated genes.5 Clustering can be catego-rized as hard or overlapping.5 Hard clustering assigns each gene to a single cluster during its operation and its output, while overlapping clusters assign degrees of membership in several clusters to each input gene. An overlapping clustering can be transformed to a hard clustering by assigning each gene to the cluster with the dominant degree of membership. This review aims to examine various clustering algorithms and elu-cidate the appropriate ones for gene expression data.
The paper is structured as follows. In the next section, we describe traditional clustering techniques. We discuss the recent clustering techniques in “Recent clustering techniques” section. “Multiclustering techniques” section discusses the multiclustering algorithms, and in “Challenges and issues of algorithms used for clustering gene expression data” section, we describe the various challenges of different clustering algorithms. “What is the quality of my clustering?” section discusses the different cluster validity metrics; the application of these clustering algorithms is discussed in “Applications of clustering to analysis of gene expression data” section, and we conclude the paper in “Conclusion” section.
traditional clustering techniques
Hierarchical methods. Agglomerative nesting (AGNES)6
uses hierarchical agglomerative approach, which accepts dataset as input, and through a series of successive fusions of the individual objects contained in the dataset, it outputs a clustered expression of the dataset. Dissimilarity coefficients between objects are obtained by the computation of dis-tances, such as the Euclidean distance and the Manhattan distance, which forms the dissimilarity matrix on subsequent fusion; a new dissimilarity matrix is obtained by applying the Unweighted Pair Group Method with Arithmetic Mean (UPGMA)7 to the newly formed clusters, leading to a new matrix. At the initial stage, each object is presumed to form a small cluster by itself. At the first iteration, the two closest or
most similar objects are joined to form a cluster of two objects, while all other objects remain apart. Once AGNES joins two objects, they cannot be separated any more. The rigid-ity of AGNES is vital to its success (because it leads to small computation times). Vis-à-vis gene expression data, AGNES handles inherent missing data by calculating the average and mean absolute deviation using only the values present. How-ever, it suffers from the defect that it can never repair what was done in previous steps (ie, the inability to correct erroneous decisions), and use of different distance metrics for measur-ing distances between clusters may generate different results that makes it impossible to support the veracity of the original results. Divisive Analysis (DIANA)6 uses hierarchical divisive approach that starts with whole population and consequently splits the data into two parts and then goes further to divide them into smaller groups until at step n− 1 when all objects are apart (forming n clusters, each with a single object). Once
DIANA splits up a cluster, they cannot be joined together any more. The rigidity of DIANA is vital to its success (because it leads to small computation times). DIANA handles missing data in the same way as AGNES does. However, it suffers from the defect that it can never repair what was done in previous steps (ie, the inability to reunite whatever it already divided). The splitting of a cluster requires computing the diameter of the cluster, which makes DIANA not appropriate for gene expres-sion data with special characteristics of individual clusters that does not follow the assumed model of the algorithm.6 Clus-tering Using Representatives (CURE)8 adopts a compromise between centroid-based and all-point extreme approaches. CURE initializes with a constant number of scatter points, which captures the extent and shape of the cluster; the cho-sen scatter points shrink toward the centroid, which conse-quently becomes the representatives of the cluster. CURE’s scattered point approach enables it to overcome the drawbacks of all-point and centroid-based methods, thereby enabling identification of correct clusters and discovering nonspherical clusters. CURE is less sensitive to outliers since shrinking the scattered points toward the mean dampens the adverse effect of outliers; it employs random sampling and partitioning to handle large datasets efficiently. CURE clustering algorithm was applied to gene expression by Guha et al.8 Application of CURE to four datasets confirms the above-stated attributes. CHAMELEON9 is a hierarchical clustering (HC) algo-rithm that uses a dynamic modeling technique to overcome the drawbacks of other agglomerative techniques (ROCK (A robust clustering algorithm for categorical attributes)10, AGNES, DIANA, etc.) that causes them to make incorrect merging decisions when the underlying data do not follow the assumed model, or when noise is present. CHAMELEON finds the clusters in the dataset by using a two-phase algo-rithm. During the first phase, CHAMELEON uses a graph partitioning algorithm to cluster the data items into a large number of relatively small subclusters. This ensures that links within clusters will be stronger and more than links across clusters. Also, the natural separation boundaries of clusters are effectively determined. Hence, the data in each partition are highly related to other data items in the same partition and consequently less sensitive to noise. During the second phase, it uses an agglomerative HC algorithm to find the genuine clusters by repeatedly combining together these subclusters. The algorithm takes into consideration both the relative inter-connectivity and the relative closeness, thereby enabling it to select the most similar pairs of clusters and overcome the drawback of incorrect merging decisions due to unfathomed data model. Evaluation result shows CHAMELEON to out-perform algorithms such as CURE, ROCK, DBSCAN11, Clustering Large Applications based upon RANdomized Search (CLARANS)12, Partitioning Around Medoids (PAM)6 and K-Means13 due to its dynamic modeling of clus-ter approach. Balanced Iclus-terative Reducing and Clusclus-tering using Hierarchies (BIRCH)14 uses the concept of clustering
feature (CF, a triple summarizing the information maintained about a cluster) and CF tree (an in-memory tree-like repre-sentation of all objects in a dataset). BIRCH has four phases; however, phases two and four are optional because they only refine the output of their preceding phase. Phase one scans the entire dataset item and constructs a CF tree. The CF tree tries to reflect the clustering information of the dataset as fine as possible under the memory limit with crowded data points grouped as fine subclusters. Outliers are eliminated as the algo-rithm removes sparse data points. Subsequent computations in later phases are fast because no Input-Output (I/O) operations are needed and the problem of clustering the original data is reduced to a smaller problem of clustering the subclusters in the leaf entries, which is achieved through the incremental updating of the CF; this enables BIRCH to handle large data-sets. Clustering output is not altered by order of input data because the leaf entry of the initial tree form an input order containing better data locality compared with the arbitrary original data input order. BIRCH’s ability to handle outliers, large datasets, and output not being affected by the order of input data makes it a good technique for gene expression data clustering. However, the efficiency of the result is largely dependent on proper parameter settings, and it exhibits bias-ness toward nonspherical clusters because it uses the concept of radius or diameter to control the boundary of the clusters. Synthetic and real datasets (image data) were used to evaluate BIRCH algorithm with results better in terms of time com-plexity, quality of clusters, and robustness of the approach.
Partitioning methods. Hybridized K-means. K-Means
algorithm hybridized with Cluster Centre Initialization Algo-rithm (CCIA)3,15 is an extension of K-means that is developed to overcome the issue of bad clustering output as a result of arbitrary choice of cluster centroid. CCIA specifies the appro-priate centroid of the K clusters by identifying the closest pair of data points from the data population D, forms a data point set A, which contains these two data points. It then deletes these two data points from D and recursively finds the data points in D that is closest to A until the number of data points in A reaches a defined constraint within the algorithm. This procedure is repeated until the number of A equals to K and the initial centroids for K clusters will be the arithmetic mean of the vectors of data points in each A. K-means with CCIA’s speed and the ability to automatically determine the number of clusters notwithstanding does not make it a good candidate for gene expression data because of its biasedness to spherically shaped clusters and inability to handle both high-dimensional dataset and highly connected clusters. Serum, yeast, and leu-kemia datasets were used to evaluate the performance of the hybridized K-means algorithm, and their results showed supe-rior performance compared with the traditional K-means algo-rithm. Intelligent Kernel K-means (IKKM)16 is an extension of K-means clustering algorithm that incorporates the benefit of intelligent K-means17 and kernel K-means18 to overcome the drawbacks of traditional K-means algorithm. It is a fully
unsupervised clustering technique. Since most of the human gene expression data are nonlinearly separable, linear kernel function is used to generate kernel matrix (a representation of the gene expression data), which is fed into IKKM. IKKM approach does not require to know the number of clusters in advance as it is implicitly determined by computing the center of mass of the dataset and then locates object C1 having the farthest distance from the center of mass and object C2 having the farthest distance from C1 and then the distance of other objects around centroid C1 and C2; thereafter, objects closest to C1 are labeled as cluster S1 while others at the closest distance to C2 are labeled as cluster S2. This procedure is repeated until there is no object that changes cluster and it ensures that the correct number of clusters is formed, which leads to a better and compact clustering result. IKKM is a good candidate for gene expression clustering; as illustrated above, it overcomes most of the challenges in gene expression data, except the issue of high dimensionality. IKKM was evaluated using real-life datasets such as tumor data, lymph node metastasis data, and other datasets. The result shows better performance compared to intelligent K-means. PAM is a partitional clustering algo-rithm that clusters objects that are measured on p scaled variables, and it can also be applied when the input data are a dissimilarity matrix.6 PAM is not suited for drawn-out clusters due to the first phase of the algorithm (referred to as BUILD), which identifies the centrally located object (the object with the least sum of dissimilarities to all other objects) and constructs the initial clustering around it. PAM is more robust compared to K-means because it minimizes a sum of dissimilarities instead of a sum of squared Euclidean dis-tances. PAM provides a novel graphical display based on the silhouette plot, which allows selection of the number of clus-ters. However, the second phase referred to as Swap attempts to improve the clustering through the improvement of the representative objects (referred to as medoids). This is achieved by considering all pairs of objects (a, b), where object a has been selected and object b has not and consequently determine the effect obtained on the value of the clustering when a swap is carried out. PAM is susceptible to the issue of initial input, and its inability to handle large datasets, high-dimensional datasets, and highly connected clusters makes it less desirable for clustering gene expression data. Clustering Large Applica-tions (CLARA)6 offers improvement over PAM with regard to the ability to cluster large datasets. The storage requirement is not large, and it can cluster large datasets compared to PAM because CLARA does not store similarities but only the actual measurements and it implements PAM technique on a selected sample of objects drawn from the data compared to the entire objects of the dataset and clustered into k subsets using the k-medoid method, which also gives k representative objects. Then, each object of the entire dataset is assigned to the near-est medoid of the sample. This whole procedure is repeated several times and the solution with the best overall objective function is retained.6 In this way, the computation time also
remains feasible. CLARA is susceptible to the issue of initial input, and its inability to handle both high-dimensional data-sets and highly connected clusters makes it less desirable for clustering gene expression data. CLARA shares the robust-ness of PAM, and it is also intended for spherical clusters.
Model-based methods. Self-organizing maps (SOMs)19,
which are developed based on neural network methods, are another model-based clustering approach widely used in gene clustering. Gene expression data are typically highly con-nected; there may be instances in which a single gene has a high correlation with two different clusters. Thus, the proba-bilistic feature of model-based clustering is particularly suit-able for gene expression data. SOMs have some attributes that make them better adapted to clustering, and analysis of gene expression patterns include the following. (i) Suitability for data analysis because SOM is based on a single-layered neural network, which generates an intuitively appealing map of a high-dimensional dataset in two-dimensional (2D) or three-dimensional (3D) space and places similar clusters near each other. (ii) Enhancement of easy visualization and interpretation is achieved by associating each neuron of the neural network with a reference vector, and each data point is mapped to the neuron with the closest reference vector that is useful for draw-ing conclusions. (iii) Applicable to large datasets. The algorithm has been applied to various datasets, for example, the yeast cell cycle, and the result shows that it performs comparably with other methods (Bayesian clustering, HC, K-means cluster-ing)20. Chinese restaurant clustering (CRC)21 is an improved model-based Bayesian clustering approach with a major attrac-tion of its ability to identify and group genes with strong but complicated correlation (such as time shifted and/or inverted) together because most algorithms focus on identification of genes that show similar expression pattern. This is achieved by calculating the probability of each gene joining each of the existing clusters as well as being alone in its own cluster while observing the partial expression profile of both gene and exist-ing clusters in the event of incomplete information about the gene. CRC adopts the Chinese restaurant process (CRP) that was complemented by Gibbs Sampler procedure22. Predic-tive updating technique was used to neutralize the presence of nuisance, which enhanced Gibbs sampler procedure. CRC eliminates the effect of missing data by using the observed partial expression profile of that gene and likewise only uses the corresponding partial expression profile of each cluster to calculate the likelihood and Bayes ratio for this gene joining all clusters. CRC’s performance was tested on both synthetic and real microarray datasets (Bacillus anthracis sporulation dataset) with computing complexity of O(n log n).
soft clustering. Fuzzy Analysis (FANNY)6 utilizes the
fuzziness principle to group population elements. This means FANNY does not use hard decisions to determine clustering of objects by assigning degree of membership to all elements. For example, “80% of object x belongs to cluster 1, 10% of object x belongs to cluster 2, and 10% of object x belongs to
cluster 3,” meaning that x is probably to be assigned to cluster 1 but that there is still a glimpse of doubt in favor of clusters 2 and 3. The algorithm does not involve any representative objects. Considering gene expression data where clusters may be highly intersected with each other or even embedded in one another, FANNY has the advantage that it does not force every object into a specific cluster where each object is
spread over various clusters and the degree of belonging of an object to different clusters is quantified by means of member-ship coefficients, which range from 0 to 1. This approach has several disadvantages including complex computations. In the end, one often resorts to the corresponding hard clustering, obtained by assigning each object to the cluster in which it has the largest membership coefficient. For this hard parti-tion, FANNY yields the same kind of graphical display as does PAM, so it is possible to compare both outputs. Fuzzy C-Means (FCM) Clustering Algorithm23 is one of the most widely used fuzzy clustering methods for microarrays. It is a soft clustering approach where each sample point in the cluster is characterized by its membership function. FCM maintains a membership matrix of the input dataset, which is updated on each iteration, evaluating the associated weight of each sample point to determine its degree of membership. The sum of each sample point across all clusters is unity. The major advantages of this approach are its ability to cluster overlap-ping sample points and that it always converges. However, it also has the cluster validity issue due to the a priori require-ment of c value needed for quality clustering results and outli-ers can be assigned similar memboutli-ership in each cluster, which makes it less desirable for gene expression data. Fuzzy clus-tering by Local Approximation of MEmbership (FLAME)24 is a soft clustering approach that has the ability to capture nonlinear relationships and nonglobular clusters, automate definition of the number of clusters, and identify cluster outli-ers, ie, genes that are not assigned to any cluster. FLAME clustering procedure involves three main steps. The first is the extraction of local structure information and identifica-tion of cluster supporting objects by computing the distance/ proximity between each object and its k-nearest neighbors to derive the object density. This enables it to handle nonglobular clusters. The drawback of initial value input is overcome as the cluster supporting objects are automatically identified as the representative objects of the dataset. Outliers are also identi-fied in this step as objects with very low density. The second step is the assignment of fuzzy membership by local approxi-mation until convergence. The last step is the construction of clusters from the fuzzy memberships. FLAME displays the best overall performance (compared to K-means, hierarchical, fuzzy C-means, and fuzzy SOMs) after it was evaluated using biological dataset (peripheral blood monocytes, yeast cell cycle data, hypoxia response dataset, and mouse tissue data).24 Fuzzy K-means using Expectation Maximization (FKEM) algorithm25 is a modified fuzzy K-means (FKM)26 approach that enhances the traditional K-Means technique to overcome
its drawbacks. FKEM uses weighted fuzzy averages to obtain the initial clusters; these give us centers that are widely spread within the data. Expectation Maximization (EM) takes these centers as its initial variables and iterates to find the local max-ima. Hence, we obtain clusters that are distributed well using K-means and clusters that are compact using EM. The com-bination of the above techniques overcomes the initial input drawback of K-means to output quality clusters.27 FKEM overcomes the missing or incomplete data attribute inherent in gene expression data by starting with an initial estimate for the missing variables and iterates to find the maximum likelihood (ML) for these variables. This method was evalu-ated with IRIS data, and the result shows better performance compared to FKM. However, the issue of outliers, the high dimensionality peculiar to gene expression data, was not focused by FKEM and therefore might not be appropriate for such dataset.
Grid-based methods. Statistical information grid-based
(STING) algorithm28 makes use of statistical information to approximate the expected results of query. It classifies clus-ter areas by comparing them to the prior density value sup-plied by the user and designates less density cluster areas as not relevant, thereby minimizing the effect of noise. The strength of STING lies in the less computation resources required to cluster large spatial datasets because the I/O cost is low since the data structure of STING can be kept in the memory. STING is also efficient for large datasets because it only identifies regions that satisfy the query string provided as input. These regions are derived by calculating the likelihood that the cell is relevant to the query at some confidence level using the parameters of this cell. The hierarchical structure of grid cells and the statistical information associated with them provide graphical representation of the cluster structure from which conclusion can be drawn. The quality of clustering is high, provided that the density parameter provided by the user is accurate, and this is a major drawback to STING because of its complete reliance on prior user input, which is fallible to pro-duce accurate results. Several tests were conducted with house price dataset to validate the claim. OptiGrid is a grid-based clustering approach that uses contracting projections of the data to determine the optimal cutting (hyper-) planes for par-titioning the data. The optimal grid parpar-titioning is determined by ensuring that cutting planes partition the dataset in a region of low density (the density should be at least low relative to the surrounding region) and that the cutting plane should discriminate clusters as much as possible. OptiGrid29 handles the curse of dimensionality by ensuring that the data points of the cluster are spread over many grid cells. The grid cell approach ensures unbiasness for size and shape of cluster. The efficiency and effectiveness claims were evaluated using vari-ous experiments based on synthetic and real datasets used to evaluate the BIRCH algorithm with results better in terms of time complexity, quality of clusters, shape and size of clusters, and robustness of the approach. CLIQUE30 (for CLustering
In QUEst) automatically finds subspaces of the highest dimensionality in a data space such that high-density clusters exist in those subspaces. This technique also displays consis-tent results irrespective of the order in which input records are presented. The CLIQUE clustering technique includes four phases: (1) determination of dense units in all subspaces of interest; (2) determination of connected dense units in all sub-spaces of interest; (3) determination of maximal regions cover-ing each cluster of connected dense units; and (4) determination of a minimal cover for each cluster of connected dense units. Greedy growth and the sequential scan approaches were used to reduce the impact of noise data. CLIQUE applies princi-pal component analysis, a dimensionality reduction method, to the dataset to optimally transform the original data space into a lower dimensional space by forming dimensions that are linear combinations of given attributes. Minimal descrip-tion length principle used is to decide which subspaces (and the corresponding dense units) are interesting by encrypting the input data under a given model and selecting the encod-ing that minimizes the code length that enhances the output cluster quality. The pruning of dense units in the subspaces with low coverage makes CLIQUE faster; however, there is a trade-off because some clusters might be omitted.
density-based methods. DENsity-based CLUstEring
(DENCLUE)31 approach discovers natural clusters in a very large multidimensional dataset through a two-phase process. In the first phase, a map of the relevant portion of the data space is constructed. The map is used to speed up the calcula-tion of the density funccalcula-tion, which is required for efficient access of neighboring portions within the data space. Outli-ers are identified as cubes with low cardinality and are not included in the second step of the algorithm. Only the relevant cubes of the map are clustered, thereby making DENCLUE computationally efficient and capable of handling large data-sets. The second step is the actual clustering step, in which the algorithm identifies the density attractors and the corre-sponding density attracted points and introduces a local density function that can be efficiently determined using a map-ori-ented representation of the data. The grid approach enhances the compactness of the clusters, which is insensitive to cluster shape. The local density function enhances the connectedness of the data points. Based on the stated characteristics, DEN-CLUE is a good technique that can be used to cluster gene expression data. The method was evaluated with data from a complex simulation of a very small but flexible peptide and consequently shows a superior performance when compared to DBSCAN. Prototype-Based Modified DBSCAN (MDB-SCAN)32 an extension of the traditional DBSCAN. The MDBSCAN first applies any squared error clustering method such as K-means on the input dataset to generate k number of subclusters. The corresponding centroids of the subclus-ters are chosen as the prototypes, and then, DBSCAN algo-rithm is subsequently applied to the prototypes. This approach eliminates the unnecessary distance computations with the
help of prototypes produced by squared error clustering. MDBSCAN handles noise in the dataset by ignoring data points that are below density threshold. Both artificial and biological datasets (such as iris, wine, breast tissue, blood transfusion, and yeast datasets) were used to evaluate the performance of MDBSCAN. The result shows that MDB-SCAN is insensitive to the selection of initial prototypes, and it is able to produce the clusters of arbitrary shapes. Its performance is affected if the number of clusters is large.
Multiobjective optimization methods.
Multiobjec-tive clustering (MOCK)33 is a multiobjective clustering algorithm that aims to minimize the overall deviation and evaluates the connectedness of the population item in order to produce quality clusters of a large dataset, utilizing mini-mal computational resources. MOCK consists of two phases, where the first phase is called the initial clustering phase; the connectivity measure captures local densities and therefore detects arbitrarily shaped clusters, but is not robust toward overlapping clusters. The initial cluster is generated by mini-mum spanning tree (MST) using Prim’s algorithm. Outliers are handled by identifying uninteresting links whose removal leads to the separation of outliers, and interesting links whose removal leads to the discovery of real cluster structures. The second phase is called the model selection phase. The chal-lenge of input parameters is overcome by Tibshirani et al’s gap statistics34, which is used to find the most suitable num-ber of clusters in the second phase by computing the attain-ment score that is the Euclidean distance between solution point p and the closest point on the reference attainment sur face of the pareto front. The algorithm was applied to some synthetic data. With regard to gene expression dataset, the growing curve of the execution time of MOCK is not acute, so that the size of the clustering problem would not affect the performance of the clustering results of MOCK. GenClust-MOO35 produces a good initial spread of solu-tions, which is obtained by the initialization procedure that is partly random and partly based on two different single-objec-tive algorithms. One-third of the solutions in the archive is initialized after running single-linkage clustering algorithm for different values of K. A state of AMOSA (a simulated annealing based multiobjective optimization method) com-prises a set of real numbers, which represents the coordinates of the centers of the clusters. The following objective func-tions optimized by GenClustMOO make it suitable for gene expression data: (i) compactness of the partition based on Euclidean distance makes it appropriate for handling datasets with different cluster shape and size; (ii) total symmetry pres-ent in a parti cular partitioning; and (iii) degree of cluster con-nectedness makes it capable of extracting the true number of clusters in the presence of noise. Nineteen artificial and seven real-life datasets including LungCancer dataset, Newthy-roid dataset, LiverDisorder dataset were used to evaluate the performance of GenClustMOO algorithm; the results show the improved computational performance. Mofuzzy36
is a fuzzy multiobjective (MO) clustering technique that can automatically partition the different kinds of datasets hav-ing clusters of different shapes, size, and convexity into an appropriate number of clusters as long as the clusters possess the point symmetry property since cluster centers represented in a string are some randomly selected distinct points from the dataset and not the nearest distance, farthest distance, or unweighed mean procedure. AMOSA stores the nondomi-nated solutions found so far during the annealing process out of which one is selected as the current-pt, and mutated to obtain a new solution named new-pt, and the domination status of the solutions is calculated along with all solutions in the archive. The solution with the best domination status is chosen as the appropriate clustering solution. Outliers are identified as points that are not symmetrical to any cluster center and subsequently ignored.
In relation to gene expression data, the aim is to obtain the clusters that are biologically relevant. In order to obtain biologically relevant clusters, genes, which are having similar gene expression profiles (similar types of gene expression val-ues over different time points), are placed in a single cluster. FSym-index37 and Xie-Beni-index38 are applied to minimize compactness and maximize cluster separation, respectively. Thus, optimum values of these indices will correspond to those solutions where genes having similar gene expression patterns will be in the same cluster.
The algorithm was used to analyze the following data-sets: yeast sporulation, yeast cell cycle, Arabidopsis thaliana, human fibroblasts serum, and rat CNS data.
recent clustering techniques
Binary matrix factorization (BMF)39 is an extension of nonnega tive matrix factorization method to clustering, which is different from greedy strategy based. The core strength of BMF is its ability to produce sparse results and identify the local struc-tures. Moreover, it has been shown in molecular biology that only a small number of genes are involved in a pathway or bio-logical process on most cases, so generating sparse biclustering structures (ie, the number of genes in each biclustering structure is small) is of great interest. The data obtained from microarray experiments can be represented as a matrix X of n × m, the
ith row of which represents the ith gene’s expression level across the m different samples. The discretization of the input matrix to a binary matrix helps to understand the essential property of the data. The discretization method can effectively reduce the effect of noise. The discretization can guarantee the sparseness of the results of BMF. Mining localized part-based representation can help to reveal low-dimensional and more intuitive structures of observations. BMF’s character-istics highlighted above makes it a good choice for clustering gene expression data. Evaluation test was carried out using BMF on both synthetic and life data. Some of the real-life data used includes Acute Myeloid Leukemia (AML)/ Acute Lymphoblastic Leukenia (ALL) data,40 lung cancer
data,41 and central nervous system tumor data.40 Ensemble Clustering42 is a two-phase clustering combination approach. At the first step, various clustering techniques are run against the same datasets to generate clustering results. These elimi-nate the inconsistency of the results of different clus tering algorithms. Cluster validation indices are used to select the optimal number of clusters for each dataset, which overcomes the drawback on initial input inaccuracy. At the second step, distance matrix is constructed for each clustering result and combined to form a master distance matrix out of which a weighted graph is constructed and a graph-based partitioning algorithm is finally applied to obtain the final clustering result that reveals local structure or inherent visual characteristic in the dataset. Clustering divides the graph into connected com-ponents by identifying and deleting inconsistent edges (noise). Cluster ensemble approach was evaluated using UCI machine learning data and gene expression data, which shows that clus-ter ensemble method can produce robust and betclus-ter quality clusters compared with single best clustering. MST clustering technique43 simply represents a set of gene expression data as a MST where each cluster of expression data equates to a sub-tree of the MST. The core benefits of this approach include the following. (1) MST enables efficient implementations of rigorous clustering algorithms by using the representative-based objective function that facilitates an efficient global optimization algorithm and consequently quality cluster out-put. (2) MST does not rely on detailed geometrical shape of a cluster. The MST representation of gene expression data eliminates the effect of shape complexity. MST automati-cally determines the optimal number of clusters by optimiz-ing the connectedness of the data points until improvement in the clustering space levels off. The method has three objective functions in its implementation; first, k subtrees are derived from the partition of MST so that the total edge distance of all the K subtrees is minimized; this ensures compactness of clusters. Second, the clusters are optimized to discover best
rep resentatives that minimize the intracluster dissimi-larity. Third, the algorithm finds the globally optimal solution for the MST problem that produces a quality clustering of the dataset. The algorithm was applied to some real-life datasets including yeast data and Arabidop-sis data. Dual-rooted MST44 is an enhancement of MST approach to clustering where two trees are used to cluster the whole sample space compared to the traditional MST that uses only one tree for the whole sample space. Dual-rooted MST is used in conjunction with spectral clustering to obtain a power-ful clustering algorithm that is able to separate neighboring nonconvex-shaped clusters and account for local and global geometric features of the dataset after which consensus clustering is then applied to a small ensemble of dual-rooted MSTs to minimize the computational complexity and also to enhance the clustering performance. Sensitivity to outli-ers as well as the computational burden is effectively reduced by constructing a distance matrix of the dual-rooted MST. It
does not require prior specification of the number of clusters, as it is estimated by thresholding the Prim’s trajectory of the full MST. Based on the above characteristics, dual-rooted MST has good clustering performance on gene expression data. Dual-rooted MST was evaluated with both real-life data and synthetic datasets, and the result shows three MST classes (two rooted MSTs and one rejection/unclassified). M-CLUBS (Microarray data CLustering Using Binary Splitting)45 clus-tering algorithm45 provides the two essential goals of a clustering process, which no single algorithm possesses. The goals are efficiency and accuracy of the clustering algorithm. These goals are achieved by exploiting the efficiency attribute of divisive technique (eg, DIANA) and the accuracy attribute of agglomerative technique (eg, BIRCH). The agglomerative step is only used on miniclusters generated by a first divisive pro-cess in order to overcome the limitation of high computational cost. M-CLUBS is able to overcome the shortcoming of most clustering algorithms such as the effect of size and shape of clusters, number of clusters, and noise. Due to its grid-based divisive agglomerative approach, M-CLUBS produces clus-ter results of superior quality. The algorithm consists of a divisive phase and an agglomerative phase; during these two phases, the samples are repartitioned using a least quadratic distance criterion possessing unique analytical properties that we exploit to achieve a very fast computation. M-CLUBS is suitable for analyzing microarray data since it is designed to perform well for Euclidean distances. Efficient agglomera-tive hierarchical clustering (KnA) combines the strength of both hierarchical and partitional approaches where hierarchi-cal approach is more suitable for handling real-world data but requires higher computational cost while partitional approach has lower computational cost but requires predefined para-meters. There are two phases involved in the clustering process. In phase one, K-means is applied to the individual data objects to generate K clusters. In phase two, agglomerative clustering approach is applied on the centroids, which is the representa-tive of the clusters obtained from phase one to obtain the final clustering hierarchy. KnA was evaluated with synthetic data with controllable distribution. The experimental results indi-cate that performance of this approach is relatively consistent, regardless the variation of the settings, ie, clustering methods, data distributions, and distance measures.
Chaotic ant swarm clustering (CAS-C)46 is an optimiza-tion clustering approach that aims to obtain optimal assignment by minimizing objective function. The strengths of CAS-C include the following. (i) It has the ability to find a global opti-mum clustering result by using cumulative probability. (ii) It has a good algorithm performance for high-dimensional data. It achieves self-organization from chaotic state by the suc-cessive decrement of organization variable yi introduced into CAS. (iii) It is not sensitive to clusters with different size and density. Initial step requires the selection of several data in the sample set. After several iterations, the data converged to some points that are considered as center of each cluster in the
data space. CAS-C was evaluated with both real-world and synthetic data and the result shows that it is more suitable to group data with high dimension and multiple cluster densities, it can reach the global optimal solutions, forms more com-pact clusters with a good algorithm performance. Hierarchical Dirichlet process (HDP)47 algorithm is a model-based clus-tering algorithm that integrated the merits of HC and infinite mixture model. HC provides the ability to group clusters with similar attributes, while the infinite mixture ensures that the algorithm is robust to the problem of different choices of the number of clusters.48,49 The prior input of the infinite mixture model is provided by Dirichlet process, thereby overcoming the drawback of initial parameter problem. HDP’s strength lies in its ability to cluster based on multiple features at differ-ent levels; this means that it prevdiffer-ents fragmdiffer-ents of clusters in the final clustering result. The hierarchical model helps to cap-ture the hierarchical struccap-ture feacap-ture of the gene expressions, which reveals more details about the unknown functionalities of certain genes as the clusters sharing multiple features. The clustering process is similar to the CRP. Real-life data such as yeast cell cycle data were used to evaluate the HDP algorithm, and the result reveals more structural information of the data. Significant multiclass membership two-stage (SiMM-TS) algorithm50 emerged to overcome the drawback of degrada-tion in clustering algorithm performance due to multiple over-laps among clusters. SiMM-TS algorithm involves two stages. First, variable string length genetic algorithm-based method51 is applied to obtain the number of clusters as well as the par-titioning. This effectively overcomes the problem of initial parameters uncertainty. The partitioning output from variable string length genetic algorithm process is used to construct a fuzzy partition matrix, which is used to obtain the SiMM points required for the second stage. In the second stage, the dataset is reclustered after separating the SiMM points using a multi-objective genetic clustering.52 The compactness of the clusters and the separation of the clusters are simultane-ously optimized by multiobjective genetic algorithm, which enhances quality clustering output. Real-life gene expression datasets such as yeast sporulation datasets were used to evalu-ate the performance of SiMM-TS algorithm, and the result shows good performance.
Multiclustering techniques
biclustering. Coupled two-way clustering. Coupled
two-way clustering (CTWC)53 is a biclustering technique that uses iterative row and column clustering combination approach. This approach uses superparamagnetic clustering algorithm54,55 to derive a quality clustering result. CTWC has a natural abil-ity to identify stable clusters without prior knowledge of the structure of the data. Superparamagnetic clustering algorithm also dampens the effects of the noise induced by other samples and genes that do not participate in the cellular process by focusing on small subsets of the dataset. Quality clustering is obtained by a tunable parameter T (temperature) that controls
the resolution of the performed clustering. The process starts at T = 0, with a single cluster that contains all the objects. As T increases, phase transitions take place, and this cluster breaks into several subclusters that reflect the structure of the data. Clusters keep breaking up as T is further increased; until each object forms its own cluster at high enough values of T. This process overcomes the drawback of the initial parameter values that affects clustering quality. Interrelated two-way clustering56 is an unsupervised approach that also uses similar approach to gene expression clustering. For more bicluster-ing algorithms, refer to Ref.57–64 For surveys and reviews on biclustering, refer to Ref.65–67
triclustering. Three-dimensional REV Iterative
Cluster-ing Algorithm. Three-dimensional REV Iterative Clustering Algorithm (TRI-Cluster)2 uses the available three dimension-ality of gene expression data genes (G), samples (S), and time (T) variables to cluster the microarray dataset. TRI-Cluster employs heuristic searching method with randomized initial tri-cluster and parameters. Due to the curse of dimensionality
that affects gene data clustering, TriCluster mines only the maximal triClusters that satisfy certain homogeneity crite-ria. Noise is eliminated by deleting or merging clusters based on certain overlapping criteria. TriCluster is a deterministic and complete algorithm that utilizes the inherent unbalanced property (number of genes being a lot more than the num-ber of samples or time slices) in microarray data, for efficient mining. The algorithm starts with randomly generated seeds. For each iteration, it exhaustively calculates the score of every possible 2D region in the whole subspace and stops at a local optimization if the maximal number of iterations is reached. TriCluster method was evaluated using synthetic dataset and yeast sporulation dataset, and the result shows that it performs comparably to other methods and even better in some sce-narios. However, the quality of prior information is critical to the prediction performance. General TRICLUSTER (gTRI-CLUSTER)68 is an enhanced version of TRICLUSTER algo-rithm. It introduces the Spearman rank correlation as the basic similarity metric to evaluate the local similarity of two expres-sion level profiles contrary to the symmetry property imposed on TRICLUSTER. This enables gTRICLUSTER to capture more cluster patterns that may be omitted by TRICLUSTER and be more robust to noise than TRICLUSTER. gTRI-CLUSTER algorithm process involves the following (i) iden-tify the maximal coherent samples subset for each gene, (ii) similarity matrix is constructed, (iii) possible maximal cliques are listed from the sample space using depth-first search, and (iv) biclusters are found in the sample × time matrices and merged to generate the maximal cliques by inverted list. gTRICLUSTER was evaluated using both synthetic and real-world micro array dataset such as yeast Saccharomyces cerevisiae
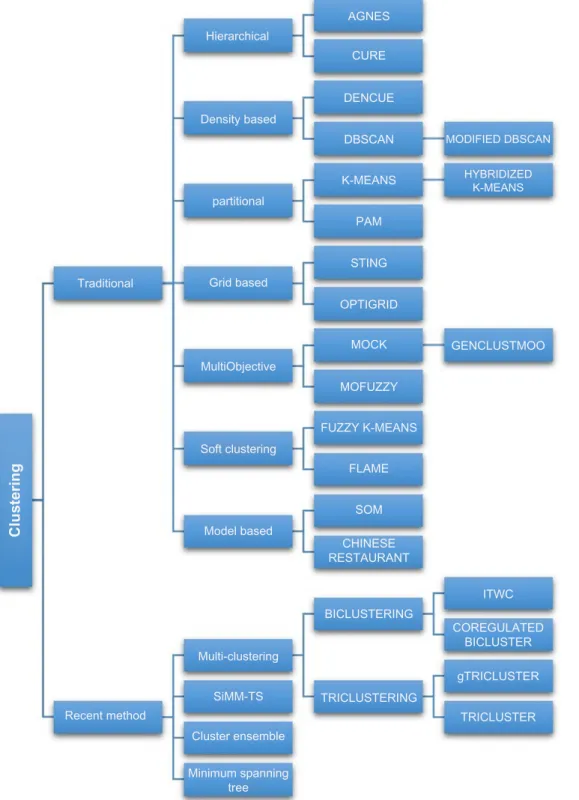
data, and the results show that it outperforms TRICLUSTER algorithm in terms of cluster quality and robustness to noise. The various classifications of clustering algorithms presented in this review are depicted in Figure 1.
challenges and Issues of Algorithms Used for clustering Gene expression data
Most of the clustering algorithms, employed today, are distance based.69 The most widely used clustering algorithms for gene expression data include HC,70 SOMs,19 and K-means cluster-ing.13 These algorithms are quite simple and visually appealing, but their performances could be sensitive to noise.1,4,21,71,72
Hierarchical clustering. HC algorithm is one of the
earliest clustering algorithms used in clustering genes. The per-formance of the algorithm is sensitive to noise. It is also not recep-tive to missing data, and it finds it difficult to provide information such as the number of clusters required and individual clusters’ confidence measures.21,73 Qin21 implemented a model-based clustering strategy based on CRP for clustering gene expres-sion data. This clustering algorithm has the ability to cluster genes and also assume the number of clusters simultaneously with high accuracy.
It has been reported that the HC has some trouble in clustering larger data.55 Statisticians have also taken this into consideration and stated that HC suffers from the deficiency of robustness and inversion problems that complicates interpre-tation of the hierarchy.4,20,75 The iterative mergences of HC are determined locally by the pairwise distances as an alterna-tive of a global criterion.75
Also, due to its deterministic attributes, HC can cause points to be clustered based on local decisions, with no chance to reexamine the clustering.20,76 The HC algorithm is highly vulnerable to the presence of scattered genes.77 Its divisive method suffers from the approach of how to split clusters at each step, and it has high computational complexity.4,78 According to Nagpal et al.70, a major limitation of HC is that as soon as the two points are interconnected, they do not go to other group in a hierarchy or tree.
The Hierarchical Agglomerative Clustering (HAC) algo-rithm has quite a number of limitations. First, “the structure of the patterns is fixed to a binary tree”.72 It also suffers from a lack of vigor when dealing with data containing noise72,80; a HC algorithm called self-organizing tree algorithm (SOTA)81 was proposed to realize robustness with respect to the noise data using the neural network mechanism.72 When HAC is applied to a large number of data, it is difficult for it to inter-pret patterns because it is unable to reevaluate the results, which causes some clusters of patterns to be based on local decisions.4,72 As Hierarchical Growing Self-Organizing Tree (HGSOT) algorithm72 indicates to be a more appropriate clus-tering algorithm than HAC on some genes because it gives a more suitable hierarchical structure, it can also identify more elusive patterns at the lesser hierarchical levels. So it can be concluded that the HC has some difficulty in clustering larger data.74,80 Table 1 outlines some clustering algorithm used in literature, their drawbacks, and proposed solutions to over-come the various drawbacks.
Partition clustering. The main limitation of these
clustering algorithms is that it produces a poor outcome due to
overlying of data points each and every time a point is near the center of another cluster.76 Dynamical clustering82 is a parti-tioned iterative algorithm that uses a predefined number of classes to optimize the best fitting between classes and their representation. The major drawback of this approach is its sen-sitivity to the selection of the initial partition.2
Affinity Propagation (AP)83 suffers from a number of limitations. The hard restraint of having exactly one exem-plar per cluster restricts AP to classes of regularly shaped clusters and leads to suboptimal performance.84 AP may force division of single clusters into separate ones, which also has robustness limitations.84 Leone and Weigt84 suggested that these limitations might be resolved by adjusting the original optimization task of AP and by reducing the AP hard con-straints. K-means clustering algorithm is a renowned cluster-ing method; however, the computational complexity of the original K-means algorithm13 is very high, especially for large datasets and for real-life problem,2 the number of expected clusters is required, “suitable number of clusters cannot be pre-dicted”.1,2,4,5,16,71,76,80,85 Handhayani and Hiryanto16 proposed a fully unsupervised clustering method called IKKM, which can be used to cluster the gene in the feature space. Clusters formed do not satisfy a quality guarantee.86 The research by Chandrasekhar et al.3 focused on developing the clustering algorithms without giving the initial number of clusters to overcome the above limitation.
K-Means algorithm is based on random selection of initial seed point of preferred clusters; this limitation was astounded with Cluster center initialization algorithm (CCIA) to discover the initial centroids to avoid the random selection of initial values. As a result, the CCIA is not reliant upon any choice of the amount of clusters and automatic evaluation of initial seed centroids and it yields better results.2 The K-means clustering result is very sensitive to noise and outliers.1,2,4,21,71,76,80,85
The K-means algorithm does not necessarily find the most optimal configuration, corresponding to the global objective function minimum,71 which tends to be trapped in a local optimum.75,80,87,88 Its results are quite subject to the random initialization process, such that different runs of K-means on the same dataset might produce different clusters.85,87,89,90 It has also been seen that K-means is quite very vulnerable to the existence of scattered genes.77,85 Fast Genetic K-means Algo-rithm (FGKA)130 suffers from a likely limitation, if the muta-tion probability is quite small, the amount of allele changes will be little, and the cost of computing the centroids and Total Within-Cluster Variation from scratch have a likelihood of being more costly than calculating them in an incremen-tal fashion.88 Lu et al.87 proposed a clustering method named Incremental Genetic K-means Algorithm (IGKA) that out-performs FGKA when the mutation probability is small. A limitation of the k-medoid-based algorithms is that they could take a lot of time and as a result cannot be proficiently applied to large datasets. Additionally, the quantity of clus-ters c has to be selected a priori.71 PAM is very vulnerable
to the presence of scattered genes.77 One major limitation of CLARANS clustering algorithm is that it tends to assume that all data to be clustered can be vested in the main memory simultaneously, which is definitely not possible at all times especially when dealing with a large database. Due to this limitation, the CLARANS clustering algorithm decreases in run time when faced with large databases.79
Model-based clustering. Model-based clustering
algo-rithm might sometimes rely on the suppositions that the
dataset fits a specific distribution.4 SOM similar to K-means and PAM, requires the grid structure and the number of clus-ters as inputs.1,4,75,85,86 SOM maps high-dimensional data into 2D or 3D space.1 SOM is widely adopted as a clustering tech-nique for gene expression data; however, the attempt to merge different patterns into a cluster can make SOM ineffective.4 Each time it produces an unstable solution, it is quite chal-lenging to identify clear clustering limits from the result of SOM.90 Another downside of SOM is that it assigns some
Hierarchical
AGNES
CURE
DENCUE
DBSCAN MODIFIED DBSCAN
HYBRIDIZED K-MEANS K-MEANS PAM STING OPTIGRID MOCK MOFUZZY FUZZY K-MEANS FLAME SOM CHINESE RESTAURANT BICLUSTERING TRICLUSTERING TRICLUSTER gTRICLUSTER GENCLUSTMOO COREGULATED BICLUSTER ITWC Minimum spanning tree Cluster ensemble Multi-clustering Model based Soft clustering MultiObjective Grid based Traditional Clustering partitional Density based Recent method SiMM-TS
samples based on the genes’ expression levels across all the samples into some particular classes,39 and the sacrifice of implicit projection and restriction from d-dimension to 2D space needs to be specified.75 One major limitation of Multi-Elitist QPSO (MEQPSO)90 clustering method is the encod-ing strategy of the length of the particles, which leads to the deterioration of the runtime of MEQPSO.77 Furthermore, the amount of clusters should be determined before the algo-rithm is implemented by the user, which simply means that MEQPSO cannot determine the amount of clusters during the clustering process.77
soft clustering. Due to the nature of FKM, it is more
time consuming to calculate the membership function than in K-means.75 PK-means clustering algorithm was proposed by Du et al.75, which is more reliable than FKM algorithm, and it has a fast convergence rate and low computation load. Gaussian mixture model (GMM)131 clustering algorithm
has some drawbacks: GMM needs prior information of the amount of clusters that will be built which is quite not feasible and its result is also not stable.17 Ma’sum et al.17 proposed a different clustering method called intelligent K-means (IK-Means) algorithm, to overcome these limitations of GMM. EM algorithm132 which is a soft variant133 of the K-Means algorithm has related limitations like K-means71; it is initial-ized by randomly choosing the parameter vector. Also, like K-means, the EM algorithm could get trapped in a local max-imum of the log-likelihood.71
Grid clustering algorithm. The threshold value of the
size of the grid is required in grid clustering algorithms.73,76 To overcome this drawback, a method of adaptive grids is recom mended, which automatically regulates the size of grids based on the data distribution and does not necessarily need the user to stipulate any parameter like the grid size or the density threshold, eg, STING, Wave Cluster, CLIQUE, and OPTICS.76 WaveCluster134 clustering algorithm is not quite suitable for high-dimensional datasets.79
density-based hierarchical approach. With these
algo-rithms, the structure of the attraction tree is quite difficult to deduce when the datasets are quite large and the data structure becomes complicated.4 In disparity to many other partitioning clustering algorithms such as K-means and k-medoid meth-ods, DBSCAN11 can identify clusters of arbitrary shape and is robust against noise. However, the result of this clustering algorithm strongly hinges on a right choice of the parameters and the minimum point.71 It also does not function properly if the data is high dimensional and the Euclidean distance is used to find proximity of objects.79
what is the Quality of my clustering?
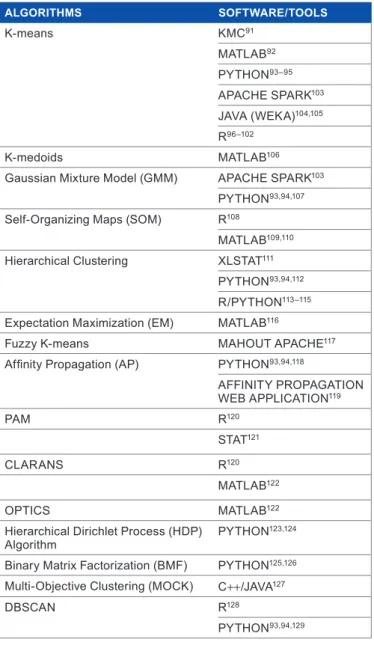
With the development of quite a number of clustering algo-rithms coupled with the challenge of determining actual number of true clusters in a given dataset,135 validating a cluster has become very essential136 in clustering analysis to vindicate the accuracy of a partition. According to Jain and Dubes,137 validating a cluster refers to procedures that evalu-ate the results of clustering analysis in a quantitative and objective fashion. Cluster validity indices have been used to find an optimal number of clusters when the amount of clusters in a dataset is not identified in advance138,139 and it is usually independent of clustering algorithms in use.140 The notion behind cluster validity is majorly to discover “compact and well-separated clusters”.141–144 Compactness is used as a measure of the variation of the data contained in a particular cluster, while separation shows the segregation of the clusters from one another.143 The application of most validity indices is quite computationally, exhaustive, mostly when the amount of input data and the amount of clusters are relatively large.38 Quite a number of validity indices use sample mean of each subset, while some use all the points in each subset in their computation. Also a fair amount of validity indices are reliant on the data while quite a few are reliant on the number of Table 1. some clustering algorithms and software packages/tools
corresponding to the algorithms.
AlGoRiThmS SofTwARE/ToolS K-means Kmc91 matlaB92 Python93–95 aPachE sParK103 JaVa (WEKa)104,105 r96–102 K-medoids matlaB106
gaussian mixture model (gmm) aPachE sParK103
Python93,94,107
self-organizing maps (som) r108
matlaB109,110
hierarchical clustering Xlstat111
Python93,94,112
r/Python113–115
Expectation maximization (Em) matlaB116
fuzzy K-means mahoUt aPachE117
Affinity Propagation (AP) Python93,94,118
affinity ProPagation WEB aPPlication119 Pam r120 stat121 clarans r120 matlaB122 oPtics matlaB122
hierarchical dirichlet Process (hdP)
algorithm Python
123,124
Binary matrix factorization (Bmf) Python125,126
multi-objective clustering (mocK) c++/JaVa127
dBscan r128
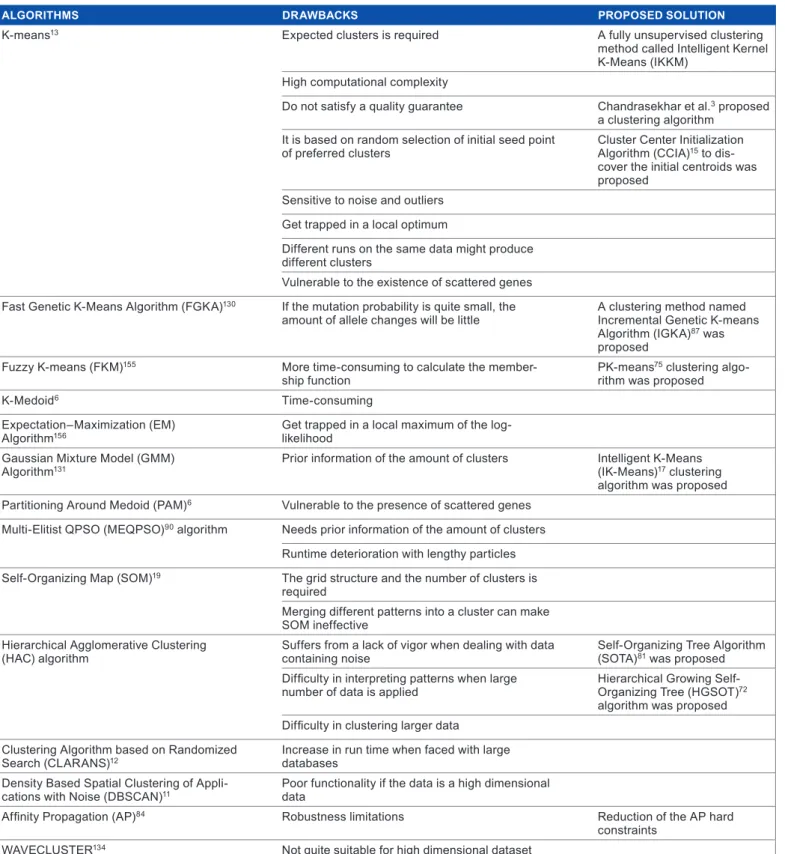
Table 2. some clustering algorithms, their drawbacks, and proposed solutions.
AlGoRiThmS DRAwbACkS PRoPoSED SoluTion
K-means13 Expected clusters is required a fully unsupervised clustering
method called intelligent Kernel K-means (iKKm)
high computational complexity
do not satisfy a quality guarantee chandrasekhar et al.3 proposed
a clustering algorithm it is based on random selection of initial seed point
of preferred clusters cluster center initialization algorithm (ccia)15 to
dis-cover the initial centroids was proposed
sensitive to noise and outliers get trapped in a local optimum
different runs on the same data might produce different clusters
Vulnerable to the existence of scattered genes
fast genetic K-means algorithm (fgKa)130 if the mutation probability is quite small, the
amount of allele changes will be little a clustering method named incremental genetic K-means algorithm (igKa)87 was
proposed
fuzzy K-means (fKm)155 more time-consuming to calculate the
member-ship function PK-means
75 clustering
algo-rithm was proposed
K-medoid6 time-consuming
Expectation–maximization (Em)
algorithm156 get trapped in a local maximum of the log-likelihood
gaussian mixture model (gmm)
algorithm131 Prior information of the amount of clusters intelligent K-means (iK-means)17 clustering
algorithm was proposed
Partitioning around medoid (Pam)6 Vulnerable to the presence of scattered genes
multi-Elitist QPso (mEQPso)90 algorithm needs prior information of the amount of clusters
runtime deterioration with lengthy particles
self-organizing map (som)19 the grid structure and the number of clusters is
required
merging different patterns into a cluster can make som ineffective
hierarchical agglomerative clustering
(hac) algorithm suffers from a lack of vigor when dealing with data containing noise self-organizing tree algorithm (sota)81 was proposed
Difficulty in interpreting patterns when large
number of data is applied hierarchical growing self- organizing tree (hgsot)72
algorithm was proposed Difficulty in clustering larger data
clustering algorithm based on randomized
search (clarans)12 increase in run time when faced with large databases
density Based spatial clustering of
appli-cations with noise (dBscan)11 Poor functionality if the data is a high dimensional data
Affinity Propagation (AP)84 robustness limitations reduction of the aP hard
constraints
WaVEclUstEr134 not quite suitable for high dimensional dataset
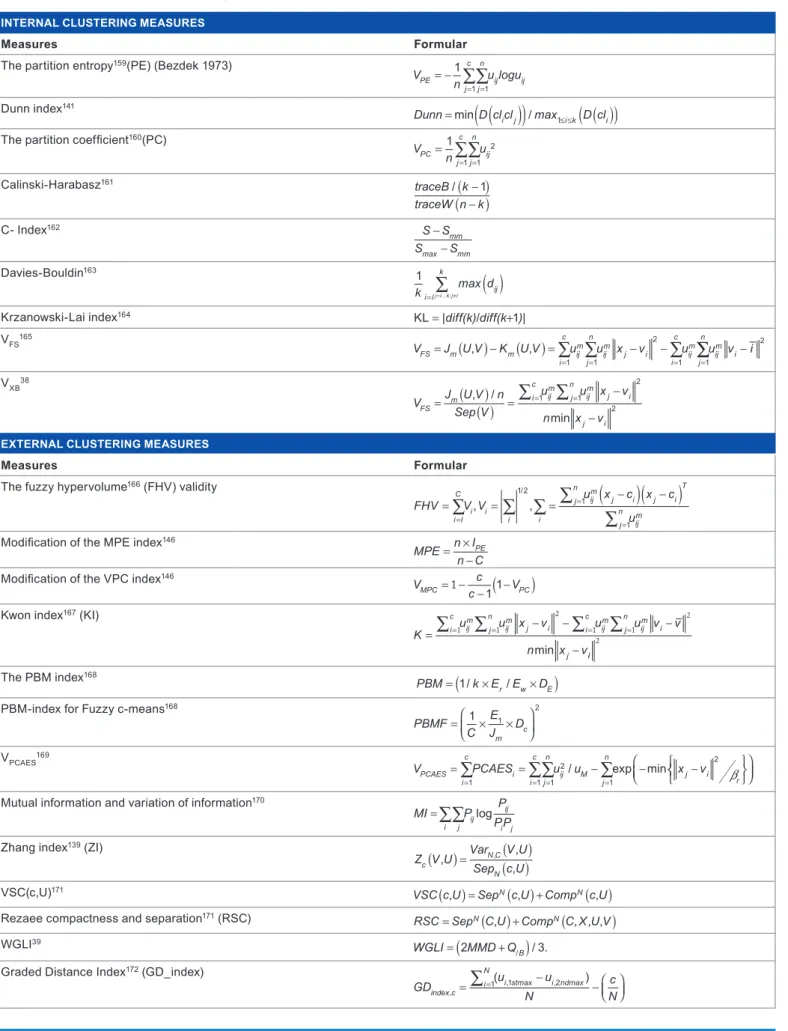
clusters.145–147 There are internal and external cluster validity indices. For external cluster validity measures, the various methods evaluate to which extent the structure of the cluster-ing discovered by the clustercluster-ing algorithm used matches some external structure, which is a supplementary information that was not used during the clustering process.140,142,144 A few
number of validity indexes that has been proposed and used in literature are presented in Table 2.
As listed in Table 3, a lot of different measures have been developed to validate the authenticity of a cluster; for many of these measures developed, there exists a clustering algorithm that will optimize it. According to D’haeseleer,142 the real test