Procedia Computer Science 55 ( 2015 ) 62 – 71
1877-0509 © 2015 Published by Elsevier B.V. This is an open access article under the CC BY-NC-ND license (http://creativecommons.org/licenses/by-nc-nd/4.0/).
Peer-review under responsibility of the Organizing Committee of ITQM 2015 doi: 10.1016/j.procs.2015.07.008
ScienceDirect
Information Technology and Quantitative Management (ITQM 2015)
Auditing Vehicles Claims using Neural Networks
André Machado Caldeira
a*, Walter Gassenferth
b, Maria Augusta Soares Machado
c,
Danilo Jusan Santos
daFuzzy Consultoria Ltda Av. Nossa Senhora de Copacabana 1376/ 302 Rio de Janeiro, Brazil bQuântica Consultoria Empresarial Ltda, Rua Ruy Porto 120- sala 212, Barra da Tijuca , Rio de Janeiro, RJ, Brazil
cIbmec-RJ, Av. Presidente Wilson, 118, 11th floor, 20030-020, Rio de Janeiro,RJ, Brazil dIbmec-RJ, Av. Presidente Wilson, 118, 11th floor, 20030-020, Rio de Janeiro,RJ, Brazil
Abstract
Nowadays, fraud is a major enemy of insurance companies. For the total of R$ 28 billion in claims, an estimated R$ 7 billions must be fraud. Since the claims represent 59.9% of the premiums paid by the companies, frauds represent 15.0% of them. Therefore, great caution is to be taken in order to detect the frauds and not to pay for these claims. One of the most important detection tools is the audit. However, because it is an expensive service, it is not possible to audit all claims. Based on this caution, the goal of this work is to test some strategies of how to select claims to be audited. The strategies used become more complex, from the first to the fifth, starting with simple thoughts for the first three strategies, and the utilization of logistic models and neural network to estimate the probability of a fraud detection on the fourth and fifth strategies, respectively.
© 2015 The Authors. Published by Elsevier B.V.
Selection and/or peer-review under responsibility of the organizers of ITQM 2015 Keywords: Audit, Fraud, Logistic Model, Neural Networks, Claim.
1. Introduction
An insurance contract involves a bilateral agreement between the insurance company and the beneficiary in which the company covers the risk. The policyholder’s attitude regarding a claim is not always honest. Insurance companies have been more and more concerned with insurance frauds, since the claim represents a high cost that corrodes the company’s profit margin.
* Corresponding author. Tel.: +55-21-3813-1724; fax.: +55-21-3813-1724
E-mail address:amcaldeira@yahoo.com.br.
© 2015 The Authors. Published by Elsevier B.V. This is an open access article under the CC BY-NC-ND license (http://creativecommons.org/licenses/by-nc-nd/4.0/).
Some theoretical studies on insurance frauds consider some audit patterns to control the frauds [1], [2]; however, the cost of these audits may render such action unfeasible. This action assumes that the company can obtain some information on the claim through auditing, but at a cost. It implicitly suggests that the auditing process always distinguishes a fraudulent claim from an honest one. The main discussion involves the preparation of a contract that minimizes the insurance company’s cost by including the full payment of the claim plus the audit cost. Normally, the models that have this structure use the overall amount of the insurance to decide on applying monitoring techniques [1], [3]. In some other works, deterministic audits are compared with random audits [4], or the insurance company is supposed to accept an audit strategy.
Models have been designed to detect frauds; reference [5] used multiple linear regression models to select indicators of different types of fraud. Reference [6] utilizes fuzzy techniques to classify the claims. Reference [7] proposes a self-organizable neural network to create groups of claims by characteristics; whereas [8], [9], [10] suggest discrete choice models to estimate the likelihood of a fraud existing in the claim as based upon the knowledge of the data base on the portfolio of the insurant’s behavior.
This paper aims at creating strategies to support the decision of paying for the insurance or forward it to auditing (including such procedures as investigation, inquiry etc.). The strategies will rely on simple thoughts and models that will estimate the probability of a fraud to be detected after auditing a certain claim. After estimating such probability, the multiplication of it by the value of the claim is an estimate of the savings produced should it be sent for audit to check for fraud.
It is important to emphasize that the fraud variable is a non-observable variable [11]; that is, the source of information used is the base of audited claims, with possible cases of undetected frauds. Another selection bias is the non-assurance that the audit result will reflect the reality, and in some cases of fraud it might not be detected, even after the audit. Therefore, the focus of this study becomes estimating the likelihood of detecting a fraud after the audit and, by this, selecting the claims that should be forwarded for auditing.
Such likelihood shall be estimated by a logistic model and by a Neural Network Model. After such estimate, the strategies of forwarding to audit will be tested in order to verify the best technique to be used by the companies. Such decision shall take into account the claim value and the audit cost.
2. Frauds in Insurances
The main role of insurance is to reestablish the financial balance caused by a physical, material or moral damage. By contracting insurance you protect your assets, since you will rely on the insurance company’s support to pay for repairs or to replace your asset [12].
This financial balance provided for by the insurance companies protects their users and reflects a constant quest, on the part of the insurance companies, for a better relationship between both parties entering into the insurance contract.
On the other hand, one of the biggest obstacles to this relationship is fraud. It hinders the progress of insurance industry and penalizes not only the operators, but also the insurants [13].
A fraud can be understood as any deliberate, deceiving act committed against or by the insurance company, broker, service provider or the policy holder with a purpose of obtaining a non-guaranteed financial gain. The fraud occurs during the process of contracting and use of the insurance [14].
So, it can be defined as an exogenous factor that has been causing a rise in the price of insurance. The defrauders have taken advantage of gaps in the internal investigation systems of the companies to implement schemes that have become more and more elaborate and brought about damages to these companies for many years. The frauds can be committed by gangs or by the ordinary citizen; in the latter case the fraud is committed by reason of financial necessity or a tempting opportunity.
The main insurance branches affected by the frauds are as follows: cars, transportation, fire, health, personal accidents, life, civil responsibility and tourism.
A study ordered by the National Federation of Private Insurance and Capitalization Companies (FENASEG) assessed the economic impact of frauds in the insurance sector to be an estimated R$7 billion out of a total of claim amounting to R$28 billion in 2004. Such cost will only be reduced with a reduction in claims, thus causing the companies to reduce the price of insurance and broaden their market share.
There are cases of fraud in life, assets, health and travel insurance. However, the most common ones are those involving automobile insurance. Here there is a range of possibilities in which the defrauder can act, from the issuance of the policy to the occurrence of the claim. There is a false perception on the part of the population that this type of fraud is acceptable.
The most common types of frauds in car insurance are as follows: • Simulated robbery of vehicles and objects;
• Aggravation of a claim in order to obtain total loss or a compensation for previous damages; • Contracting responsibility for third party claims;
• Request of an overinvoiced receipt or in duplicate in order to get reimbursement of whole amounts; • Overpriced budget in workshops for self-benefit;
• Connivance on the part of the broker to simulate a claim;
• Connivance on the part of the preliminary surveyor for not reporting the damages on the vehicle. The good consumers end up being the main victims of this fraudulent system, for the value paid for their insurance is directly influenced by the increase in the prices.
The fraud is to date one the main challenges of the insurance market. It is necessary that more efficient measures and efforts be taken by the institutions in order to get this picture to improve [15]..
Through such information, the companies are able to realize the best equipment acquisition and maintenance (or any other service) possibilities at a lower cost.
However, in many cases, surveying such information involves the collection of data throughout the company’s several areas. This ends up bringing about a long delay or incomplete information (in the case of short terms). Even with all the information on hand, there still has to be a detailed comparative analysis of the information for a decision to be made.
In this context, the Maintenance Logistics Cost Simulator is a system that aims at simulating the maintenance costs of equipment, also taking into account its components, for a better logistic planning.the Maintenance Logistics Cost Simulator will use both historical information and information from the equipment market used in the Company. Based upon the aspects informed above, this tool will help in the decision-making processes for the maintenance or purchase of equipment.
3. Models for Probability Estimation
a) The Logistic Model
Regression models play an important role in many applications by providing prediction and classification rules and are used as an analytical data tool in order to understand the interactive behavior of different variables [16].
In the dichotomized case, the depending variable indicates the occurrence or not of a certain event. By defining the Yi variable as the i-th individual in the sample to assume one of the two possible results, 0 or 1, Yi has a Bin (ni, pi) distribution, being pi the likelihood of success.
Yi can be represented through a linear model
ij i j
ij
X
u
Where Xi is a vector of observed characteristics to the i-th individual,is a vector of unknown parameters to be estimates, and uij is the error associated with the i-th individual, whereas uij can be estimated by a discrete model. The type of model depends on the suppositions made on the distribution of uij.
The expected proportions pi can be modeled as follows:
qi q i i i i
X
X
p
p
E
E
E
K
¸¸
¹
·
¨¨
©
§
0 1 11
log
(2)By assuming and e performing some operations in the equation above, the probabilities can be represented like:
i ie
e
p
i K K1
(3)Therefore, the output of the logistic regression is the likelihood of an ‘i’ individual to belong to the class assuming value 1. Such result is well used in classification problems and will be used in Strategy 4 as an estimate of the likelihood of a fraud to be detected if i-th claim is submitted for auditing.
b) Neural Network Model
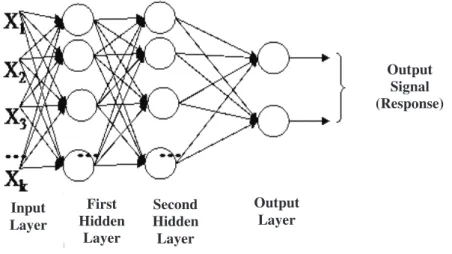
The neural networks are non-linear models that were developed on the basis of how the human brain works. These models have neurons (functions) that receive stimuli and spread them on to other neurons until the last layer is reached, the propagation of which is the model’s response. There are several neural network structures; the one represented below was used in the fifth strategy tested and uses multiple layer perceptrons.
Multiple layer perceptrons consist of neural network trained in a supervised way through the error backpropagation algorithm. This algorithm is based on the rule of learning by error correction. Figure 1 shows the architectural graph of a multiple-layer perceptron with two hidden layers and one output layer.
Figure 1. Architectural graph of a multiple-layer perceptron with two hidden layers.
Input Layer First Hidden Layer Second Hidden Layer Output Layer Output Signal (Response)
This network can be used both in regression and classification problems. The use of it as a classifier must be employed with care when it is intended to estimate the probability of pertinence in a given class. According to the passage below from Simon Haykin’s book, such utilization is possible, but a logistic function must be used in the output neuron and there must be a training set that is large enough.
“One multiple-layer perceptron classifier (using the logistic function as non-linearity) indeed approximates the subsequent class probabilities, since the size of the training set is large enough and the learning process does not get stuck to a local minimum” [17].
4. Case Study
The case study refers to data from 418 claims of a Brazilian company that were audited with an aim at detecting frauds in third party claims. For the study, an audit cost of R$2.000,00 was adopted.
At a first moment, the data base was divided into two parts, one part of 40 cases separated for the study (20 fraud-detected claims and 20 with no frauds detected) and the 378 remaining cases were used to estimate the parameters for the models.
Five audit forwarding strategies will be assessed within the data for the test, namely: • Strategy 1: Not to audit any case.
• Strategy 2: To audit all the cases with a claim higher than the audit cost.
• Strategy 3: To use the probability prior in order to estimate the expectation of savings should the claim be audited. If such expectation is higher than the cost of the audit, the claim will be audited. • Strategy 4: Utilizes the same logic as Strategy 3; however, the probability will be estimated by a
logistic regression model.
• Strategy 5: Utilizes the same logic as Strategies 3 and 4; however, the probability will be estimated by a neural network.
a) Strategy 1
No cases, the result is R$ 0, since there was no cost with auditing and no claim to be paid for. b) Strategy 2
Upon auditing all the claim cases, higher than R$ 2.000,00, of the test base an overall expenditure of R$34.000,00 was spent to audit 17 claims. Overall, 7 frauds were detected and the savings amounted to R$112.571,41. Therefore, the final output of Strategy 2 is savings of R$78.571,41.
c) Strategy 3
The fraud probability prior 25% as calculated on the basis of the FENASEG estimate) must be used in actual data, but for testing this strategy the percentage of utilization of 25% was not fair, since the test sample is balanced; that is, the number of fraudulent and non-fraudulent claims is the same. Therefore, the probability used for the calculation of the expectation of savings was 50%.
The auditing of the 14 cases selected generated a cost of R$28.000,00 and savings of R$109.003,81 due to non-payment of claims in which frauds were detected. The final outcome of this strategy was R$81.003,81.
d) Selection of Variables for Strategies 4 and 5
Strategies 4 and 5 used models to estimate the probabilities of a fraud to be detected after the audit of the claim. For that, some characteristics were used with the intent of modeling this probability from the explanatory variables. The variables to be tested can be seen in Table 1.
Table 1. Variables to be tested
Variable Description
X1 Nr. Of installments of the insurance contract X2 Adjustment for the vehicle value
X3 Value of premium paid / market value
X4 Drver’s age
X5 Quatity of claims / quantity of policies
X6 Age of the vehicle
D1 Partial loss claim
D2 Total loss claim
D3 Claim involving a third party
D4 Total loss coverage contracted
D5 Robbery coverage contracted
D6 Third party coverage contracted
D7 Personal accident coverage contracted D8 State of claim different from Traffic Dept. State D9 00:00 < claim time < 06:00
D10 Police holder’s sex
D11 Claim informed between 1 and 60 days D12 Claim occurred within the first 60 days of policy D13 Suspicious words: ex.: obstacles, light post…
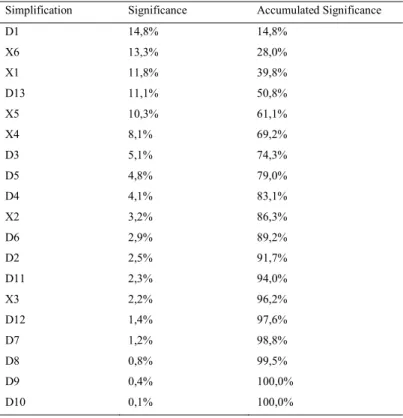
The variables of Table 1 were normalized and went through two variable selection algorithms. The SIE method presented in table 2 described in [18] selected six variables. One other method used was the LSE described in [19] and presented in table 3. By using a cutting point at 80% of accumulated significance, this method selected nine variables, out of which five coincided with the SIE method. Following this selection of variables, specialists were consulted in order to verify the need to force any variable into the model that is deemed indispensable. The specialist pointed only the D12 variable.
Table 2. SIE Method
Simplification Significance Accumulated Significance
X3 66,17% 66,17% X4 5,69% 71,86% D3 5,43% 77,29% X6 4,27% 81,56% X1 4,12% 85,68% D4 3,97% 89,65%
Table 3. LSE Method
Simplification Significance Accumulated Significance
D1 14,8% 14,8% X6 13,3% 28,0% X1 11,8% 39,8% D13 11,1% 50,8% X5 10,3% 61,1% X4 8,1% 69,2% D3 5,1% 74,3% D5 4,8% 79,0% D4 4,1% 83,1% X2 3,2% 86,3% D6 2,9% 89,2% D2 2,5% 91,7% D11 2,3% 94,0% X3 2,2% 96,2% D12 1,4% 97,6% D7 1,2% 98,8% D8 0,8% 99,5% D9 0,4% 100,0% D10 0,1% 100,0% e) Strategy 4
Strategy 4 makes use of a logistic regression model to estimate the probabilities of fraud so it can assess whether or not it is necessary to conduct an audit of a certain claim.
On the test base, the results were 75.0% of correct classification and one Mean Square Error (MSE) of 0.199, thus pretty close to the value of the base used for the estimate (MSE=0.198). The values presented by the MSE in other sets of variables were very close to the values presented in this set. For this MSE value, a 66.7% correct classification percentage was obtained on the estimate basis.
Strategy 4 selected 12 claims for audit, out of which 6 were detected for frauds. The overall cost of the audits was R$24 thousand, whereas non-payment for fraudulent claims resulted in savings of R$109.003,81. Therefore, the final result of Strategy 4 is R$85.003,81.
f) Strategy 5
Strategy 5 uses a neural network to estimate the probability of a fraud to be detected after an audit. For this end, the neural network must have an output neuron with a sigmoid function [17]. Now, the number of neurons in the hidden layer and their functions may vary.
In order to select the best network topology, the estimate data were divided into two groups: the first one having 70% of the overall data was used to estimate the parameters; the remaining 20% were used for validation (having in mind that 10% were separated for tests).
At a first moment, the number of neurons in the hidden layer was tested, having a variation between 3 and 9. The results presented in table 4, after a cross validation with 100 combinations of fitting set and validation, show superiority of mean correct classification, and a lower Mean Square Errors (MSE) for the network with 5 neurons in the hidden layer.
Table 4. Result of the cross validation for performance (100 combinations) Number of Neurons in the Hidden Layer
Statistics 3 4 5 6 7 8 9
Mean of MSE 0.227 0.228 0.221 0.225 0.220 0.223 0.225
MSE Minimum 0.167 0.189 0.183 0.168 0,175 0.167 0.163
Mean Hit 65.4% 65.0% 66.0% 65.1% 65.8% 65.5% 65.1%
Maximum Hit 76.5% 74.1% 75.3% 75.3% 75.3% 78.8% 76.5%
After selecting the number of neurons, the definition of a criterion to choose the moment of stop of the fitting is required so as to avoid overfitting. For this end, some performances (measured by the MSE) were tested in the training by using a cross validation similar to the previous one. The results presented in table 5 of this test show superiority when the network is fitted with a MSE of 0.20.
Table 5. Result of the cross validation for the number of neurons (100 combinations) Performance (MSE) in the Training
Statistics 0.17 0.18 0.19 0.2 0.21 0.22 0.23
Mean of MSE 0.234 0.222 0.221 0.221 0.224 0.226 0.235
MSE Minimum 0.180 0.162 0.171 0.174 0,164 0.167 0.191
Mean Hit 65.4% 65.9% 65.9% 66.5% 66.2% 64.8% 62.7%
Maximum Hit 74.1% 75.3% 76.5% 77.6% 77.6% 78.8% 75.3%
After these results, the network topology has been well defined by using the eleven variables selected. The set of tests was used for the purpose of strategy comparison; however, before calculation the strategy results, the network performance will be analyzed. As for the estimate of probabilities, the mean square error (MSE) on the test basis was 0.18, whereas 75% of cases were classified correctly.
The results to Strategy 5 were obtained through the estimated network probabilities. In this strategy, 11 claims are selected for audit, out of which 7 were detected for fraud. The overall cost of the audits was R$22 thousand, whereas non-payment for fraudulent claims resulted in savings of R$112.571,41. Therefore, the final result of Strategy 5 is R$90.571,41.
5. Conclusion
As it could be seen in this work, the intelligent techniques can help companies save capital by selecting the claims that should be audited. As the complexity of the selecting intelligent algorithm increased, the results
were get better; however, in terms of classification, the models showed positive results, though not so good. The models had a correct classification percentage of 75%.
The MSE are not so good either; they are relatively high for a probability estimate. When the logistic model was used, the MSE in the test basis was 0.2, a result that, upon taking the square root, represents an absolute mean error of 44.6%. The neural network had a little better result, with an absolute mean error of 42.3%.
Therefore, the probability of a fraud being detected after the audit is not so predictable. Other models can be used such as the TOBIT [11], which is an alternative for those cases where the response variable is not observable, but similar results to the logistic one are likely to exist. Other explanatory variables should be analyzed in order to improve the performance of predictions.
The result of the comparison of strategies presented in table 6 somehow was a little predictable; as the strategies become more complex, in a more robust manner, they get more efficient. Therefore, Strategy 1 has the worst result, since it is not inhibiting the fraud. Strategy 2 has better results, since fights fraud, even in a non-structured way.
The other strategies are different from the previous ones, since they input the selection, in an intelligent manner, of the cases to be audited. While Strategy 3 uses the simplest method to estimate the probability of fraud (the probability prior), Strategies 4 and 5 make use of both statistical and computing intelligence to estimate them.
Table 6. Ranking of strategies
Ranking Strategy Result
1 Strategy 5 R$ 90.571,41
2 Strategy 4 R$85.003,81
3 Strategy 3 R$81.003,81
4 Strategy 2 R$78.571,41
5 Strategy 1 R$ ––
To select the claims, which must be sent for audit is an extremely difficult task, especially due to the high audit cost. However, such difficulty is to be faced. One of the most effective devices to date is the denunciation by phone to the insurance companies; but only a small share of frauds is denounced; once again, what really matters is the selection decision of fraud-suspected cases, which must be audited. There are cheaper mechanisms to detect frauds, though less effective. This paper used only the audit and an instrument.
References
[1] E. W. Bond and K. J. Crocker, “Hardball and the Soft Touch: The Economics of Optimal Insurance Contracts with Costly State Verification and Endogenous Monitoring Costs”, ]ourna\ of Public Economics, vol. 63, pp. 239-264, 1997.
[2] P. Picard, “Auditing claims in the insurance market with fraud: the credibility issue,Journal of Public Economics, vol. 63 , pp. 27–56, 1996.
[3] K. J. Crocker and S. Tennyson, Costly State Falsification or Verification? Theory and Evidence from Bodily hijury Liability Claims, in; G, Dionne and C. Laberge- Nadeau, eds.. Automobile Insurance: Road Safety, New Drivers, Risks, Insurance Fraud and Regulation (Boston, Mass.: Kluwer), 1999.
[4] P. Picard, 2000, Economic Analysis of Insurance Fraud, in: G. Dionne, ed.. Handbook of Insurance (Boston, Mass.; Kluwer), 2000. [5] H. I. Weisberg and R. A. Derrig,Quantitative Methods for Detecting Fraudulent Automobile Bodily Injury Claims (Boston, Mass.:
[6] R, A. Derrig and K. M. Ostaszewski, Fuzzy Techniques of Pattern Recognition in Risk and Claim Classification, journal of Risk and Insurance, vol. 62, pp. 447-482, 1995.
[7] P. L. Brockett, R. A. Derrig and X. Xia Using Kohonen's Self Organizing Feature Map to Uncover Automobile Bodily Injury Claims Fraud, Joumal of Risk and Insurance, vol. 65, pp. 245-274, 1998.
[8] E. B. Belhadji and G. Dionne, Development of an Expert System for the Automatic Detection of Automobile Insurance Fraud, Working paper 97-06, Ecole des Hautes Etudes Commerciales, Universite de Montreal, 1998.
[9] M. Artis, M. Ayuso, and M. Guillen, Modelling Different Types of Automobile Insurance Fraud Behaviour in the Spanish Market, Iusurnnce: Mnthcnjatics and Economics, vol. 24, pp. 67-81, 1999.
[10] M. Artis, M. Ayuso, and M. Guillen,Detection of Automobile Insurance Fraud With Discrete Choice Models and Misclassified Claims, Journal of Risk and Insurance, vol. 69, pp. 325-340, 2002.
[11] J. Tobin, Estimation of relationships for limited dependent variables, Econometrica, vol. 26, pp. 24-36, 1958. [12] FENASEG, O seguro do automóvel pela via da informação. Rio de Janeiro. 2005, Disponível em <
http://www.fenaseg.org.br/fenaseg/publicacoes/guias/guia_seguro_automovel.pdf >. Acesso em : 15 novembro 2005. [13] L. Parodi., Manual das Fraudes. Rio de Janeiro: Brasport, 2005.
[14] FENASEG, “A experiência internacional na construção do Plano Integrado de Prevenção e Redução da Fraude em Seguros,” Rio de Janeiro: ATKearney, 2004. Disponível em <
http://www.fenaseg.org.br/servicos/prevencao/palestras/RJ_-A_Experiencia_Internacional_na_Construcao_do_Plano_Integrado_-_Bruno_Laskowski.zip>. Acesso em : 15 novembro 2005. [15] Ernst & Young. TaxNews109, 2002. Disponível em
<http://www.ey.com/GLOBAL/ccr.nsf/Images/327BD43CFA60383785256CFC004FD82C/$FILE/taxNews109.pdf>. Acesso em : 15 novembro 2005.
[16] T. Hastie and R. Tibshirani, Generalized Additive Models, Department statistics and division of biostatistics, Stanfor University, 1995. [17] S. Haykin, Neural Networks: A Comprehensive Foundation, Prentice Hall, Upper Saddle River, NJ, 1999.
[18] Y. Cao and D. Rossiter, An input pre-screening technique for control structure selection, Computers chem. Engng., vol. 21, pp.563-569, 1997.
[19] F. L. Chung and J. C. Duan, On Multistage Fuzzy Neural Network Modellng, IEEE Transactions on Fuzzy Systems, vol. 8, pp. 125-142,2000