Computationally characterizing genomic pipelines
using high-confident call sets
Xiaofei Zhang
1and Sally R. Ellingson
21 Department of Computer Science, University of Kentucky, Lexington, KY 2
Division of Biomedical Informatics, College of Medicine, University of Kentucky, Lexington, KY and Cancer Research Informatics Shared Resource Facility, Markey Cancer Center
[email protected], [email protected]
Abstract
In this paper, we describe some available high-confident call sets that have been developed to test the accuracy of called single nucleotide polymorphisms (SNPs) from next-generation sequencing. We use these calls to test and parameterize the GATK best practice pipeline on the computing cluster at the University of Kentucky. Automated scripts to run the pipeline can be found at https://github.com/sallyrose0425/GATKBP. This study demonstrates the usefulness of high-confident call sets in validating and optimizing bioinformatics pipelines, estimates computational needs for genomic analysis, and provides scripts for an automated GATK best practices pipeline.
Keywords: Next-generation sequencing, High-performance computing, genomic analysis pipeline
1
Introduction
Since sequencing costs are dropping, improved management of data analysis and storage will be essential for state-of-the-art research and for efficient clinical decision-making based on next generation sequencing (NGS). A common challenge is the identification of variations within sequences that may be the cause of particular traits or diseases; these could be single nucleotide polymorphisms (SNPs), small insertion or deletions (indels), or structural variations (swapping of the location of genes). All of these areas are still being actively researched. New methods are being developed to address experimental errors in base calling and computational errors in read alignment. It has been shown that using different sequencing technologies results in different SNP calls (Rieber, Zapatka et al., 2013) with as many as tens of thousands of SNPs being called only on a specific sequencing platform (Lam, Clark et al., 2012). In addition to variations resulting from different sequencing technologies, different SNP calling pipelines may give drastically different results. Using five different pipelines and fifteen samples from the same sequencing technology, only an average concordance of 57.4% was found for called SNPs (O’Rawe, Jiang et al., 2013). Even more
Volume 80, 2016, Pages 1023–1032
ICCS 2016. The International Conference on Computational Science
worrisome, using three indel-calling pipelines only gave an average concordance of 26.8% for called indels. These massive differences in results show how important benchmark data will be in testing new pipelines and technologies.
As genetic data is now being used to make decisions, it is very important to use well established, tested, and verified methods while establishing and maintaining competency in the state-of-the-art in both the technology and analysis. In this paper we demonstrate how to use high-confident variation call sets to test and optimize a genomic analysis pipeline. This study sets up an automated workflow that allows researchers to quickly, easily, and reproducibly test a genomic analysis pipeline, allowing different aspects to be changed (such as parameter settings, computational architecture, or analysis software and tools) and compare the efficiency and accuracy trade-offs of different methods.
2
Method
2.1
GATK best practices
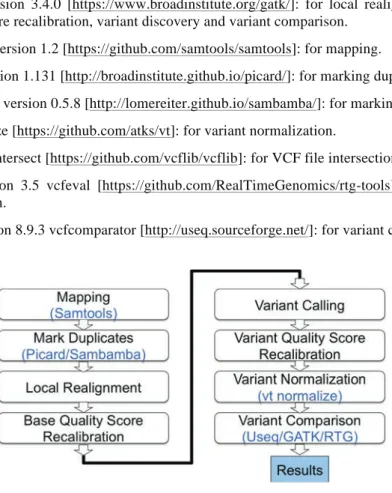
The Genome Analysis Toolkit (GATK) best practices is a recommended workflow developed as part of the Broad Institute's sequencing projects and experience over the years. It consists of three parts: data pre-processing, variant discovery, and variant refinement. The data pre-processing part takes FASTQ files from the sequencer as input. Pre-processing consists of mapping, marking duplicates, local realignment around indels, and base quality score recalibration (BQSR) and produces an analysis-ready binary alignment (BAM) file. The mapping and duplicate marking steps use tools not in the GATK suite. Variant discovery takes the BAM as input and produces a raw variant call format (VCF) file, which contains all the observed variation records with maximal sensitivity. During variant refinement the variant quality score recalibration (VQSR) step is applied. It generates a recalibrated VCF file that contains the variation records with higher specificity. Next, genotype refinement, functional annotation and variant evaluation can be applied to the recalibrated VCF file base on different research purposes.
GATK provides two kinds of variant callers, UnifiedGenotyper and HaplotypeCaller. HaplotypeCaller is the recommended one, which calculates the haplotype likelihoods and identifies the variants on it. It is likely to provide better results than UnifiedGenotyper, but with decreased computational efficiency.
In the VQSR step, an intersection between a known truth set (HapMap (Gibbs, Belmont, et al. 2003)(Consortium, 2010), 1000 Genomes (Consortium, 2015), and dbSNP (Sherry, Ward et al., 2001) data is used here) and the test dataset are used to build a Gaussian mixture model. Based on annotations of the test dataset a VQSLOD value, which represents the likelihood that a reported variant is true, is assigned to each record. Based on this value, the dataset can be partitioned into quality tranches. The tranches are the thresholds within the test data that correspond to certain levels of sensitivity relative to the truth sets. Different tranches can be set to filter out the variant records with lower quality score. The higher tranche provides higher sensitivity but lower specificity.
In this article, the pre-processing part and the variant discovery part were applied to test datasets. Running time and file sizes of input and output were recorded. Both UnifiedGenotyper and HaplotypeCaller are included in our tests. The variant call sets relative to different tranches were also collected. Figure 1 diagrams the workflow.
2.2
Tools
• GATK version 3.4.0 [https://www.broadinstitute.org/gatk/]: for local realignment, base quality score recalibration, variant discovery and variant comparison.
• Samtools version 1.2 [https://github.com/samtools/samtools]: for mapping.
• Picard version 1.131 [http://broadinstitute.github.io/picard/]: for marking duplicates.
• Sambamba version 0.5.8 [http://lomereiter.github.io/sambamba/]: for marking duplicates.
• vt normalize [https://github.com/atks/vt]: for variant normalization.
• vcflib vcfintersect [https://github.com/vcflib/vcflib]: for VCF file intersection.
• RTG version 3.5 vcfeval [https://github.com/RealTimeGenomics/rtg-tools]: for variant comparison.
• Useq version 8.9.3 vcfcomparator [http://useq.sourceforge.net/]: for variant comparison.
2.3
Test datasets
The University of Kentucky Oncogenomics facility is equipped with an Illumina HiSeq machine so that is the input type chosen for this study. Two whole genome sequencing datasets were selected which were generated from genetic material from NA12878, a female Utah residents with ancestry from northern and western Europe (CEPH) and part of the HapMap project (Gibbs, Belmont et al., 2003)(Consortium, 2010). The National Institute of Standards and Technology (NIST) has developed reference material for this genome (extracted DNA from a homogenized cell lines) which is available for purchase and in-house testing. This material enabled the approval of the first NGS machine by the Food and Drug Administration (Collins and Hamburg, 2013). The ERP1229 test dataset consists of four pairs of paired end data from different runs with an average depth of coverage of 14. The ERP001960 test dataset consists of one pair of paired end data with an average depth of coverage of 58. ERP001229 has a mean read length of 99 and ERP001960 has a mean read length of 201.
Links to the input test datasets can be found at the webpage, ftp://ftp-trace.ncbi.nih.gov/giab/ftp/technical/NA12878_data_other_projects/sequence_read/.
2.4
High confident call sets
Two high-confident call sets, a set of SNPs that are confidently called based on evidence from several sources, are used in this study. One developed by the Genome in a Bottle Consortium (GiaB) and also one developed by Illumina. Both call sets are based on genetic information from NA12878.
The Genome in a Bottle Consortium (https://sites.stanford.edu/abms/giab) initiated by NIST has developed methods for combining data sets obtained from the same individual by different technologies in order to better elucidate the true nature of the data without biases created by different technologies (Zook, Chapman et al., 2014). In this study they provide high-confident SNPs and indel calls for NA12878 by integrating 14 data sets from five different sequencing technologies. Their call sets are available at ftp://ftp-trace.ncbi.nih.gov/giab/ftp/release/NA12878_HG001/. Versions 2.18 and 2.19 were both used in this study.
The Illumina’s Platinum Genomes (http://www.illumina.com/platinumgenomes/) variant calls are made by requiring concordance across multiple analysis methods and incorporating an inheritance structure by including multiple members of the pedigree. Version 7.0 (PGv7) of this dataset is used. All high confident call sets are provided as a VCF file, which contains the variation records, and a BED file, which specifies the regions of the genome in which the variation calls are highly confident.
2.5
Variant normalization
An open source tool, vt normalize was used to eliminate potential errors which can be generated from the different representation of variants from different analysis tools (Tan, Abecasis et al, 2015). Variant normalization was applied to the test datasets and the high confident references before the variant comparison.
2.6
Variant comparison
Due to the slight differences in how variants may be represented in VCF files and exactly how a VCF comparison tool decides if two variant records are a match, different tools may give different results. Therefore, we tested three comparison tools to quantify the differences and evaluate their features. In this variant comparison, we only compare the regions of the genome in which high-confident calls are made (i.e. the regions in the BED file corresponding to the high-high-confident call set).
VariantEval in GATK generates statistical results when comparing test and reference datasets, but the genomic region of interest, of high-confident calls, must be extracted first. The vcflib vcfintersect tool is used first to obtain an intersection VCF file of the original VCF file generated from our test dataset and the BED file of high confident regions in the reference set. RTG vcfeval and Useq vcfcomparator can directly include the BED file in the command line and produce the intersection VCF files and the statistical report in one step.
2.7
Evaluation criteria
The true positives rate (TPR) is defined as
This is the number of variant records that are in both the test data and the high-confident reference data divided by the total number of variants in the reference dataset.
This is the number of variant records that are in both the test data and the high-confident reference data divided by the total number of variant calls made in the test data that lie in the regions of the genome that correspond to regions where high-confident calls are made in the reference data.
Numbers of not match (nNotMatch): Number of records which are in our test data located in the confident region but not in the high confident reference VCF file. Note, a variant being counted in nNotMatch does not necessarily mean it is not a true variant, it just means that it was not called in the high-confident calls.
2.8
Computational Infrastructure
The pipeline was tested on the high-performance computing ‘DLX’ cluster at the University of Kentucky [http://www.uky.edu/ukat/hpc]. It was tested on both a basic node (16 cores/node, 64 GB/node of 1600 MHz RAM) and a High-Memory “fat” node (32 cores/node, 512 GB/node of 1600 MHz RAM).
3
Results
All the results are based on the single run 58 depth of coverage input data except the results in Section 3.5, which compares the single run to multiple run data. Both datasets were tested, however some of the tools did not work on the multiple run data; therefore results on the multiple run data are only reported in the comparison in Section 3.5.
3.1
Pipeline Runtime
The efficiency of many of the different steps of the pipeline can be increased using multi-threading. GATK provides three flavors of multi-threading: Data multithreading (NT, at the machine level), CPU multithreading (NCT, at the core level) and scatter-gather (SG, at the cluster level). SG requires GATK queue for internode communication and that was not tested here. Table 1 shows the runtime of each step and the improvement in runtime when using multi-threading. The number of threads used when multi-threading is applicable is given in the rightmost column. RealignerTargetCreator only supports NT, BaseRecalibrator/PrintReads and HaplotypeCaller only support NCT, and UnifiedGenotyper supports both. For the tools that only support one method, tests were done using 1, 2, 4, 8, 16, and 32 threads on both basic and fat nodes. UnifiedGenotyper was tested with a combination of the two parameters and what is reported here is giving 4 threads each for NT and NCT, for a total of 8 threads. The times reported for multi-threading are the best runtimes out of all of the tests using different number of threads on a basic node and the number of threads that gave the best runtime are given in the rightmost column. Two different tools are tested in the variant discovery step and the time is given in the order the tools are listed. Sambamba was also tested for duplicate marking. The run time was greatly reduced because it allowed for multi-threading. However, there were problems with the results when using the larger single run data reported here, so those times are not included. It did successfully run on the multiple run data in which each run is a separate smaller file. The variant calling step has the longest run time. It takes about 33% of the total running time when using HaplotypeCaller with multi-threading. The preprocessing part cost about 65 hours and the VQSR step cost about an hour. The times are not listed here, but all the comparison
methods are less than an hour. Tests were also done on the cluster fat nodes. The results of using more threads on these nodes are not given here because there was little to no increase in efficiency for using these more expensive nodes. It is mentioned further in the discussion.
3.2
UnifiedGenotyper versus HaplotypeCaller
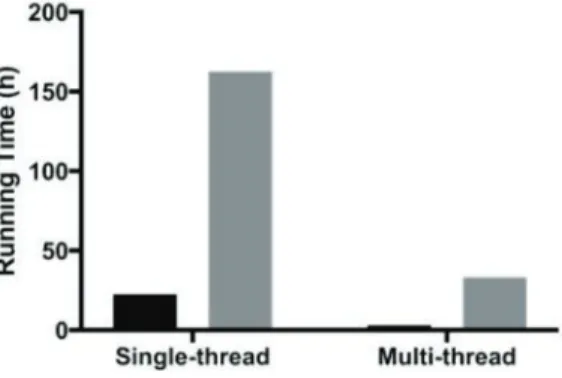
The running times of UnifiedGenotyper and HaplotypeCaller are displayed in Figure 2. UnifiedGenotyper is about 7 times faster than the HaplotypeCaller with UnifiedGenotyper costing about 22.5 hours and HaplotypeCaller costing about 163 hours without multi-threading. Haplotypecaller is better than the UnifiedGenotyper on all three reported metrics of correctness, as seen in Table 2.
Step Tool Running Time (min) threads #
single-thread multi-threads
Mapping Mapping Bwa 7627 566 16
Mark duplicate Sort Picard-SortSam 584 584 * Markdup Picard-MarkDuplicates 447 447 * Buildidx Picard-BuidBamIndex 65 65 * Local re- alignment Create target list GATK-RealignerTargetCreator 450 37 16 Local realignment GATK-IndelRealigner 748 748 ** BQSR Build BQSR model GATK-BaseRecalibrator 1615 505 4 Apply recalibration GATK-PrintReads 2577 970 4 Total-preprocessing 14113 3912 Variant- discovery Variant- Calling GATK-UnifiedGenotyper/ HaplotypeCaller 1352/9750 181/1992 8/32
VQSR VQSR GATK-BaseReacalibrator & PrintReads 59 59 *
Total-Variantdiscovery (UG/HC)
1411/9809 240/2051
Table 1: Running time for ERP001960 comparison between multi-threading and single-threading * Multi-threading is not applicable
** Multi-threading requires GATK-Queue which is not included in these tests
Figure 2: Running time difference on test data ERP001960 between UnifiedGenotyper and HaplotypeCaller
3.3
Results from different tranches
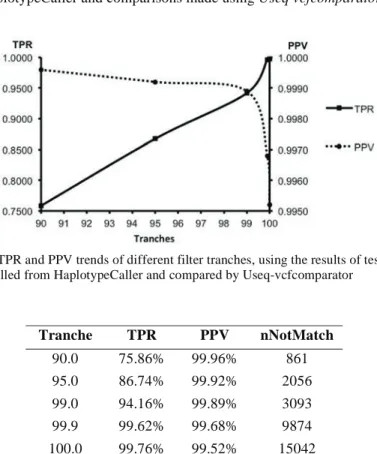
Table 2 and Figure 3 give performance measurements used to evaluate the correctness of the genomic pipeline for different VQSR tranches. From 90.0 to 100.0, the number of records not matched increased, however so did the TPR. On the other hand, the PPV decreased. Based on our results, the 99.9 tranche produced calls with comparable PPV and TPR to the 100 tranche but with the nNotMatch decreased by about 30%. The 99.0 tranche produced a slightly higher PPV than the 99.9 tranche but about 5% lower TPR, with the nNotMatch decreased about 58%. These results were obtained using HaplotypeCaller and comparisons made using Useq vcfcomparator.
3.4
Different comparison tools and high-confident references
The three comparison tools generated comparable results, as seen in Table 3. The VariantEval of GATK gives more metrics but doesn’t produce the intersection VCF file. The RTG vcfeval and the Useq vcfcomparator produce both statistical data and the intersection VCF files. Also shown in Table 3 are the results of using the three different high-confident call sets.
Figure 3: TPR and PPV trends of different filter tranches, using the results of test Data ERP001960 called from HaplotypeCaller and compared by Useq-vcfcomparator
Tranche TPR PPV nNotMatch 90.0 75.86% 99.96% 861 95.0 86.74% 99.92% 2056 99.0 94.16% 99.89% 3093 99.9 99.62% 99.68% 9874 100.0 99.76% 99.52% 15042
Table 2: TPR, PPV and nNotMatch of different filter tranches, using the results of test Data ERP001960 called from HaplotypeCaller and compared by Useq-vcfcomparator
3.5
Single run versus multiple run samples
We compared the results from two data sets. The ERP001960 single run paired end data with the average depth of coverage of 58 and the ERP001229 four run paired end data with the average depth of coverage of 14 each. The results are given in Table 4. The single run dataset has a slightly better PPV and nNotMatch than the multiple run data. However, the TPR of single run data is smaller. Since the input for the multiple run data is in smaller separate files, the pre-processing can all be done in parallel for each run separately and then combined for the variant calling. The analysis using the multiple run data was about 44% of the runtime for the single run data.
4
Discussion
We successfully installed and ran this bioinformatics pipeline on the UK cluster. Multi-threading allows for a large improvement in time-to-completion for the pipeline. Without multithreading the whole pipeline costs about 400 hours when tested on ERP001960 using HaplotypeCaller as the variant calling tool. When using multithreading, the running time in only 25% of the running time for the non-threaded pipeline, only costing 100 hours. The mapping step has the best improvement in terms of threading efficiency with about 13 times speed-up and an overall time savings of about 117 hours. Multi-threading the HaplotypeCaller variant calling step has the best actual time saving of about 129 hours
For pre-processing, Sambamba is much faster than Picard in marking duplicates since Sambamba can enable multi-threading. However, high-memory nodes may be needed for Sambamba if the input data is large, as it is here. HaplotypeCaller, which is the GATK’s recommendation for variant calling, is better than UnifiedGenotyper in results. However, UnifiedGenotyper is about 7 times faster than HaplotypeCaller, which only has about a 1-2% increase in TPR. So UnifiedGenotyper may be a better
GATK Useq RTG TPR% PPV% nNotMatch TPR% PPV% nNotMatch TPR% PPV% nNotMatch
UG vs NIST2.18 93.54 99.74 7028 93.56 99.78 5792 93.60 99.81 5104 HC vs NIST2.18 94.40 99.85 4249 94.48 99.90 2631 94.46 99.86 3852 UG vs NIST2.19 92.81 99.63 10942 92.84 99.69 8887 92.90 99.71 8430 HC vs NIST2.19 94.11 99.81 5601 94.16 99.89 3093 94.14 99.83 5195 UG vs PGv7 87.38 99.61 14330 87.03 99.73 9681 87.31 98.23 65127 HC vs PGv7 89.04 99.58 15603 88.60 99.68 11841 89.07 99.60 14908
Table 3: Results of test data ERP001960 called from UnifiedGenotyper and HaplotypeCaller recalibrated with tranche 99.0 using different comparison tools
ERP001960 (1 run) ERP001229 (4 runs)
TPR% PPV% nNotMatch TPR% PPV% nNotMatch HC vs NIST2.18 94.48 99.90 2631 95.17 99.79 5930 HC vs NIST2.19 94.16 99.89 3093 94.89 99.77 7034
HC vs PGv7 88.60 99.68 11841 89.59 99.55 16903
Table 4: Results from test data ERP001960 and ERP001229 called by HaplotypeCaller and compared by Useq-vcfcomparator
tool if a lot of data needs to be processed and there is less of a concern in recovering every variant possible.
In the VQSR step, our tests show that the TPR increases with higher tranches and PPV decreases. Different tranches can be applied in the VQSR step. For new SNP discovery, the higher TPR can provide more candidate records which more likely contain the new SNPs. However this may provide more false positives. The higher PPV is better for confirming the known SNPs. Thus the study purpose may need to be considered to help making the trade off on tranche selection.
For the variant comparison, Useq-vcfcomparator and RTG-vcfeval can provide the intersection VCF files, which reduce the steps and makes the comparison easier to perform. The high confident call sets tested also have differences. We get slightly better results when comparing the test data to the NIST2.18 high confident call sets than the results of comparing to the NIST 2.19. NIST 2.19 contains more records than NIST 2.18, and PGv7 more records than either of the NIST sets, including more unconfirmed records. It is likely that the smallest set has the most confident calls that are easier to make and therefore it is quite understandable that comparing to this set would generate the highest TPR. However, if the larger sets contain true variants that are harder to detect, this makes them very useful when testing pipelines. Regardless of the comparison results, each high confident call set can help us to improve the pipeline and compare tools. The results from all three high confident call sets showed the same trend when different tranches were applied.
The single run data with a higher depth of coverage has better PPV than the multiple run data. The multiple run data has better TPR. It suggests that the multiple runs is better in new variant discovery while single run is better in confirming existing ones. Each run of the multiple run data can be preprocessed in parallel making the analysis more computational efficient.
Although the fat nodes have larger memory and more cores, the running time on the fat nodes is not significantly better than the running time on basic nodes. Based on our tests, we only get a 1.1 times speed-up in the mapping step. For other steps which support multithreading, the running time is almost the same. The fat nodes are a more expensive investment and typical require a longer waiting time when a cluster only has a few high-memory nodes, as our cluster does. Therefore, we consider the basic nodes to be the better resources to run the pipeline.
5
Conclusions
We tested the GATK best practices pipeline on the University of Kentucky computing cluster. Variant calls made by two GATK variant callers and different tranche parameters were collected. The running times and file sizes were recorded. The variant call sets were compared with high confident call sets using different comparison tools. Results show that multi-threading is helpful to reduce the running time on the cluster and there is little to no benefit of using a high-memory node with a larger CPU count.
The running time of the total pipeline on the HPC cluster is about 100 hours for the single run human genome with depth of coverage 58. The runtime can be improved by using the UnifiedGenotyper for a small decrease in correctness. The input FASTQ file size is about 45GB each, if we need to store the key pre-processed BAM file, which is the BAM file after the BQSR step, and the VCF files, a space of about 150GB is needed per genome. The multiple run data may have less running time since the pre-processing step of each run can be done in parallel. The 64 GB of memory on the basic compute nodes is enough for the tools to process the 45GB size human genome sequencing data except for Sambamba, which requires more memory.
The most important result of this work is setting up the workflow and data needed in order to easily and reproducibly test pipeline variations and be able to quantify not only the efficiency, but also
the correctness of changes to the pipeline. Automated script to run the pipeline can be found at https://github.com/sallyrose0425/GATKBP.
Acknowledgements
We would like to thank the University of Kentucky Information Technology department and Center for Computational Sciences for computing time on the DLX High Performance Computing Cluster and for access to other supercomputing resources. This work was supported by the National Institutes of Health (NIH) National Center for Advancing Translational Science grant KL2TR000116
References
"GATK Best Practices " Retrieved December 17, 2015, from https://www.broadinstitute.org/gatk/guide/best-practices.
Collins, F. S. and M. A. Hamburg (2013). "First FDA authorization for next-generation sequencer." New England Journal of Medicine 369(25): 2369-2371.
Consortium (2015). "A global reference for human genetic variation." Nature 526(7571): 68-74. Consortium (2010). "Integrating common and rare genetic variation in diverse human populations." Nature 467(7311): 52-58.
Gibbs, R. A., J. W. Belmont, P. Hardenbol, T. D. Willis, F. Yu, H. Yang, L.-Y. Ch'ang, W. Huang, B. Liu and Y. Shen (2003). "The international HapMap project." Nature 426(6968): 789-796.
Lam, H. Y., M. J. Clark, R. Chen, R. Chen, G. Natsoulis, M. O'Huallachain, F. E. Dewey, L. Habegger, E. A. Ashley and M. B. Gerstein (2012). "Performance comparison of whole-genome sequencing platforms." Nature biotechnology 30(1): 78-82.
O’Rawe, J., T. Jiang, G. Sun, Y. Wu, W. Wang, J. Hu, P. Bodily, L. Tian, H. Hakonarson and W. E. Johnson (2013). "Low concordance of multiple variant-calling pipelines: practical implications for exome and genome sequencing." Genome Med 5(3): 28.
Rieber, N., M. Zapatka, B. Lasitschka, D. Jones, P. Northcott, B. Hutter, N. Jäger, M. Kool, M. Taylor and P. Lichter (2013). "Coverage bias and sensitivity of variant calling for four whole-genome sequencing technologies." PloS one 8(6): e66621.
Sherry, S. T., M.-H. Ward, M. Kholodov, J. Baker, L. Phan, E. M. Smigielski and K. Sirotkin (2001). "dbSNP: the NCBI database of genetic variation." Nucleic acids research 29(1): 308-311.
Tan, A., G. R. Abecasis and H. M. Kang (2015). "Unified representation of genetic variants." Bioinformatics: btv112.
Zook, J. M., B. Chapman, J. Wang, D. Mittelman, O. Hofmann, W. Hide and M. Salit (2014). "Integrating human sequence data sets provides a resource of benchmark SNP and indel genotype calls." Nature biotechnology.