arXiv:1102.1588v2 [astro-ph.IM] 22 Feb 2011
c
SAIt 2008 Memoriedella
VST processing facility: first astronomical
applications
A. Grado,
1M. Capaccioli,
2,3L. Limatola
1and F. Getman
11 Istituto Nazionale di Astrofisica – Osservatorio Astronomico di Capodimonte, Via Moiariello, 16, 80131, Napoli, Italy e-mail:[email protected]
2 Universit´a Degli Studi Federico II – Complesso Monte Sant’Angelo Napoli, Italy 3 MECENAS, Universit´a di Napoli Federico II and Universit´a di Bari, Italy
Abstract.VST–Tube is a new software package designed to process optical astronomical images. It is an automated pipeline to go from the raw exposures to fully calibrated co-added images, and to extract catalogs with aperture and PSF photometry. A set of tools allow the data administration and the quality check of the intermediate and final products. VST-Tube comes with a Graphical User Interface to facilitate the interaction between data and user. We outline here the VST–Tube architecture and show some applications enlightening some of the characteristics of the pipeline.
Key words.Image Processing, Astronomical Techniques, Astrophysical Data
1. Introduction
Several pipelines have been developed in the last years to process astronomical images. Most of them are tailored to specific instru-ments; others are more flexible and can be applied to a variety of instruments. A non– exhaustive list includes the SDSS pipeline (Lupton, Gunn, Ivezi´c & Knapp 2001), CASU (Irwin 2004), Astrowise (Valentijn 2006), EIS (Hook, Arnouts, Benoist & da Costa, 2001), TERAPIX (Bertin 2002), Theli
(Schmithuesen, Thomas, Trachternach, Bomans, & Schirmer 2007), MegaPipe (Gwyn 2009), NEWFIRM
(Swaters, Valdes & Dickinson 2009),
QUEST (Andrews 2008), Pan-STARRS
(Magnier et al. 2005), SUBARU (Ogasawara 2003), MACHO (Axelrod 1998).
Send offprint requests to: A. Grado
Here we present a new software pack-age called VST–Tube, developed to process raw astronomical images (typically in the optical bands) and to make them suitable for scientific exploitation. It has been con-ceived (but is not restricted) to process mo-saicised images such as those that will be produced by OmegaCam, the imaging cam-era of the VLT Survey Telescope (VST) (Capaccioli, Mancini & Sedmak 2005). The VST–Tube pipeline allows automatic process-ing (from the raw frames to a stacked image, astrometrically and photometrically calibrated) of a set of exposures distributed in one or more observing nights, limiting the user intervention to the pipeline configuration and to the data preparation stages. A series of LOG files keep track of the various input parameters and of the configuration, so to allow reproducible results.
VST–Tube can run on a normal laptop as well as in a distributed processing environ-ment such as a Beowulf cluster (more eff ec-tive for mosaicised exposures). It comes with a graphical user interface (VST-GUI) to sim-plify the usage and the access to intermediate and final results, and to all the quality con-trol checks done during the processing, off er-ing an intuitive approach through the menu bar at the window top. Some additional tools are already available to analyze the raw data and the pipeline results. In order to make the ap-proach even simpler, a series of balloons and messages pops appear at pointing the mouse on almost the totality of the widget windows.
In this paper we describe the software ar-chitecture and show three examples of success-fully processed images which enlighten the characteristics of VST-Tube.
2. VST–Tube pipeline: general description
VST–Tube has been designed to process ho-mogenous sets of astronomical exposures, that is sets of images taken with the same instru-ment and instruinstru-mental setup, but under diff er-ent night sky conditions. The input data are the science and calibration exposures acquired with a single or a multi-chip optical camera, the instrument and the pipeline configuration files, and a certain number of options to be chosen at the beginning in order to define the processing strategy. The output are co-added images where the instrumental effects have been removed. The latter include overscan and bias correction, flat-field correction, CCDs mo-saic gain harmonization, fringing pattern re-moval (where applicable), illumination correc-tion, relative and absolute astrometric and pho-tometric calibrations. Weight and flag maps, including cosmic ray traces, are also produced. Eventually, a catalog of sources with aperture and PSF photometry can be automatically ex-tracted.
The VST–Tube pipeline is configured through a Graphical User Interface (GUI). Written in PYTHON, it uses C libraries for Fits files manipulation and external packages for calibration and quality assessment. Just the
GUI and the pipeline Python codes, exclud-ing external packages and libraries, consist of about 60,000 lines of code.
VST–Tube has been conceived as a general purpose pipeline, i.e. applicable to various tele-scopes and to rather different science cases. In fact, the characteristics of VST–Tube are not only speed and reliability but also versatility in either treating different problems or in eas-ily integrating user provided special subrou-tines. It has been designed to satisfy the gen-eral requirements of producing catalogs of as-tronomical sources with point–source broad– band photometry with an absolute precision of ∼ 3% and a relative precision of ∼ 1% for repeated observations. The absolute astromet-ric accuracy is limited by that of the refer-ence catalog (typically∼0.3 arcsec), while the
relative accuracy for repeated observations is ∼ 0.03 arcsec. It must be clear that the level
of accuracy in the final calibration depends on the characteristics of the science and calibra-tion files.
The following is a short account of how VST–Tube works. Details on the structure and on the recipes will be reported in forthcoming papers.
2.1. VST–Tube in action
VST–Tube pipeline allows the user to cre-ate his own reduction strcre-ategy. Combining a number of parameters and reduction settings, the pipeline can be configured to meet the user needs and scopes. In a typical session, the human intervention, all made through the GUI, consists in loading the instrument and the pipeline configuration files, selecting all the images of a given target that we want to reduce (in a given filter but not necessarily in just one observing night), choosing the method to pro-duce the master calibration files (there are sev-eral options depending on the set of available data), selecting the kind of output we want to obtain (for example, the creation of a single fi-nal mosaic or of a mosaic for each exposure), and then switching on the reduction.
The data input of the pipeline, properly pre-pared (see later), are indicated as the Object. The name Object is both used to designate the
target and the tree directories created in the preparation phase, logging and archiving the intermediate and final products of the reduc-tion process.
Let us assume that the images we want to process come from a mosaicised instrument. In the zero–th step the data, in Multi-Extention Fits (MEF) format, are prepared to be pro-cessed. A Fits header analyzer, according to the instrument configuration parameters, cata-logues the files and puts them in lists that iden-tify the type of image. For each night and fil-ter, the raw data will be classified in Bias, Flat, Dome, Dark, Standard, Science. A directory tree structure is created which contains the im-ages, already transformed in Single-Extention-Fits (SEF), and all the intermediate and fi-nal pipeline products. A series of quality con-trol checks are carried out on the images in order to reject those which do not satisfy a priori requirements. At this stage malformed Fits header keywords, where applicable, are fixed, and the World Coordinate System key-word values corrected in case of an inaccu-rate telescope pointing model. Quite often it happens that a header keyword, even for the same instrument, keeps changing during the in-strument life. It is possible to define aliases in the instrument configuration file for some of the main keywords in order to identify univo-cally that keyword. Other simple checks, such as exposure time and median pixel value level, are checked against the allowed range defined in the instrument configuration file. After this preparatory phase the images can be processed. All of the pipeline products belonging to one run are identified through a RUN-ID, which is the time when the processing started. This string is added to the names of all the pipeline products to easily identify them even without the help of the GUI.
While drawing the main characteristics of our pipeline, we decided to use public domain software whenever possible. We also adopted SVN (see http://subversion.apache.org/) as a source code manager. The software is devel-oped for the UNIX environment. Another early decision was to have a pipeline working with-out a database (DB). The input data, and inter-mediate and final products, are distributed in
an intuitive directory tree, so that, even without the pipeline GUI, it is easy to mine the filesys-tem for some particular result.
The present tree structure was reached af-ter a long improving process. We decided to avoid the DBs to make our pipeline as simple as possible (also from an administrative point of view) and flexible enough to allow software modifications and changes of the data process-ing model while remainprocess-ing consistent with the previous SW versions.
3. Science verification
VST–Tube was developed as multi-instrument pipeline and tested on a wide range of science cases. In this Section we present some exam-ples, either published or still in preparation, pointing out the peculiarities of each case and the quality of the final results.
3.1. CFHT12K F14 field
We used VST–Tube to reduce a very difficult set of early 4 deg2CFHT12k images
(VVDS-14h field (Garilli 2008), (McCracken et al. 2003)): very sparse (distributed over 51 nights), with few calibration data, with two CCDs (no. 0,6) of the mosaic which had to be excluded (the pipeline was modified to han-dle mosaics with unequal number of CCDs), with small offsets in the dithering for both the science images and the calibration data (mak-ing it difficult to remove objects), with al-most no overlap in neighboring pointings, very strong patterns in the raw images, many non– photometric nights, and many corrupted head-ers or incomplete information.
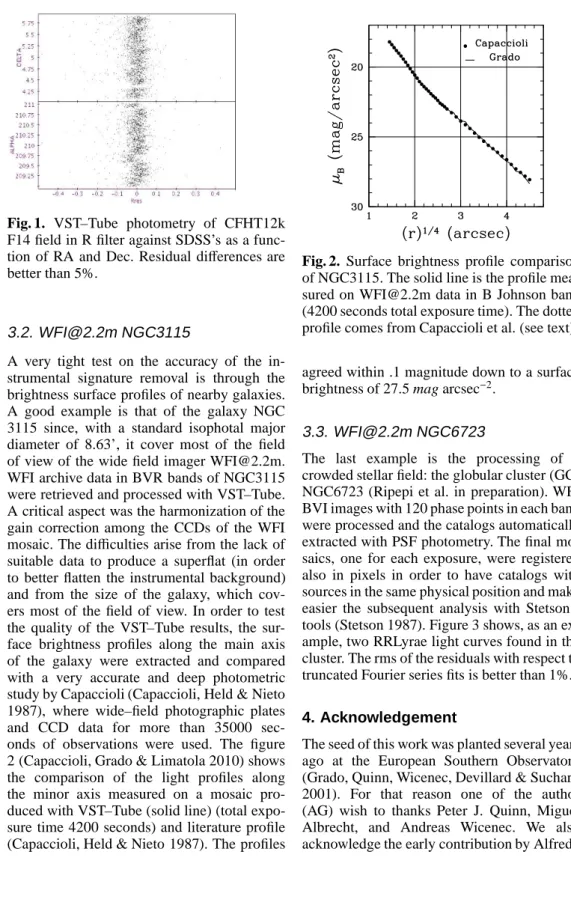
In spite of the difficulties, the images where successfully processed and calibrated, and the results published (Lamareille et al. 2009). To verify the photometric accuracy, we made a comparison with SDSS observations of the same field. Figure 1 shows the magnitude residuals against SSDS’s as function of Right Ascension and Declination. The standard devi-ation is better than 0.05 mag in the R band.
Fig. 1. VST–Tube photometry of CFHT12k F14 field in R filter against SDSS’s as a func-tion of RA and Dec. Residual differences are better than 5%.
3.2. [email protected] NGC3115
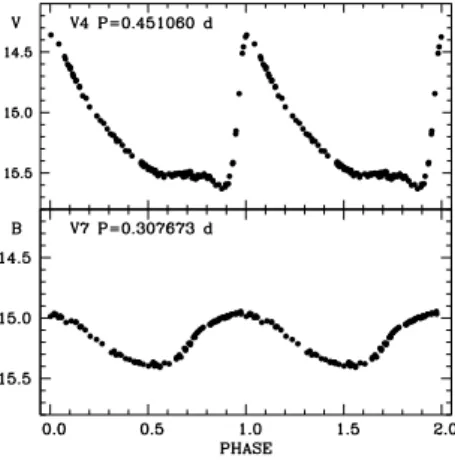
A very tight test on the accuracy of the in-strumental signature removal is through the brightness surface profiles of nearby galaxies. A good example is that of the galaxy NGC 3115 since, with a standard isophotal major diameter of 8.63’, it cover most of the field of view of the wide field imager [email protected]. WFI archive data in BVR bands of NGC3115 were retrieved and processed with VST–Tube. A critical aspect was the harmonization of the gain correction among the CCDs of the WFI mosaic. The difficulties arise from the lack of suitable data to produce a superflat (in order to better flatten the instrumental background) and from the size of the galaxy, which cov-ers most of the field of view. In order to test the quality of the VST–Tube results, the sur-face brightness profiles along the main axis of the galaxy were extracted and compared with a very accurate and deep photometric study by Capaccioli (Capaccioli, Held & Nieto 1987), where wide–field photographic plates and CCD data for more than 35000 sec-onds of observations were used. The figure 2 (Capaccioli, Grado & Limatola 2010) shows the comparison of the light profiles along the minor axis measured on a mosaic pro-duced with VST–Tube (solid line) (total expo-sure time 4200 seconds) and literature profile (Capaccioli, Held & Nieto 1987). The profiles
Fig. 2. Surface brightness profile comparison of NGC3115. The solid line is the profile mea-sured on [email protected] data in B Johnson band (4200 seconds total exposure time). The dotted profile comes from Capaccioli et al. (see text)
agreed within .1 magnitude down to a surface brightness of 27.5 mag arcsec−2.
3.3. [email protected] NGC6723
The last example is the processing of a crowded stellar field: the globular cluster (GC) NGC6723 (Ripepi et al. in preparation). WFI BVI images with 120 phase points in each band were processed and the catalogs automatically extracted with PSF photometry. The final mo-saics, one for each exposure, were registered also in pixels in order to have catalogs with sources in the same physical position and make easier the subsequent analysis with Stetson’s tools (Stetson 1987). Figure 3 shows, as an ex-ample, two RRLyrae light curves found in the cluster. The rms of the residuals with respect to truncated Fourier series fits is better than 1%. 4. Acknowledgement
The seed of this work was planted several years ago at the European Southern Observatory (Grado, Quinn, Wicenec, Devillard & Suchar 2001). For that reason one of the author (AG) wish to thanks Peter J. Quinn, Miguel Albrecht, and Andreas Wicenec. We also acknowledge the early contribution by Alfredo
Fig. 3. VST–Tube processing of the globu-lar cluster NGC6723. Light curves of two RRLyrae in the field.
Volpicelli and Massimiliano Desiderio. We thank the Terapix group for providing QualityFits, Simone Zaggia for useful discus-sions and for providing the PSF photometry pipeline. Thanks to Mario Radovich for providing Photcal (the tool for the absolute photometric calibration) and to Mike Pavlov for the useful suggestions and discussions. This work has been partially funded by the Regione Campania and by the Banco Napoli – Fondazione, for which we thank the President, prof. A. Giannola.
References
Andersen, M. I.; Freyhammer, L.; Storm, J., 1995, ESO Conference and Workshop Proceedings, Proceedings of an ESO/ ST-ECF workshop on calibrating and under-standing HST and ESO instruments, 25-28 April 1995, Garching, Germany, p.87 Andrews, P.A. 2008, PASP, 120, 703
Capaccioli, M., Mancini, D., Sedmak, G., 2005, The VLT Survey Telescope: A Status Report, The Messanger, N. 120, p10 Axelrod, T. S.; Allsman, R. A.; Quinn, P. J.
et al, 1998, MACHO Data Pipeline, Proc. SPIE Vol. 3349, p. 152-164, Observatory Operations to Optimize Scientific Return, Peter J. Quinn
Baade, D. 2000, Wide Field Imager User Manual Doc. No. LSO-MAN-ESO-22100-00001
Bertin, E., Arnouts,S., 1996, å, 117, 393 Bertin et al. 2002, ASP Conference Series,
281, 228
Bertin, E., 2006, ASP Conference Series, 351, 112
Capaccioli, M.; Held, E. V.; Nieto, J., 1987, Two-dimensional photographic and CCD photometry of the S0 galaxy NGC 3115, AJ, 94, 1519
Capaccioli, M., Grado, A., Limatola, L., 2010, Photometry of nearby galaxies, (in prepara-tion).
Devillard, N. 1997, The ESO Messenger No 87 Devillard, N., 2001, ASPC, 238, 525
Garilli, B., Le Fevre, O., Guzzo, L., et al. 2008, A&A, 486, 683
Grado, A., Quinn, P., Wicenec, A., Devillard, N., Suchar, D. 2001, The New Era of Wide Field Astronomy, ASP Conference Series, Vol. 232. Edited by Roger Clowes, Andrew Adamson, and Gordon Bromage. San Francisco: Astronomical Society of the Pacific., p.303
Grado, A., Pavlov. M., Limatola, L., 2007, The 2007 ESO Instrument Calibration Workshop, 23-26 January Garching, Germany, A. Kaufer, F. Kerber ,Springer, 217
Gwyn, S. D. J., arXiv:0904.2568v1
Hastie, T. J. and Tibshirani, R. J. (1990). Generalized Additive Models. Chapman & Hall
Hook, R., Arnouts, S., Benoist, C., da Costa, L. 2001, aspc, 238, 283
Irwin, Mike J.; Lewis, Jim; Hodgkin, Simon; Bunclark, et. al, 2004, VISTA data flow sys-tem: pipeline processing for WFCAM and VISTA, Proceedings of the SPIE, Vol. 5493, 411
Lamareille, F. et al., 2009, Physical proper-ties of galaxies and their evolution in the VIMOS VLT Deep Survey. I. The evolution of the mass-metallicity relation up to z 0.9; A&A, 495, 53
Lupton, R., Gunn, J.E., Ivezi´c, ˇZ. & Knapp, R. 2001, ADAS, 238, 269
McCracken et al. 2003, A&A, 410, 17 Marmo, C. & Bertin, E. 2008, ASP
Conference Series, Vol. 394, J. Lewis, R. Argyle, P. Bunclarck, D. Evans, and E. Gonzales-Solares, eds., 619
Ogasawara, R. et al., 2003, ASP Conference Series, 295, 142
Ridge, D. 1997, in IEEE Aerospace Conf. Proc. Vol. 2, 79
Selman, Fernando J., 2004, Optimizing Scientific Return for Astronomy through Information Technologies. Edited by Quinn, Peter J.; Bridger, Alan, SPIE, 5493, 453 Schmithuesen. O., Thomas, E., Trachternach,
C., Bomans, D.J. & Schirmer, M. 2007, AN 328, 701
Sterling, T.L. 1999, How to Build a Beowulf, Mit Press.
Stetson, Peter B., 1987, DAOPHOT - A com-puter program for crowded-field stellar pho-tometry, PASP, 99, 191
Swaters, R. A., Valdes, F. & Dickinson, M.E. 2009, arXiv:0902.1458v1
Valentijn et al. ADASS XVI ASP Conference Series, 2006, R. Shaw, F. Hill and D. Bell, eds