LOD Map - A Visual Interface for Navigating
Multiresolution Volume Visualization
Chaoli Wang,Student Member, IEEE, and Han-Wei Shen
Abstract—In multiresolution volume visualization, a visual representation of level-of-detail (LOD) quality is important for us to exam-ine, compare, and validate different LOD selection algorithms. While traditional methods rely on ultimate images for quality measure-ment, we introduce theLOD map- an alternative representation of LOD quality and a visual interface for navigating multiresolution data exploration. Our measure for LOD quality is based on the formulation of entropy from information theory. The measure takes into account the distortion and contribution of multiresolution data blocks. A LOD map is generated through the mapping of key LOD ingredients to a treemap representation. The ordered treemap layout is used for relative stable update of the LOD map when the view or LOD changes. This visual interface not only indicates the quality of LODs in an intuitive way, but also provides immediate suggestions for possible LOD improvement through visually-striking features. It also allows us to compare different views and perform rendering budget control. A set of interactive techniques is proposed to make the LOD adjustment a simple and easy task. We demonstrate the effectiveness and efficiency of our approach on large scientific and medical data sets.
Index Terms—LOD map, knowledge representation, perceptual reasoning, multiresolution rendering, large volume visualization.
F
1 INTRODUCTION
The field of visualization is concerned with the creation of images from data. In many cases these images are observed by humans in an effort to test hypotheses and discover insights. Visualization is, there-fore, an iterative and exploratory process. Human-computer interac-tions, such as parameter tweaking, are often involved in a bid to create better representations. This scenario works well for small data. With the advances in graphics hardware, the interactivity can be guaranteed even with a straightforward implementation. For larger data, the re-sponse time of a visualization system could become uncomfortably long. Slower responses result in an increase in time needed to obtain insights from the data. This poses a great challenge for visualization to beeffectiveandefficient[22].
In this paper, we focus on the subject of multiresolution render-ing in the context of large volume visualization. A central theme for multiresolution volume rendering is the selection of data resolution, orlevel-of-detail (LOD). Quite often, such LODs are automatically determined by user-specified error tolerances and viewing parameters [27, 10, 5]. Many of the metrics, such as mean square error (MSE) and signal-to-noise ratio (SNR), are data-centric in the sense that they measure the distortion between low and high resolution blocks in the data space (Geometric error metrics, on the other hand, are often used in surface rendering, where the geometry or mesh is known. In this paper, we do not consider this case.). Although those metrics have specific meanings and are simple to compute, they are not effective in predicting the quality of rendered images due to the lack of corre-lation between data and image [25]. In fact, finding the best LOD is a NP-complete optimization problem [3], so most algorithms take a greedy approximation strategy instead. In this case, data blocks are selected according to their priority values till certain constraints, such as the block budget, are met. Rarely, we have a mechanism to examine the quality of LODs from those greedy selections, and decide whether it is possible to further improve the quality through either automatic methods or user interactions.
Another important but non-trivial issue is the validation of existing
• C. Wang and H.-W. Shen are with the Department of Computer Science and Engineering, The Ohio State University, 395 Dreese Laboratories, 2015 Neil Avenue, Columbus, OH 43210.
E-mail:{wangcha, hwshen}@cse.ohio-state.edu.
Manuscript received 31 March 2006; accepted 1 August 2006; posted online 6 November 2006.
For information on obtaining reprints of this article, please send e-mail to: [email protected].
LOD selection algorithms. In computer graphics and visualization, validation is usually done through side-by-side comparison of images created from different techniques. However, it may not be effective for multiresolution volume visualization. This is because direct rendering of 3D volumes to 2D images involves light attenuation, blending, and transfer function mapping, where much information about a LOD may be hidden or lost. Without the complete information, it could be in-sufficient to assess the improvements of new algorithms over existing ones. Moreover, a large data set is often too complex to be understood from a single image. Inspecting images from different views requires rendering large amount of data, which makes it very difficult for us to perform the validation efficiently.
From the problems mentioned above, it can be seen that there is a great need to devise techniques for multiresolution volume visualiza-tion that allow the user to examine, compare, and validate the quality of LOD selection and rendering. To fulfill this need, we present a new measure for LOD quality based on the formulation of entropy from information theory. Our quality measure takes into account the quality of each individual data block in a LOD and the relationships among them. This entropy measure allows us to map key ingredients of the LOD quality to a treemap representation [17], called theLOD map, for further visual analysis. The LOD map brings us a novel approach for navigating the exploration of large multiresolution data. By “nav-igating”, we mean the user is guided with immediate visual feedback when making decisions aboutwhere to go, what to do, andwhen to stop. The user is provided with cues that leads her quickly to inter-esting parts of the data. She would readily know what actions to take to adjust the LOD, clearly see the gain or loss of the adjustment, and be informed when the refinement process may be stopped. Leveraging a heuristic optimization algorithm and a set of interactive techniques designed for the LOD map, making LOD adjustment and rendering budget control becomes a simple and easy task. Experimental results on large data sets demonstrate that this visual representation of LOD quality is light-weighted yet quite effective for interactive LOD com-parison and validation.
2 RELATEDWORK
The past few years witnessed the rapid growth of data. Scientific sim-ulations are producing petabytes of data as opposed to gigabytes or terabytes a couple of years ago. Building a multiresolution data hier-archy from large amount of data allows us to visualize data at different scales, and balance image quality and computation speed. Examples of hierarchical data representation for volume data include the Lapla-cian pyramid[4], multi-dimensional trees [27], and octree-based hier-archies [10]. Muraki introduced the use of wavelet transforms for
vol-umetric data [16]. Westermann [26] proposed a framework for approx-imating the volume rendering integral using multiresolution spaces and wavelet projections. Guthe et al. [5] presented a wavelet-encoded hierarchical representation, called thewavelet tree, that supports inter-active walkthroughs of large data sets on a single commodity PC. In this paper, we use the wavelet tree as an illustration for our presenta-tion.
The goal of visual data exploration is to facilitate the extraction of new insights from the data. For instance, Marks et al. [14] presented theDesign Gallerysystem that treats image and volume rendering as a process of exploring a multidimensional parameter space. Using an image difference metric, the system arranges renderings from various parameter settings, from which the user selects the most appealing one. Bajaj et al. [1] introduced thecontour spectrum, a user inter-face component that improves qualitative user interaction and provides real-time exact qualification in the visualization of isocontours. A set of well-designed manipulation widgets for multidimensional transfer function design was given by Kniss et al. [9]. By allowing direct in-teraction in the spatial and transfer function domains, those widgets make finding transfer functions an intuitive and efficient process.
On the other hand, the process of visual data exploration contains a wealth of information - parameters, results, history, as well as relation-ships among them. To learn lessons and share experiences, the process itself can be stored, tracked, and analyzed. It can also be incorporated into, and thus becomes a part of the user interface of a visualization system. Such examples areimage graphs[13], and interfaces with spreadsheet [6] and parallel coordinate [21] styles. A general model of the visualization exploration process was formalized by Jankun-Kelly et al. [7].
Over the last decade, a number of information visualization tech-niques have been developed to support the visual exploration of large and high-dimensional data sets [8]. Parallel coordinates and treemaps are two most widely-used techniques among them. Thetreemap[17] is a space-filling method for visualizing large hierarchical information. It works by recursively subdividing a given display area based on the hierarchical structure, and alternating between vertical and horizon-tal subdivisions. The information of an individual node is presented via visual attributes, such as color and size, of its bounding rectangle. Originally designed to visualize files on a hard drive, treemaps have been applied to a wide variety of domains [19].
One of the notable commercial applications of treemaps is the SmartMoney “Map of the Market”, a simple yet powerful tool for the general public to spot investment trends and opportunities. The map shows approximately600publicly traded companies grouped by sec-tor and industry. The size of each company in the map corresponds to its market capitalization. The color mapping is natural for most users to look for visually-striking features: green for gain, red for loss, and dark for neutral. A recursive algorithm was devised to reduces over-all aspect ratios of the rectangles for more readable display. All these factors contributes the success of the Map of the Market. Inspired by this application, we strive for simplicity and effectiveness in search of our solution for navigating multiresolution data exploration.
3 LOD ANALYSIS
In the visualization of multiresolution volume data, a given LOD con-sists of a sequence of data blocks at various resolutions. Intuitively, the LOD quality can be analyzed by investigating the quality of each individual block as well as the relationships among them: Each block may contain a differentdistortionbecause of the resolution and data variation. It may also convey a different optical content if a color and opacity transfer function is applied. Furthermore, the sequence of data blocks are rendered to the screen. Each block may have a different
contributionto the image depending on its projection and how much it is occluded by other blocks. To optimize the total information received on the image, one may attempt to either adjust the LOD or change the view. The concept ofentropyfrom information theory provides us a way to measure the LOD quality in a quantitative manner.
3.1 Entropy
In information theory, the entropy gives the average information or the uncertainty of a random variable. The Shannon entropy of a discrete random variableX with values in the finite set{a1, a2, ...,aM}is
defined as: H(X) =− M X i=1 pilogpi (1)
wherepiis the probability of a variable to have the valueai;−logpi
represents its associated information. The unit of information is call abit. The logarithm is taken in base2ore. For continuity, variable
of probability zero does not contribute to the entropy, i.e.,0 log 0 = 0. The entropy achieves its maximum oflogM when the probability distribution is uniform.
To evaluate the quality of a LOD, we first define the probability of a multiresolution data blockbias:
pi= Ci · Di S , whereS= M X i=1 Ci · Di (2)
whereCiandDiare the contribution and distortion ofbirespectively
(more details about these two terms are given in Section 3.2);M is the total number of blocks in the multiresolution data hierarchy. The summationS is taken over all data blocks, and the division byS is required to make all probabilities add up to unity. Eqn. 2 states that the probability of a data block in a LOD is high if it has large distortion and high contribution. The entropy of a LOD then follows the definition in Eqn. 1.
Note that for any LOD, it is impossible for all the data blocks in the hierarchy to have the equal probability of1/M, i.e., a LOD could not achieve an entropy value oflogM. This is because in any LOD, if a parent block is selected, then none of its descendant blocks will be selected. Any block which is not included in the LOD receives zero probability and does not contribute to the entropy. Ideally, since a higher entropy indicates a better LOD quality, the best LOD (with the highest information content) could be achieved when we select all the leaf nodes in the data hierarchy. However, this requires rendering the volume data at the original resolution, and defeats the purpose of multiresolution rendering.
In practice, a meaningful goal is to find the best LOD under some rendering budget, such as a certain block budget, which is usually much smaller thanM. Accordingly, the quality of a LOD could be improved by splitting data blocks with large distortion and high tribution, and joining those blocks with small distortion and low con-tribution. The split operation aims at increasing the entropy with a more balanced probability distribution. The join operation is to offset the increase in block number and keep it under the budget. In addi-tion, adjusting the view could improve the quality of LOD too, since the contributions of data blocks vary when the view changes.
3.2 Distortion and Contribution
In a multiresolution data hierarchy such as a wavelet tree, a block hav-ing larger distortion or variation is more likely to receive a higher pri-ority for LOD refinement. The distortion of a multiresolution data block captures this intrinsic property. Let us first consider two data blocksbiandbj, wherebjis an immediate child ofbi. We define the
distortion betweenbiandbjas follows:
dij=σij · µ2 i +µ 2 j+C1 2µiµj+C1 · σ 2 i +σ 2 j+C2 2σiσj+C2 (3) whereσijis the covariance betweenbiandbj;µiandµjare the mean
values ofbiandbjrespectively;σiandσj are their standard
devia-tions. We include small constantsC1andC2to avoid instability when
µiµjandσiσjare very close to zero.
Eqn. 3 consists of three parts, namely,covariance,luminance dis-tortion, andcontrast distortion. Collectively, these three parts capture the distortion between the two blocks. The luminance distortion and
contrast distortion are originally from the image quality assessment lit-erature [25], and have been shown to be consistent with the luminance masking and contrast masking features in the human visual system respectively.
In a wavelet tree, a parent node has eight immediate children. Thus, we add distortions between the parent block and its eight child blocks. We also take into account the maximum distortion of the child blocks, as an approximation of the distortion between the parent block and the original full-resolution data it represents. Written in equation:
Di= 7 X j=0 dij+ max{Dj| 7 j=0} (4)
whereDiandDjare the distortions of blocksbiandbjrespectively.
As a special case, ifbiis associated with a leaf node in the hierarchy,
we defineDi=C3, whereC3is a small constant. The distortion for
each tree node can be calculated as we build up the multiresolution data hierarchy. They are then normalized for our use.
To evaluate the contribution of a multiresolution blockbito the
im-age, we treat the coarse-grained data block as a whole and approximate its contribution as follows:
Ci=µ · t · a · ν (5)
whereµis the mean value ofbi;tis its thickness (the average length
of the viewing ray segment insidebi);ais the screen projection area
of the block, andν is its estimated visibility. Here, similar to the well-known composition equation [12],(µ · t · a)approximates the
emission ofbi, andνaccounts for the occlusion.
Depending on our need,µ,σ, andσijin Eqn. 3 and 5 can be
eval-uated directly in the scalar data space, or in the perceptually-adapted CIELUV color space (see [23] for more detail). In Section 7.2, we will describe our pre-computation and real-time update techniques for cal-culatingDandCof multiresolution data blocks, which ensure a quick update of the entropy value for a LOD.
3.3 Heuristic Algorithm
Based on the entropy measure, we propose a three-stage heuristic algo-rithm to adjust a LOD automatically. The given LOD could come from any LOD selection methods. The motivation is to balance the proba-bility distribution among all data blocks in the LOD, and improve its entropy. Our three-stage algorithm is as follows:
1. Join: Locate the data blockblwith the lowest probability. Check
if joiningblwith its siblings would decrease the entropy or not.
If not, joinblwith its siblings. Otherwise, markblout. This
process then repeats on all unmarked data blocks until all blocks are scanned. The first stage would potentially free some block budget for use in the second stage.
2. Split: Locate the data blockbh with the highest probability.
Check if splittingbhwould increase the entropy or not. If yes,
splitbh. Otherwise, markbhout. This process then repeats on
all unmarked data blocks until either the block budget is met or all blocks are scanned.
3. Join-Split: Consider a pair of data blocks (bl,bh) in the LOD,
whereblis the block with the lowest probability, andbhis the
block with the highest probability. Check if joiningblwith its
siblings and splittingbhwould increase the entropy or not. If
yes, joinblwith its siblings and splitbh. Otherwise, mark the
pair (bl,bh) out. This process then repeats on all unmarked pairs
until all pairs are scanned.
Note that join or split operations in our algorithm will only increase the entropy, if possible, but never decrease. This monotonic condition guarantees the convergence of the algorithm. Our heuristic algorithm could also be used to generate a balanced LOD (in terms of probabil-ity distribution) given the constraint of block budget. The algorithm refines the LOD starting from the root of the data hierarchy until the block budget is met.
4 LOD MAP
Although various efforts have been made to choose proper LODs that condense data and preserve features [28, 10, 5], little work has been done to represent and validate this decision-making process. Actually, the information derived for data selection isknowledgethat guides the user through the entire solution space. Such knowledge saves time on decision and computation, which the user would have otherwise spent on a trial-and-error search. The time saved may be used to improve frame rates or alternatively, on other techniques to better understand the data.
The formulation of LOD quality in Section 3 tells us that a LOD is good if it has a high entropy value. Thus, a good LOD not only indicates a good quality of rendered images, but also a balanced prob-ability distribution for all the data blocks in the LOD. This includes information of both what we can perceive (data blocks not occluded) and can not (data blocks occluded) from the rendered image. There-fore, a suitable visual representation for LOD quality should reveal not only what is visible, but also what is not. Such information is impor-tant because it can help us answer questions such as “do we waste the budget on those blocks which are occluded?”, or, “can we generate an image of similar quality with a reduced block budget?”. In order to avoid possible occlusion, we rule out the option of any 3D representa-tion of LODs. Actually, a 2D treemap provides a simple yet effective representation of large hierarchical structure. The key issues involved in this knowledge representation are information mapping and layout design.
4.1 Information Mapping
In this paper, we call the treemap representation of LOD theLOD map. As a treemap, the LOD map is formed by recursively subdividing a given area. Each data block in the LOD is represented as a rectangle in the LOD map. Treemaps can effectively visualize data with two attributes, in which one attribute is typically mapped to the size of the rectangles, and the other attribute to the color of the rectangles. The critical question to ask is what information should be displayed in the generated rectangles for the LOD map.
Since the treemaps are commonly used for representing hierarchical structures. A first thought along this direction could lead us to use the size of rectangle to encode the resolution of different data blocks in the LOD map. As in [24], the size of the rectangle can be determined by the level of the data hierarchy the data block lies on. Although this way of representing LODs is natural, the mapping only yields limited usefulness. This is because which level of the hierarchy a data block lies on may not give hints on its actual quality. A data block at a low level (low resolution) may contain empty space or have a uniform value. In contrast, another data block at a high level (high resolution) may still exhibit much variation or distortion. Therefore, this kind of coding does not grant insights, and wastes important channels which could be used to encode more essential LOD information.
The entropy characterizes the quality of a LOD. To reveal this key information, we map its ingredients, i.e., the distortionDand
contribu-tionCof a data block in the LOD, to the color and size of its bounding
rectangle in the LOD map. More specifically:
• The color assignment is based on the distortionD: red for large distortion, magenta for medium, and blue for small.
• The contributionCis split into two parts:(µ · t ·a)is mapped
to the size of the rectangle, whileνis assigned to its opacity. This color and size coding scheme makes it easy for the user to look for “hot spots” - data blocks with large distortion and high contribution in the LOD map. The motivation for separating visibilityνfromCis intuitive too: more visible blocks in the LOD should appear brighter in the LOD map, and less visible ones darker.
4.2 Layout Design
Another key issue for the generation of LOD map is layout design. In the early1990s when treemaps were first prototyped, a straightforward
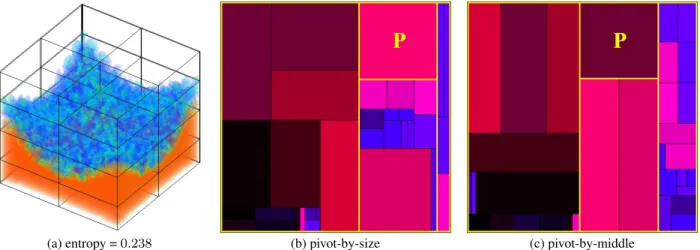
(a) entropy =0.238 (b) pivot-by-size (c) pivot-by-middle
Fig. 1. (a) shows a rendering of the RMI data set at low resolution with36blocks. (b) and (c) are its two LOD map layouts. In each layout, the “P” indicates the first pivot rectangle, and the yellow boundaries show the first subdivision. The normalized entropy is low because only a small number of data blocks are rendered.
slice-and-dicealgorithm was used to generate the treemap layout. A problem with this standard method is that it often produces rectangles with high aspect ratios. As a result, such skinny rectangles can be difficult to see, compare, and select. Over the years, several algorithms have been proposed to improve the aspect ratios of rectangles in the treemap [18]. However, they introduce instability over time in the display of dynamically changing data, and fail to preserve an ordering of the underlying data. These drawbacks are critical in our LOD map representation because:
• The information of a LOD keeps changing whenever the user
makes LOD adjustment or changes the view. If the LOD map layout has dramatic changes that causes unattractive flickering, it is hard to select and track data blocks in the LOD map.
• A LOD often comes with the back-to-front viewing order, in which neighboring blocks are close to each other in the LOD. Preserving this order in the LOD map layout is important for locating neighboring blocks and observing group patterns. Theordered treemapintroduced by Shneiderman and Wattenberg [18] uses layout algorithms that offer a good tradeoff among stable updates, order preserving, and low aspect ratios. In this paper, we adopt this layout design for our LOD map representation. The layout algorithm is similar to the idea of finding a 2D analogue of theQuickSort
algorithm. The inputs are a rectangleRto be subdivided and a list of items that are ordered by an index and have given areas. The crux of the algorithm is to choose a special item, thepivot, which is placed at the side ofR. The remaining items in the list are then assigned to three large rectangles that make up the rest of the display area. Finally, the algorithm is applied recursively to each of these rectangles. See [18] for a more detailed description of the algorithm. Variations of the algorithm are the choices of pivot. The pivot could be the item with the largest area in the list (pivot-by-size), or the middle item of the list (pivot-by-middle). In Section 7.1, we will discuss two scenarios where each of these choices of pivot should be used for smooth update.
4.3 Put It All Together
Having discussed how to define and represent the quality of LODs, it is time to put it all together and show how our scheme can be used. We experimented our idea with the Richtmyer-Meshkov Instability (RMI) data set [15]. The7.5GB RMI data set has the spatial dimension of
2048×2048×1920, from which we built a wavelet tree with a tree depth of six. Fig. 1 shows a LOD rendering of the RMI data set at the third tree level and its LOD map layouts. The viewing order is roughly preserved, as we can see that darker/brighter rectangles (data blocks with lower/higher visibility) are close to each other in the LOD map. Since a LOD map encodes the entropy information of a LOD,
if there is an unbalanced probability distribution among data blocks in the LOD, we can easily perceive this through color and size attributes of rectangles in its LOD map. Then, as demonstrated in Fig. 1 (b) or (c), several directions for optimizing the LOD quality can be immedi-ately followed:
• Look for “hot spots” - large rectangles with bright red colors.
They are highly-visible data blocks that have high contribution and large distortion. Splitting these blocks will most likely in-crease the entropy and improve the LOD quality.
• Small blue rectangles are data blocks that have low contribution
and small distortion. If they cluster in a local region, joining these blocks may save the block budget without decreasing the entropy.
• Dark rectangles are data blocks with the lowest visibility. If many of them cluster together, joining these blocks may also save the block budget without sacrificing the LOD quality.
The next section introduces a set of interactive techniques that allows the user to perform LOD adjustment efficiently.
5 INTERACTIVETECHNIQUES
In computer graphics and visualization,brushinghas been used as a method for selecting subsets of data for further operations, such as highlighting, deleting, or analysis. In our case, brushing is used to select a subset of data blocks from a LOD for join or split operations. We provide brushing in both views: the rendering window and the LOD map. The result of selection is highlighted in both views, as they are linked together and updated dynamically whenever one of the views changes. This technique helps the user detect correspondences between the two different visual representations. We allow the user to perform brushing in the following ways:
• Direct brushing in the LOD map by clicking a rectangle, or
spec-ifying a rectangular region to select multiple rectangles simulta-neously via mouse.
• Brushing in the rendering window by specifying the brush cov-erage as 1D point, 2D plane, or 3D box in the data space via slider.
• Brushing some parameter (such as visibilityν) or combination of parameters by specifying its range via slider.
Direct transformation is provided for interactivity and examination of local details. The user can translate, scale, and rotate the 3D volume in
the rendering window, and translate and scale the 2D LOD map. Data blocks selected in the LOD are highlighted with red boundaries and white crosses in the rendering window and the LOD map respectively. The user then proceeds to join or split these blocks. Ajoinoperation merges a selected block with its siblings into its parent block. Asplit
operation breaks a selected block into its eight child blocks. For mul-tiple selected data blocks, they are put into a queue and processed in sequence. We also provide the “undo” function so that the user can roll back to the previous LOD if the operation just performed is not desired.
(a) brushing with 2D plane (b) LOD map
Fig. 2. Brushing the RMI data set by specifying a 2D cutting plane. (a) shows the rendering of data selection and (b) is the corresponding LOD map.
Fig. 2 gives an example of brushing manipulation with a 2D cutting plane. Only the data blocks intersecting the plane (drawn in blue) are selected and rendered. In the LOD map, the selected data blocks are highlighted with white crosses.
data set (type) RMI (byte) VisWoman (short)
volume dimension 2048×2048×1920 512×512×1728
block dimension 128×128×64 32×32×64
volume (block) size 7.5GB (1MB) 864MB (128KB)
# non-empty blocks 10499 9446
compression ratio 5.60 : 1 2.37 : 1
Table 1. The RMI and VisWoman data sets.
Fig. 4. LOD quality comparison on the RMI data set with the same fixed view as in Fig. 1 (a). The plot shows how the entropy changes with different block budgets for three LOD selection methods. There are a total of10499non-empty blocks in the data hierarchy.
6 RESULTS
As listed in Table 1, we experimented with our LOD map on two data sets: the RMI data set (also mentioned in Section 4.3) from scientific simulation, and the visible woman (VisWoman) data set from medical application. For both data sets, the Haar wavelet transform with a lifting scheme was used to construct the wavelet tree data hierarchy. A
losslesscompression scheme was used with the threshold set to zero
Fig. 5. LOD quality comparison on the VisWoman data set with the fixed front view shown above. The plot shows how the entropy changes with different block budgets for three LOD selection methods. There are a total of9446non-empty blocks in the data hierarchy.
to compress the wavelet coefficients. To ensure seamless rendering, we extended one voxel overlapping boundaries between neighboring blocks in each dimension when breaking the original volume data into blocks. As a result, both hierarchies have a tree depth of six. All tests were performed on a3.0GHz Intel Xeon processor with3GB main memory, and an nVidia GeForce7800GT graphics card with256MB video memory.
6.1 LOD Comparison
For LOD comparison, we took three commonly-used LOD selection methods, i.e., level-based, MSE-based, and SNR-based, for our test. The level-based method selects a particular resolution level in the mul-tiresolution data hierarchy. For the MSE-based (SNR-based) method, we specify the MSE (SNR) error tolerance to determine the LOD (we followed Eqn. 4 wheredij is the MSE (SNR) of blocksbi andbj).
Fig. 3 gives an example where we compared the LOD quality of the MSE-based and level-based methods under the same block budget. Clearly, we can see that Fig. 3 (b) contains two “hot spots” (large rect-angles with bright red colors) and some small blue rectrect-angles clus-tered together. These are indications of bad distribution of data reso-lution. On the contrary, Fig. 3 (d) exhibits a much better distribution. It follows that the level-based method achieves a better LOD quality than the MSE-based one. Their entropy values and rendered images in Fig. 3 (a) and (c) also confirm this.
Fig. 4 and 5 show the change of entropy values on the two data sets under a series of block budgets. For the level-based method, the block budget increases eight folds when the level increases by one. There-fore, isolated data points rather than polylines are illustrated in both figures. For both data sets, we can see that the MSE-based and SNR-based LOD methods could not outperform the straightforward level-based method in terms of the tradeoff between LOD quality and block budget, although the level-based method does not allow flexible block budgets. For the RMI data set, the MSE-based method performs con-sistently better than the SNR-based one. However, this is not the case for the VisWoman data set, as the two polylines intertwine with each other in Fig. 5. Another finding is that the entropy does not always in-crease (actually dein-creases sometimes) with the inin-crease of block bud-get. This does not indicate the deterioration in rendered image quality, but rather, a less balanced distribution of probability among all the data blocks. In fact, we can imagine this potentially leaves room for us to improve the LOD quality (see Section 4.3) using the LOD map.
6.2 View Comparison
The quality of a given LOD can be improved by adjusting the view. Similar to the ideas of view selection presented in [2, 20], the entropy
(a) MSE-based,67blocks (b) entropy =0.163 (c) level-based,67blocks (d) entropy =0.381
Fig. 3. LOD comparison (fixed view, different LODs). A zoom to part of the spine of the VisWoman data set. (a) and (c) show the rendering of two different LODs with the same block budget. (b) and (d) are the LOD maps for (a) and (c) respectively.
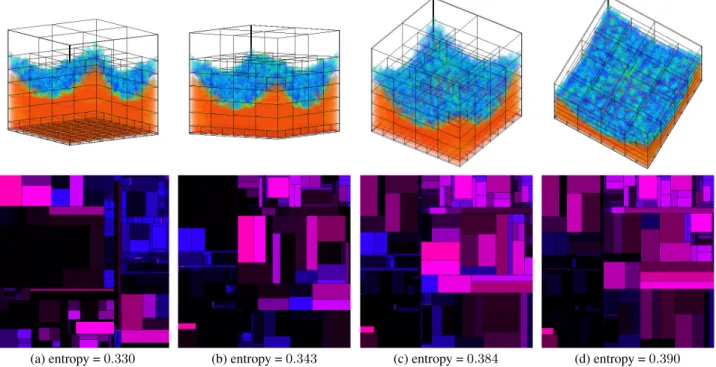
(a) entropy =0.330 (b) entropy =0.343 (c) entropy =0.384 (d) entropy =0.390
Fig. 6. View comparison (fixed LOD, different views). Four snapshots from a rendering sequence of the RMI data set. The LOD remains the same with246blocks while the entropy increases from (a) to (d). The pivot-by-middle layout is used to maintain relative stable update of the LOD map throughout the rendering sequence. The dramatic change in the LOD map layout from (a) to (b) is due to the abrupt change of the viewing order.
and the LOD map can help us find good views for a certain LOD. Fig. 6 gives an example where we compare different views for a fixed LOD of the RMI data set. The entropy increases as more information con-tent is received from Fig. 6 (a) to (d). Looking at the sequence of LOD maps, we can observe that the visibility of the LOD gets improved since the entire LOD map is getting brighter. Another finding from the LOD map sequence is that smaller blocks at the bottom of the volume corresponds to blue rectangles (small distortion) at the upper-right part of Fig. 6 (a), and larger blocks at the top of the volume corresponds to red rectangles (large distortion) in the LOD maps. The relative sta-ble update of the LOD map allows us to detect such correspondences between the rendered blocks and the rectangles. This information is useful when it comes to LOD adjustment.
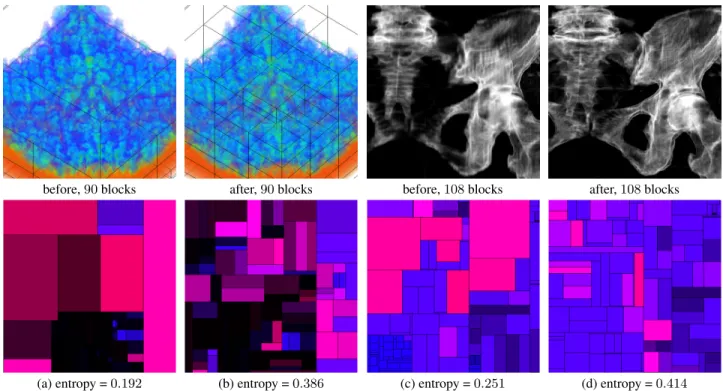
6.3 LOD Adjustment
The goal of LOD adjustment is to improve the quality of LOD. By splitting data blocks with large distortion and high contribution, and joining data blocks with small distortion and low contribution, we achieve a more balanced probability distribution among all data blocks, and therefore, increase the entropy of the LOD. Fig. 7 show two examples of LOD adjustment on the RMI and VisWoman data sets within fixed block budgets. For the RMI data set, we clearly see
some “hot spots” (large rectangles with bright red colors) and a cluster of dark rectangles (occluded data blocks) in the LOD map of Fig. 7 (a). In this example, we used the heuristic algorithm (Section 3.3) to optimize the LOD automatically. The LOD map after adjustment in Fig. 7 (b) shows a more balanced result. For the VisWoman data set, hot spots are popping out in the LOD map of Fig. 7 (c). Although there are no dark rectangles, many small blue rectangles cluster at the lower-left corner of the LOD map. The LOD quality is improved by splitting those hot spots and joining small blue rectangles. With the assist of a set of brushing techniques (Section 5), selecting such target rectangles in the LOD map and performing LOD adjustment becomes a simple and efficient task.
6.4 Budget Control
As demonstrated in Fig. 4 and 5, the commonly-used MSE-based and SNR-based LOD selection methods do not perform well (in terms of improving the quality of LOD) with the increase of block budget. This gives us opportunities to control the block budget. That is, if such a LOD selection algorithm could not optimize the quality of LOD under a certain block budget, could we instead give a LOD of similar quality but with a reduced block budget? Generating images of similar quality with smaller budgets is appealing for large data visualization because
before,90blocks after,90blocks before,108blocks after,108blocks
(a) entropy =0.192 (b) entropy =0.386 (c) entropy =0.251 (d) entropy =0.414
Fig. 7. LOD adjustment. A zoom of the RMI data set: (a) shows a given LOD based on the MSE, and (b) shows the result after the LOD adjustment. A zoom to the left pelvis of the VisWoman data set: (c) shows a given LOD based on the SNR, and (d) shows the result after the LOD adjustment. The pivot-by-size layout is used to maintain relative stable update of the LOD map during the adjustment process.
(a) entropy =0.448,365blocks (b) entropy =0.476,274blocks
Fig. 8. Budget control on the RMI data set. A LOD based on the MSE is given, where the view is the same as in Fig. 1 (a). (a) and (b) are the LOD maps before and after the budget control. The percentage of blocks with visibility less than0
.20decreases from48% in (a) to29% in
(b).
it could save us limited resources. Fig. 8 shows an example of budget control on the RMI data set. By joining data blocks with low visibility (dark rectangles) and improving the overall distribution of resolution, we reduce the block budget by25% while increasing the entropy of the LOD. This budget control does not affect the quality of rendered image, as the renderings before and after the budget control are almost identical.
7 DISCUSSION
As a reflection of what we state at the beginning of the paper, we discuss the effectiveness and efficiency of our LOD map approach to multiresolution volume visualization.
7.1 Effectiveness
Using entropy, our LOD quality measure becomes aglobalquality in-dex, i.e., it not only indicates the quality of rendered images, but also the probability distribution of all multiresolution data blocks in the
LOD. The probability takes into account the distortion and contribu-tion of data blocks. Therefore, a high entropy (good distribucontribu-tion) im-plies a balanced distribution of resources (e.g. data resolution), which is not captured by traditional LOD selection methods. Through the mapping of key LOD ingredients to a treemap representation, we cre-ate the LOD map as a visual interface for LOD comparison and val-idation. The LOD map is an intuitive representation of LOD quality, since key ingredients of a LOD are mapped to pre-attentive attributes (color and size of rectangles) in the LOD map. Integrating a heuris-tic algorithm and a set of interactive techniques, it also serves as a convenient user interface for visual data exploration. Note that the LOD map can be manipulated independently, and the actual render-ing of data could be deferred until a desired LOD of good quality is achieved. The results in Section 6 demonstrate that this visual inter-face is light-weighted and quite effective for multiresolution volume visualization.
For the LOD map, we utilize both size and pivot-by-middle layouts for relative stable update when the view or LOD changes. The choice of which layout should be used depends on which layout is more likely to keep the pivot unchanged. For example, if the view changes, the middle item in the LOD list is more likely to remain the same, as opposed to the item with the largest area. Therefore, the pivot-by-middle layout should be used. On the other hand, if a LOD undergoes any join or split operations, then the pivot-by-size layout should be used, since the item with the largest area in the LOD list is more likely to keep unchanged rather than the middle item. This simple rule proves very effective in maintaining smooth update of the LOD map.
7.2 Efficiency
In order to generate the LOD map in real time, we need quick up-date of the distortionDand contributionC for multiresolution data blocks. In this paper, we calculate Din the roughly perceptually-uniform CIELUV color space (note that in this case,Ddepends on the input color and opacity transfer function). Similar to error calculation in [11], we pre-compute and store summary tables to ensure real-time update of the distortionD. The summary tables are the histogram
(frequency of pairs of quantized scalar values in the parent and its child blocks) for each data block in the multiresolution data hierarchy. A zigzag run-length encoding scheme is used to reduce the storage overhead and facilitate the table lookup at run time. During the ren-dering, we can recompute the distortion within seconds for large data sets (such as the7.5GB RMI data set) whenever the transfer function
changes.
On the other hand, the quick update of the contributionCrequires real-time estimate of the visibilityν(Eqn. 5). Here, the essential ques-tion is how to calculate the visibility of many data blocks quickly, given an input occlusion map. Our solution is based on summed area tables (SATs), which take the occlusion map as the input. We utilize the GPU to estimate the average visibility. The GPU implementa-tion builds the SATs in passes with the support of framebuffer objects (GL_EXT_framebuffer_object). Getting the average visibility for a block is performed by a fragment program that looks up four cor-ners of its projection in the SATs. In this way, the visibility for all the data blocks can be evaluated interactively at run time. For instance, it only takes around0.2second to update the visibility of thousands of data blocks for the RMI data set. We refer readers to [23] for the algo-rithm, implementation, and performance of our summary table scheme and GPU-based visibility estimation.
The efficiency of our LOD map is thus ensured with a real-time update of the distortionDand contributionC. Our experiments show that at run time when we change the view or perform LOD adjustment, the entropy and the LOD map can be updated interactively for a LOD consisting of up to thousands of data blocks (a typical magnitude for our multiresolution data hierarchies).
8 CONCLUSION ANDFUTUREWORK
We have presented a new LOD quality measure using entropy and its visual representation using the LOD map for multiresolution volume visualization. Leveraging this quality measure and visual interface, it becomes not only feasible, but also effective and efficient for us to examine, compare, and validate the quality of LOD selection and rendering. We believe that this technique could be generalized, and applied to explore other solution spaces that exhibit similar properties as the LOD optimization problem.
The LOD map could carry more customized information for a LOD. For example, if the user wants to inspect how the transfer function contents of data blocks vary from their scalar field contents, we can add shading to the rectangles in the LOD map to indicate this. Tex-ture could also be applied to the LOD map to represent some other information of interest. User study along this direction, such as inves-tigating how many channels the user can perceive easily in the LOD map without information overload, is necessary. In the future, we also would like to extend our approach to multiresolution visualization of large-scale time-varying data.
ACKNOWLEDGEMENTS
This work was supported by NSF ITR Grant ACI-0325934, NSF RI Grant CNS-0403342, DOE Early Career Principal Investigator Award DE-FG02-03ER25572, NSF Career Award CCF-0346883, and Oak
Ridge National Laboratory Contract400045529. The RMI data set
is courtesy of Mark A. Duchaineau at Lawrence Livermore National Laboratory, and the VisWoman data set is courtesy of The National Library of Medicine. Special thanks to Carrie Casto for story nar-ration and Hana Kang for voice editing of the accompanying video. Finally, the authors would like to thank the anonymous reviewers for their helpful comments.
REFERENCES
[1] C. L. Bajaj, V. Pascucci, and D. R. Schikore. The Contour Spectrum. In Proc. of IEEE Visualization ’97, pages 167–173, 1997.
[2] U. D. Bordoloi and H.-W. Shen. View Selection for Volume Rendering. InProc. of IEEE Visualization ’05, pages 487–494, 2005.
[3] T. A. Funkhouser and C. H. S´equin. Adaptive Display Algorithm for Interactive Frame Rates During Visualization of Complex Virtual Envi-ronments. InProc. of ACM SIGGRAPH ’93, pages 247–254, 1993.
[4] M. H. Ghavamnia and X. D. Yang. Direct Rendering of Laplacian Pyra-mid Compressed Volume Data. InProc. of IEEE Visualization ’95, pages 192–199, 1995.
[5] S. Guthe, M. Wand, J. Gonser, and W. Straßer. Interactive Rendering of Large Volume Data Sets. InProc. of IEEE Visualization ’02, pages 53–60, 2002.
[6] T. J. Jankun-Kelly and K.-L. Ma. Visualization Exploration and Encap-sulation via a Spreadsheet-Like Interface. IEEE Trans. on Visualization & Computer Graphics, 7(3):275–287, 2001.
[7] T. J. Jankun-Kelly, K.-L. Ma, and M. Gertz. A Model for the Visualization Exploration Process. InProc. of IEEE Visualization ’02, pages 323–330, 2002.
[8] D. A. Keim. Information Visualization and Visual Data Mining. IEEE Trans. on Visualization & Computer Graphics, 7(1):100–107, 2001. [9] J. Kniss, G. Kindlmann, and C. D. Hansen. Interactive Volume
Render-ing UsRender-ing Multi-Dimensional Transfer Functions and Direct Manipula-tion Widgets. InProc. of IEEE Visualization ’01, pages 255–262, 2001. [10] E. LaMar, B. Hamann, and K. I. Joy. Multiresolution Techniques for
Interactive Texture-Based Volume Visualization. InProc. of IEEE Visu-alization ’99, pages 355–362, 1999.
[11] E. LaMar, B. Hamann, and K. I. Joy. Efficient Error Calculation for Multiresolution Texture-Based Volume Visualization. InHierarchical & Geometrical Methods in Scientific Visualization, pages 51–62, 2003. [12] M. Levoy. Efficient Ray Tracing of Volume Data.ACM Trans. on
Graph-ics, 9(3):245–261, 1990.
[13] K.-L. Ma. Image Graphs - A Novel Approach to Visual Data Exploration. InProc. of IEEE Visualization ’99, pages 81–88, 1999.
[14] J. Marks, B. Andalman, P. A. Beardsley, W. Freeman, S. Gibson, J. Hod-gins, T. Kang, B. Mirtich, H. Pfister, W. Ruml, K. Ryall, J. Seims, and S. Shieber. Design Galleries: A General Approach to Setting Parameters for Computer Graphics and Animation. InProc. of ACM SIGGRAPH ’97, pages 389–400, 1997.
[15] A. A. Mirin, R. H. Cohen, B. C. Curtis, W. P. Dannevik, A. M. Dimits, M. A. Duchaineau, D. E. Eliason, D. R. Schikore, S. E. Anderson, D. H. Porter, P. R. Woodward, L. J. Shieh, and S. W. White. Very High Resolu-tion SimulaResolu-tion of Compressible Turbulence on the IBM-SP System. In Proc. of ACM/IEEE Supercomputing ’99, 1999.
[16] S. Muraki. Approximation and Rendering of Volume Data Using Wavelet Transforms. InProc. of IEEE Visualization ’92, pages 21–28, 1992. [17] B. Shneiderman. Tree Visualization with Tree-Maps: A 2D Space-Filling
Approach.ACM Trans. on Graphics, 11(1):92–99, 1992.
[18] B. Shneiderman and M. Wattenberg. Ordered Treemap Layouts. InProc. of IEEE Information Visualization ’01, pages 73–78, 2001.
[19] Shneiderman, B. Treemaps for Space-Constrained Visualization of Hier-archies (http://www.cs.umd.edu/hcil/treemap-history/).
[20] S. Takahashi, I. Fujishiro, Y. Takeshima, and T. Nishita. A Feature-Driven Approach to Locating Optimal Viewpoints for Volume Visualization. In Proc. of IEEE Visualization ’05, pages 495–502, 2005.
[21] M. Tory, S. Potts, and T. M¨oller. A Parallel Coordinates Style Interface for Exploratory Volume Visualization. IEEE Trans. on Visualization & Computer Graphics, 11(1):71–80, 2005.
[22] J. J. van Wijk. The Value of Visualization. InProc. of IEEE Visualization ’05, pages 79–86, 2005.
[23] C. Wang, A. Garcia, and H.-W. Shen. Interactive Level-of-Detail Selec-tion Using Image-Based Quality Metric for Large Volume VisualizaSelec-tion. IEEE Trans. on Visualization & Computer Graphics. Accepted for pub-lication, 2006.
[24] C. Wang and H.-W. Shen. Hierarchical Navigation Interface: Leveraging Multiple Coordinated Views for Level-of-Detail Multiresolution Volume Rendering of Large Scientific Data Sets. InProc. of Information Visuali-sation ’05, pages 259–267, 2005.
[25] Z. Wang, A. C. Bovik, H. R. Sheikh, and E. P. Simoncelli. Image Quality Assessment: From Error Visibility to Structural Similarity.IEEE Trans. on Image Processing, 13(4):600–612, 2004.
[26] R. Westermann. A Multiresolution Framework for Volume Rendering. In Proc. of IEEE Volume Visualization ’94, pages 51–58, 1994.
[27] J. Wilhelms and A. van Gelder. Multi-Dimensional Trees for Controlled Volume Rendering and Compression. InProc. of IEEE Volume Visual-ization ’94, pages 27–34, 1994.
[28] Y. Zhou, B. Chen, and A. E. Kaufman. Multiresolution Tetrahedral Framework for Visualizing Regular Volume Data. InProc. of IEEE Visu-alization ’97, pages 135–142, 1997.