Graduate Theses and Dissertations Iowa State University Capstones, Theses and Dissertations
2017
Quantifying the impacts of a winter cereal rye cover
crop and no-till on soil moisture, soil temperature,
and nitrate loss via subsurface drainage
Emily Rose Waring Iowa State University
Follow this and additional works at:https://lib.dr.iastate.edu/etd
Part of theAgriculture Commons,Bioresource and Agricultural Engineering Commons,Soil Science Commons, and theWater Resource Management Commons
This Thesis is brought to you for free and open access by the Iowa State University Capstones, Theses and Dissertations at Iowa State University Digital
Recommended Citation
Waring, Emily Rose, "Quantifying the impacts of a winter cereal rye cover crop and no-till on soil moisture, soil temperature, and nitrate loss via subsurface drainage" (2017).Graduate Theses and Dissertations. 15452.
Quantifying the impacts of a winter cereal rye cover crop and no-till on soil moisture,
soil temperature, and nitrate loss via subsurface drainage
by
Emily Rose Waring
A thesis submitted to the graduate faculty
in partial fulfillment of the requirements for the degree of MASTER OF SCIENCE
Major: Agricultural and Biosystems Engineering
Program of Study Committee: Matthew J. Helmers, Major Professor
Daniel S. Andersen John E. Sawyer
Iowa State University Ames, Iowa
2017
ii
TABLE OF CONTENTS
LIST OF TABLES v
LIST OF FIGURES vii
ACKNOWLEDGMENTS ix
ABSTRACT x
CHAPTER I. GENERAL INTRODUCTION 1
Thesis Organization 3
References 5
CHAPTER II. IMPACT OF NO-TILL AND COVER CROPS ON SOIL WATER
CONTENT AND SOIL TEMPERATURE IN IOWA 7
Abstract 7
Introduction 8
Methodology 10
Site descriptions 10
Data processing and statistical analysis 12
Weather 14
Results and Discussion 14
Rye biomass 14
Impact of NT on soil moisture 15
Impact of NT on soil temperature 17
Impact of rye on soil moisture 18
Impact of rye on soil temperature 20
iii
Tables 26
Figures 37
CHAPTER III. IMPACT OF A WINTER CEREAL RYE COVER CROP AND
TILLAGE ON NITRATE-N LOSS FROM SUBSURFACE DRAINAGE 48
Abstract 48
Introduction 49
Methodology 51
Site description and treatments 51
Data collection and analysis 52
Results and Discussion 53
Weather 53
Subsurface drainage 54
Rye biomass 55
Yield 56
Seasonal nitrate-N concentration 57
Seasonal nitrate-N load 59
Annual nitrate-N concentration and nitrate N-load 60
Discussion 60
Conclusion 63
References 64
Tables 67
Figures 73
CHAPTER IV. GENERAL CONCLUSIONS AND RECOMMENDATIONS FOR
FUTURE RESEARCH 74
APPENDIX A. ADW CHISEL PLOW VS. NO-TILL SOIL MOISTURE CONTENT
iv
APPENDIX B. ADW CHISEL PLOW VS. NO-TILL SOIL TEMPERATURE 106
APPENDIX C. ADW NO-TILL VS. NO-TILL WITH RYE SOIL MOISTURE
CONTENT AND SOIL WATER 136
APPENDIX D. ADW NO-TILL VS. NO-TILL WITH RYE SOIL TEMPERATURE 166
APPENDIX E. ISUAG NO-TILL VS. NO-TILL WITH RYE SOIL MOISTURE
CONTENT AND SOIlWATER 196
APPENDIX F. ISUAG NO-TILL VS. NO-TILL WITH RYE SOIL TEMPERATURE
v
LIST OF TABLES
Table II-1. Treatments for crop-years 2011-2015. All plots were in a corn-soybean
rotation 26
Table II-2. Field operations from 2011 to 2015 at ADW 27
Table II-3. Fields operations from 2011 to 2015 at ISUAG 28
Table II-4. Weather at ADW 29
Table II-5. Weather at ISUAG 29
Table II-6. Rye biomass before corn and soybean at ADW and ISUAG 30
Table II-7. ADW period mean daily average soil moisture content with fall chisel plow (CT) and no-till (NT) at ADW at 10 cm (left), 20 cm (center), and soil water in top 30
cm (right) 31
Table II-8. ADW period mean daily maximum soil temperature with chisel plow (CT) and no-till (NT) at ADW at 10 cm (left), 20 cm (center), and in top 30 cm (right) 32 Table II-9. ADW period mean daily average soil moisture content with no-till (NT) and no-till rye (NTr) at ADW at 10 cm (left), 20 cm (center), and soil water (cm) in top 30
cm (right) 33
Table II-10. ISUAG Period mean daily maximum soil moisture content with no-till (NT) and no-till rye (NTr) at ISUAG at 10 cm (left), 20 cm (center), and soil water
(cm) in top 30 cm (right) 34
Table II-11. ADW period mean daily maximum soil temperature with no-till (NT) and no-till rye (NTr) at ADW at 10 cm (left), 20 cm (center), and in top 30 cm (right) 35 Table II-12. ISUAG period mean daily average soil temperature with no-till (NT) and no-till rye (NTr) at ISUAG at 10 cm (left), 20 cm (center), and in top 30 cm (right) 36 Table III-1. Treatments for crop-years 2011-2015, all plots were in a corn-soybean
rotation 67
Table III-2. Field operations at ADW site in 2011 to 2015 crop years 67
Table III-3. Temperature and weather data compared to normal at ADW 68
Table III-4. Drainage at ADW from 2011-2015 69
Table III-5. Soybean grain yields, grain N uptake, and rye biomass 70
vi
Table III-7. Seasonal nitrate-N concentrations and nitrate-N loads lost through tile
drainage in the soybean phase 71
Table III-8. Seasonal nitrate-N concentration and nitrate-N load lost through tile
drainage in the corn phase 72
vii
LIST OF FIGURES
Figure II-1. ADW soybean 10-cm daily average soil moisture content in period 1 of
2013 37
Figure II-2. ADW corn 10-cm daily average soil moisture content in period 1 of 2013 37 Figure II-3. ADW soybean 20-cm daily average soil moisture content in period 1 of
2013 38
Figure II-4. ADW corn 20-cm daily average soil moisture content in period 1 of 2013 38 Figure II-5. ADW soybean 10-cm daily average soil moisture content in period 2 of
2013 39
Figure II-6. ADW soybean 10-cm daily average soil moisture content in period 3 of
2013 39
Figure II-7. ADW soybean daily average soil temperature in the top 30 cm in period 1
of 2014 40
Figure II-8. ADW soybean daily maximum soil temperature in the top 30 cm in period
2 of 2014 40
Figure II-9. ADW soybean daily average soil temperature in the top 30 cm in period 3
of 2014 41
Figure II-10. ADW soybean daily average soil temperature in the top 30 cm in period
1 of 2012 41
Figure II-11. ADW corn daily average soil temperature in the top 30 cm in period 1 of
2012 42
Figure II-12. ADW corn 20-cm daily average soil moisture content in period 1 of 2015
42 Figure II-13. ADW corn 20-cm daily average soil moisture content in period 2 of 2015
43 Figure II-14. ADW soybean 20-cm daily average soil moisture content in period 1 of
2013 43
Figure II-15. ADW soybean 20-cm daily average soil moisture content in period 2 of
2013 44
Figure II-16. ISUAG corn soil water in the top 30 cm in period 1 of 2015 44
viii
Figure II-18. ISUAG corn soil water in the top 30 cm in period 3 of 2015 45
Figure II-19. ISUAG soybean soil water in the top 30 cm in period 1 of 2012 46
Figure II-20. ISUAG soybean soil water in the top 30 cm in period 2 of 2012 46
Figure II-21. ISUAG corn 10-cm daily average soil moisture content in period 1 of
2012 47
Figure II-22. ISUAG corn 10-cm daily average soil moisture content in period 1 of
2015 47
Figure III-1. Cumulative nitrate-N loss per treatment from 2011-2015 with chisel plow
and no-till. Averaged over corn and soybean crops. 73
Figure III-2. Cumulative nitrate-N loss per treatment from 2011-2015 with chisel plow
and chisel plow with rye. Averaged over corn and soybean crops. 73
Figure III-3. Cumulative nitrate-N loss per treatment from 2011-2015 with no-till and
ix
ACKNOWLEDGMENTS
I would like to acknowledge several members of the Agricultural Water Management research group. First, our group leader and my major professor, Dr. Matt Helmers as he has provided kind leadership and a wealth of knowledge throughout my time at Iowa State University. I would also like to thank Ainis Lagzdins for his faithfulness and hard work in maintaining the drainage site at ADW in all kinds of weather. Thanks to Carl Pedersen for his hands-on assistance in the field and for his availability to thoroughly answer agronomic and mechanical questions on many occasions. Several people were involved in the tedious setup and upkeep of soil moisture and temperature sensors and data over 5 years at ADW and ISUAG: Dr. Dan Barker, Kristina Craft, Dr. Aaron Daigh, Ryan Goeken, Lance Henrichs, Melissa Larson, Amanda Marlin, Alex Martin, Sam Phillips, Dr. John Sawyer, Quenton Schneider, Linda Schott, Nathan Waskel, Connor West, and many more. I would like to acknowledge Drs. Michael Castellano, Dan Andersen, and John Sawyer for their assistance interpreting and discussing the nitrogen budget in light of the results found in this study. I also received statistical consulting from Lendie Follett and Katie Rey.
This research is part of a regional collaborative project supported by the USDA-NIFA, Award No. 2011-68002-30190: Cropping Systems Coordinated Agricultural Project: Climate Change, Mitigation, and Adaptation in Corn-based Cropping Systems. The project website can be found at sustainablecorn.org. There were 11 institutions involved in the project team: Iowa State University, Lincoln University, Michigan State University, The Ohio State University, Purdue University, South Dakota State University, University of Illinois, University of Minnesota, University of Missouri, University of Wisconsin, and USDA-Agricultural Research Service Columbus, Ohio.
x
ABSTRACT
Artificial subsurface drainage, while necessary to maintain agricultural production in the soils and climate of the northern U.S. corn belt, can result in adverse environmental impacts. A major concern is the disproportionately large nitrate loads from agricultural lands with artificial drainage in the northern U.S. corn belt that contribute to the hypoxic zone in the Gulf of Mexico.
The first chapter in this thesis investigated the impacts of two conservation practices on soil temperature and moisture. The first conservation practice investigated is no-till compared to a fall chisel plow system in a north-central Iowa site. This study found that no-till significantly increased average daily soil moisture content prior to planting of a cash crop. No-till frequently had colder soil temperatures in the spring and summer compared to a chisel plow treatment. Corn residue had more of an impact on soil temperature and moisture than soybean residue. The second conservation practice investigated in the first chapter is a winter cereal rye cover crop at a north-central Iowa site and a central Iowa site. The central Iowa site had greater rye biomass which was associated with an increase in soil water even when rye was transpiring, while the north-central Iowa site had lesser rye biomass which was associated with a decrease in soil water whether rye was growing or had been terminated.
The second chapter in this thesis investigated the impact of no-till and a winter rye cover crop on seasonal and annual nitrate-N concentration and nitrate-N loading in leachate from artificial subsurface drainage. No-till and a rye cover crop with chisel plow significantly and consistently decreased nitrate-N loading and concentration in leachate on both the seasonal and annual scales compared to the chisel plow only treatment. Compared to no-till, a winter
xi
is likely due to a combination of low nitrate-N leaching potential from no-till, and low rye biomass values throughout the entire study with no-till. Overall, both cover crops and no-till showed potential for improving nitrogen management with respect to water quality.
Future research should focus on increasing rye biomass in a northern climate, as this may alleviate soil water depletion concerns and increase the likelihood of rye biomass mitigating nitrate-N leaching off-site. Additionally, studies in long-term no-till situations, production scale drainage, and on different soil types should be considered for a better prediction of the broader scale impacts of no-till on nitrate-N leaching.
1
CHAPTER I.GENERAL INTRODUCTION
A large portion of the Gulf of Mexico cannot sustain marine life because of hypoxia, or low oxygen levels (Diaz and Rosenberg, 1995). The Hypoxic Zone in the northern gulf, stretching from Louisiana to Texas, is the largest area in North America to be impacted by hypoxia (Rabalais et al., 1991). The Mississippi River/ Gulf of Mexico Watershed Nutrient Task Force created the “Action Plan for Reducing, Mitigating, and Controlling Hypoxia in the Northern Gulf of Mexico” in 2001 and updated this action plan in 2008 (Mississippi River/ Gulf of Mexico Watershed Nutrient Task Force, 2008). The 2008 Action Plan stated the goal of reducing the average size of the hypoxic zone to 5,000 square kilometers by 2015. The 5-year average was 15,126 square kilometers in 2013 (Hypoxia Task Force, 2013). The Upper Mississippi River and Ohio-Tennessee River basins contribute nearly all the spring nitrogen load to the Gulf of Mexico. Furthermore, they contribute 82% of nitrate-N loads annually, which is vastly disproportionate to their relative drainage size (31% of total drainage) (EPA Science Advisory Board, 2007). These basins have intense agricultural production and the highest proportion of artificial subsurface drainage in the area draining to the Gulf of Mexico (EPA Science Advisory Board, 2007). Along with hypoxia in the gulf, high nitrate-N concentrations can impact local waterbodies (Fausey et al., 1995). The 2008 Action Plan called for states in the Upper Mississippi River Basin to create comprehensive nutrient reduction strategies. As a result, the Iowa Department of Agriculture and Land Stewardship (IDALS), the Iowa Department of Natural Resources (IDNR), and Iowa State University (ISU) developed the Iowa Nutrient Reduction Strategy. In their science assessment, prepared in 2013, they estimate that nonpoint sources would need to reduce 41% of nitrate-N and 29% of P to
2
that cover crops and living mulches show great potential for nitrate-N reduction, and no-till for P reduction (Iowa State University Science Team, 2013).
The conservation practice of no-till keeps soil in place with the protection of crop residue, protecting the soil surface from impact from precipitation and wind (Thompson et al., 2001). It is well documented that conservation tillage reduces erosion, runoff, and the loss of P and other surface water contaminants (Angle et al., 1984; Honisch et al., 2002; Johnson et al., 1979; McGregor and Greer, 1982; Mostaghimi et al., 1988; Puustinen et al., 2005). Along with environmental benefits, increasing residue cover can increase organic matter and aggregate stability (Cambardella and Elliott, 1993; Havlin et al., 1990; Islam and Reeder, 2014; SalinasGarcia et al., 1997). Loss of topsoil by overland flow can decrease crop production (Al-Kaisi, 2008; Al-Kaisi et al., 2005; Jin et al., 2009). Because of these environmental and agronomic benefits, no-till is becoming more popular in the United States. According to the Conservation Technology Information Center (2007), about 24% of cultivated acres in the United States were under no-till in 2007, up from 5% in 1989.
Winter cereal rye (Secale cereal L.) shows great potential for successful growth in the upper Midwest because of its cold tolerance (Staver and Brinsfield, 1998). Cover crops are a strategy for reduction of N-loss because they use and store nutrients, immobilizing a fraction of the root zone nitrate otherwise available for leaching (Hartwig and Ammon, 2002; Sharpley and Smith, 1991; Staver and Brinsfield, 1998). Cover crops also provide vegetative cover and roots to reduce runoff and soil loss from agricultural lands (Sharpley and Smith, 1991; Siller et al., 2016; Zhu et al., 1989). Cover crops can improve soil quality by providing organic inputs to support biological activity and biodiversity and increasing organic matter and soil structure (Jokela et al., 2009; Moore et al., 2014; Veum et al., 2015; Zuazo and Pleguezuelo, 2009).
3
The impacts of both no-till and a winter rye cover crop on soil and water properties are likely to be location-specific (Hatfield et al., 2001). Moreover, the impacts of a winter rye cover crop on soil properties in a northern climate within a given location are likely to be variable from year-to-year because of weather patterns and subsequent rye growth. Rye biomass may be especially low in cold fall or spring seasons, and it is imperative to study especially low biomass and its impact on both nitrate leaching and soil water availability.
The objectives of this thesis were to quantify:
1. The impact of no-till and a winter cereal rye cover crop on soil water content and soil temperature in north-central and central Iowa
2. The impact of no-till and a winter cereal rye cover crop on nitrate-N mass loss and nitrate-N concentration in tile flow from subsurface drainage in north-central Iowa
Thesis Organization
Chapter 2 of this thesis examined the impact of no-till on soil water content and soil temperature at a site in north-central Iowa. It also examined the impact of a winter cereal rye cover crop at two sites, one in north-central Iowa and one in central Iowa. The impact of a cover crop on soil moisture and temperature is presented in the context of the different amounts of rye biomasses at the two different sites. This chapter summarized the results seen in a 5-year study and compared them to similar studies in the northern U.S. corn belt. Chapter 3 of this thesis further presented no-till and a winter cereal rye cover crop at the north-central Iowa site and their impact on yield and nitrate leaching via subsurface drainage. Chapter 4 discussed
4
for future research include: how to promote rye growth in a northern climate, and studies examining no-till’s impact on nitrate leaching with longer-term no-till implementation, with different drainage patterns, and with different soil types.
5
References
Al-Kaisi M.M. (2008) Soil erosion, crop productivity and cultural practices. Iowa State University Extension Publication PM 1870.
Al-Kaisi M.M., Yin X.H., Licht M.A. (2005) Soil carbon and nitrogen changes as affected by tillage system and crop biomass in a corn-soybean rotation. Applied Soil Ecology 30:174-191. DOI: 10.1016/j.apsoil.2005.02.014.
Angle J.S., McClung G., McIntosh M.S., Thomas P.M., Wolf D.C. (1984) Nutrient losses in runoff from conventional and no-till corn watersheds. Journal of Environmental Quality 13:431-435.
Cambardella C.A., Elliott E.T. (1993) Carbon and nitrogen distribution in aggregates from cultivated and native grassland soils. Soil Science Society of America Journal 57:1071-1076.
Conservation Technology Information Center. (2007) National crop residue management survey Conservation Technology Information Center, West Lafayette, Indiana
Diaz R.J., Rosenberg R. (1995) Marine benthic hypoxia: A review of its ecological effects and the behavioural responses of benthic macrofauna, in: A. D. Ansell, et al. (Eds.), Oceanography and Marine Biology - an Annual Review, Vol 33. pp. 245-303.
EPA Science Advisory Board. (2007) Hypoxia in the northern gulf of Mexico: An update by the EPA science advisory board, United States Environmental Protection Agency Washington, D.C. .
Fausey N.R., Brown L.C., Belcher H.W., Kanwar R.S. (1995) Drainage and water-quality in Great-Lakes and corn-belt states. Journal of Irrigation and Drainage Engineering-ASCE 121:283-288. DOI: 10.1061/(asce)0733-9437(1995)121:4(283).
Hartwig N.L., Ammon H.U. (2002) 50th Anniversary - Invited article - Cover crops and living
mulches. Weed Science 50:688-699. DOI:
10.1614/0043-1745(2002)050[0688:aiacca]2.0.co;2.
Hatfield J.L., Sauer T.J., Prueger J.H. (2001) Managing soils to achieve greater water use efficiency: A review. Agronomy Journal 93:271-280.
Havlin J.L., Kissel D.E., Maddux L.D., Claassen M.M., Long J.H. (1990) Crop-rotation and tillage effects on soil organic-carbon and nitrogen. Soil Science Society of America Journal 54:448-452.
Honisch M., Hellmeier C., Weiss K. (2002) Response of surface and subsurface water quality to land use changes. Geoderma 105:277-298. DOI: 10.1016/s0016-7061(01)00108-2. Hypoxia Task Force. (2013) Reassessment 2013: Assessing progress made since 2008, U.S.
Environmental Protection Agency Office of Wetlands, Oceans, and Watersheds Washington, DC.
Iowa State University Science Team. (2013) Iowa science assessment of nonpoint source practices to reduce nitrogen and phosphorus transport in the Mississippi River basin, Ames, Iowa
Islam R., Reeder R. (2014) No-till and conservation agriculture in the United States: An example from the David Brandt farm, Carroll, Ohio. International Soil and Water Conservation Research 2:97-107.
6
on runoff soil organic carbon losses. Catena 78:81-86. DOI:
10.1016/j.catena.2009.03.001.
Johnson H.P., Baker J.L., Shrader W.D., Laflen J.M. (1979) Tillage system effects on sediment and nutrients in runoff from small watersheds. Transactions of the Asae 22:1110-1114. Jokela W.E., Grabber J.H., Karlen D.L., Balser T.C., Palmquist D.E. (2009) Cover crop and liquid manure effects on soil quality indicators in a corn silage system. Agronomy Journal 101:727-737. DOI: 10.2134/agronj2008.0191.
McGregor K.C., Greer J.D. (1982) Erosion control with no-till and reduced till corn for silage and grain. Transactions of the Asae 25:154-159.
Mississippi River/ Gulf of Mexico Watershed Nutrient Task Force. (2008) Gulf hypoxia action plan 2008 for reducing, mitigating, and controlling hypoxia in the northern Gulf of Mexico and improving water quality in the Mississippi River basin, Washington, DC. Moore E.B., Wiedenhoeft M.H., Kaspar T.C., Cambardella C.A. (2014) Rye cover crop effects
on soil quality in no-till corn silage-soybean cropping systems. Soil Science Society of America Journal 78:968-976. DOI: 10.2136/sssaj2013.09.0401.
Mostaghimi S., Dillaha T.A., Shanholtz V.O. (1988) Influence of tillage systems and residue levels on runoff, sediment, and phosphorus losses. Transactions of the Asae 31:128-132.
Puustinen M., Koskiaho J., Peltonen K. (2005) Influence of cultivation methods on suspended solids and phosphorus concentrations in surface runoff on clayey sloped fields in boreal
climate. Agriculture Ecosystems & Environment 105:565-579. DOI:
10.1016/j.agee.2004.08.005.
Rabalais N.N., Turner R.E., Wiseman W.J., Boesch D.F. (1991) A brief summary of hypoxia on the northern Gulf of Mexico continental-shelf - 1985-1988.
SalinasGarcia J.R., Hons F.M., Matocha J.E. (1997) Long-term effects of tillage and fertilization on soil organic matter dynamics. Soil Science Society of America Journal 61:152-159.
Sharpley A.N., Smith S.J. (1991) Effects of cover crops on surface-water quality Soil & Water Conservation Soc, Ankeny.
Siller A.R.S., Albrecht K.A., Jokela W.E. (2016) Soil erosion and nutrient runoff in corn silage production with kura clover living mulch and winter rye. Agronomy Journal 108:989-999. DOI: 10.2134/agronj2015.0488.
Staver K.W., Brinsfield R.B. (1998) Using cereal grain winter cover crops to reduce groundwater nitrate contamination in the mid-Atlantic coastal plain. Journal of Soil and Water Conservation 53:230-240.
Thompson A.L., Ghidey F., Regmi T.P. (2001) Raindrop energy effects on chemical and sediment transport. Transactions of the Asae 44:835-841.
Veum K.S., Kremer R.J., Sudduth K.A., Kitchen N.R., Lerch R.N., Baffaut C., Stott D.E., Karlen D.L., Sadler E.J. (2015) Conservation effects on soil quality indicators in the Missouri Salt River Basin. Journal of Soil and Water Conservation 70:232-246. DOI: 10.2489/jswc.70.4.232.
Zhu J.C., Gantzer C.J., Anderson S.H., Alberts E.E., Beuselinck P.R. (1989) Runoff, soil, and dissolved nutrient losses from no-till soybean with winter cover crops. Soil Science Society of America Journal 53:1210-1214.
Zuazo V.H.D., Pleguezuelo C.R.R. (2009) Soil-erosion and runoff prevention by plant covers: A review.
7
CHAPTER II.IMPACT OF NO-TILL AND COVER CROPS ON SOIL WATER
CONTENT AND SOIL TEMPERATURE IN IOWA Abstract
The conservation practices of no-till and cover crops are supported by the Iowa Nutrient Reduction strategy to mitigate the adverse environmental impacts from agricultural production. No-till presents the risk for a yield decrease in northern, wet climates because of possible decreases in spring soil temperature and increases in spring soil moisture. There isalso farmer concern for a yield decrease from planting a winter cereal rye cover crop. This concern comes at least in part from the potential for a growing (non-cash) crop to decrease available soil water for the emerging cash crop. The objectives of this study were to quantify the impact of no-till and a winter rye cover crop on daily average soil moisture and daily maximum soil temperature in the top 30 cm over 3 periods throughout the rye and cash crop growing seasons. In period 1, under corn residue, at the north central Iowa site with minimal rye biomass (ADW), the 5-year period mean daily average soil moisture at 10-cm was 0.246 m3 m-3 with chisel plow
(CT) and 0.289 m3 m-3 with no-till (NT). Moisture and temperature differences from NT typically disappeared by period 3 (growing cash crop with canopy). At ADW, in plots with rye, the 20-cm depth was typically decreased of soil water under both crops and through all 3 periods. However, the soil water depletion never put the soil moisture content below wilting point in the top 30 cm. At the central-Iowa site with greater biomass (ISUAG), rye frequently increased the amount of soil water in the top 30 cm under both crops throughout all three periods (with a growing cover crop, growing cash crop without/with canopy). This is likely due to greater rye biomass at ISUAG. The findings from this chapter stated that adequate rye
8
Introduction
Both no-till and a winter rye cover crop show potential for decreasing off-site adverse environmental impacts from agricultural systems by reducing nutrient loss. To promote adaptation of these conservation practices, more research is needed to understand their impacts on the water budget. The conservation practice of no-till frequently decreases yields in the northern U.S. corn belt (Allmaras et al., 1964; Johnson and Lowery, 1985; Kaspar et al., 1990; Swan et al., 1996). Yield decreases under conservation tillage in wetter climates are associated with delayed germination and emergence (Aldarby and Lowery, 1986; Aldarby and Lowery, 1987; Beauchamp and Lathwell, 1967), and decrease in root and shoot growth (Gupta et al., 1983; Kaspar et al., 1987; Logsdon et al., 1987; Mackay and Barber, 1985). These adverse impacts on crop growth are from low soil temperature (Coelho and Dale, 1980; Imholte and Carter, 1987; Miedema, 1982; Shaw, 1977; Van Wijk et al., 1959) and high soil moisture conditions (Griffith et al., 1986; Logsdon et al., 1987; Mackay and Barber, 1985).
Risk of yield decrease causes farmer resistance to this conservation practice (Erbach, 1982; Jolly et al., 1983). Logsdon et al. (1987) state that low temperature has the greatest negative impact on corn growth, but compaction, oxygen stress from high soil moisture, and water stress from low soil moisture also adversely impact yield. It has been shown that, in the weeks prior to and following emergence, corn root growth, germination rate, and above ground biomass production linearly increase with an increase in temperature from 10 to 30 degrees Celsius (Allmaras et al., 1964; Coelho and Dale, 1980; Logsdon et al., 1987; Miedema, 1982). Van Wijk et al. (1959) explained that the same decrease in temperature will have a markedly greater yield decrease in a northern, wet climate compared to a southern location where soils are warmer in the spring.
9
Cover crops can improve many soil properties, but their impacts on quantity of soil water are contradicting in the literature. Although they transpire water during growth, adequate growth of cover crops can promote a mulch effect, increased organic matter in the long-term, and improved infiltration which may result in an increase soil water holding capacity (Daigh et al., 2014; Mulumba and Lal, 2008; Steiner, 1994; Unger and Vigil, 1998). In Minnesota, Krueger et al. (2011) found no effect on soil water content during the cash crop growing season if rye was killed rather than harvested. Daigh et al. (2014) and Basche et al. (2016) found an increase in soil water content after the termination of rye, but a slight decrease in soil water when rye was at its peak growth and transpiration. Ewing et al. (1991) found that crimson clover depleted soil water before corn planting. Qi and Helmers (2010) found water depletion under rye prior to cash crop planting compared to bare soil due to increased transpiration. In wet conditions such as poorly drained soils, it is possible that removal of water facilitated by rye growth could allow for earlier planting and germination of the cash crop (Basche et al., 2016; Qi and Helmers, 2010; Unger and Vigil, 1998).
The impacts of both no-till and cover crops on soil moisture content and soil temperature are likely to be soil and climate specific, and relationships within a given soil and climate could change depending on precipitation, weather patterns, and length of time since conservation practice was implemented (Cox et al., 1990; Daigh et al., 2014; Jolly et al., 1983). The Major Land Resource Area (MLRA) of the north-central Iowa site has 9% of its corn-soybean acres under no-till, which is the lowest percentage of all MLRAs in Iowa (Iowa State University Science Team, 2013). There is a need for more high resolution (daily) patterns of soil moisture and temperature prior to and throughout the growing season of the cash crop for
10
One objective of this chapter was to quantify the impact of soil moisture and temperature in north-central Iowa with 2 different tillage practices, no-till and chisel plow, over a 5-year period. The second objective of this chapter was to quantify the impact of soil moisture and temperature in north-central Iowa and central Iowa with 2 different conservation practices, no-till and no-till with a winter rye cover crop, over a 5-year period.
Methodology
Site descriptions
The no-till vs. chisel plow study was conducted in Pocahontas County near Gilmore City, Iowa at the Agricultural Drainage Water Quality Research and Demonstration Site (ADW, 42°74′77″ N, 94°49′52″ W). Drainage monitoring began in 1989 and since then all plots have been in either continuous corn or corn-soybean rotation. Soils are clay loams (Nicollet, Webster, Canisteo) with 3 to 5% organic matter and are somewhat poorly to poorly drained. The research area is 3.8 hectares and contains 78 experimental plots total. The average slope is 0.5% to 1.0%. Each 0.05-hectare plot has a center drainage line 1.06 meters deep. Weather data were recorded and monitored using an automated meteorological data logger. This study’s rainfall and precipitation patterns were compared to long-term patterns as recorded by the National Climate Data Center station of Pocahontas, which is located 19 km west of ADW.
The no-till with rye vs. no-till study was conducted at both ADW and the Iowa State University Agronomy and Agricultural Engineering Research Farm (ISUAG, 42°00′94″ N, 93°78′06″ W). ISUAG is in Boone County, Iowa. Soils are clay loams (Clarion, Nicollet, Webster), and are moderately well, somewhat poorly, and poorly drained. This site also has a history of corn and soybean rotations, dating back to the early 1900s. The average slope is 0.5 to 1.5% and there is artificial subsurface drainage present, however the locations of drainage
11
lines are unknown. Weather data were recorded via the Agronomy and Agricultural Engineering Farm Station of the Environmental Mesonet Iowa State University Agricultural Climate Series (IEM, 2016) and normal precipitation and temperature patterns were gathered from National Climate Data Center station of Ames Municipal Airport, Iowa, located 5 km northeast of ISUAG.
At ADW, both studies began in the fall of 2010, or the crop year of 2011. No-till and cover crops started in 2009, and 2010 was considered a transition year. Before 2009, all plots were conventionally tilled. The treatments are: chisel plow before corn (CT-C) and before soybean (CT-S), no tillage before corn (NT-C) and before soybean (NT-S), and no tillage with rye before corn (NTr-C) and before soybean (NTr-S) (Table II-1). Each plot was in a corn-soybean rotation, with the whole plot in either corn or corn-soybean each year. Winter cereal rye
(secale cereal L.) was drill-seeded at a rate of 100 kg ha-1 just following harvest each fall. Rye
was collected for measurement shortly before it was killed using glyphosate [(N-phosphonomethyl) glycine] in the spring. Rye was killed no less than 2 weeks prior to planting corn. N fertilizer was uniform over all treatments. Field operations are shown in Table II-2. This experiment was a completely randomized block design. The experimental plots were grouped into four blocks based on long-term drainage intensity: high, high, medium-low, and medium-low, as recorded from 1989-2004. One plot in each drainage block was randomly assigned a treatment (6 treatments x 4 blocks = 24 plots).
At ISUAG, cover crops were first planted in 2008, prior to the crop year 2009. The treatments were: no tillage before corn (NT-C) and before soybean (NT-S), and no tillage with rye before corn (NTr-C) and before soybean (NTr-S). Rye was drill-seeded after each harvest
12
per treatment (4 treatments x 4 plots = 16 plots). For both ADW and ISUAG, rye biomass data were reported from all 4 replications of each treatment, whereas soil moisture and temperature data were reported from only 2 replications of each treatment (further explanation below).
Decagon Em50 5TM soil moisture and temperature sensors were installed in two plots within a treatment at ADW and ISUAG. At ADW, the plots were in blocks 2 and 3 (medium-high and medium-low drainage intensity) midway between tile drains. The sensors were installed at a depth of 10 cm and 20 cm. To install sensors, an auger was used to excavate a hole in the quarter-plant-row position as described in Daigh et al. (2014). Volumetric water content and soil temperature were recorded at 5 minute intervals throughout the entire year. Gupta et al. (1983) states the importance of daily measurements over an entire season rather than only a couple of days of measurements to define the relationship of tillage or residue treatments and soil moisture or soil temperature.
Data processing and statistical analysis
Van Wijk et al. (1959), Burrows and Larson (1962), and Fortin and Pierce (1990) explain that daily maximum temperatures can be largely affected by residue cover while minimum temperature is not. Thus, this study used daily average for soil moisture and daily maximum for soil temperature, but several steps of data processing were done first. The first data processing step was removing the frozen data (both temperature and the corresponding soil water content). Data was considered frozen if the temperature reading was less than 1 degree Celsius. Next, 5-minute readings were averaged to hourly aggregates. From the hourly aggregates, daily average soil moisture content and daily maximum temperature were calculated only if 75% (or 18 hours) of the hourly data were present. This was to ensure an accurate representation of fluctuation of moisture and temperature throughout each day.
13
Within each year, three periods of interest were established. Period 1 was March 1 to planting of a cash crop. This represents a) the active growth and transpiration of a cover crop (NT vs. NTr studies) or b) solely the cover of residue from the previous year’s crop (NT vs. CT study). Period 2 was the planting of a cash crop to July 1st. This represents the planting, emergence, and active growth of the cash crop prior to canopy. Period three is July 1st to August 31st. Period 3 represents the growth of the cash crop after canopy, when drainage has typically stopped and moisture contents decrease due to plant water uptake. It was important to separate the growing cash crop between period 2 and 3 because there is a possibility that moisture and temperature relationships in relation to residue could change with the shading from the cash crop (Gupta et al., 1983). Similar periods have been used in other literature with a high number of soil moisture data recordings (Basche et al., 2016; Daigh et al., 2014; Goeken, 2013).
Temperature and soil moisture data were analyzed using the generalized linear mixed model (GLIMMIX) in SAS (SAS, 2012). Proc GLIMMIX was chosen because of its ability to handle missing data and the slicediff function. A random effects statement was included to account for this study using repeated measures. Each study and farm was analyzed separately and was analyzed by depth and year with fixed effects of period, rye presence, and cash crop. Least square means were calculated for each period and crop and then compared using a simple effect comparisons t-test.The temperature response variables were: temperature at 10 cm, 20 cm, and temperature from 0 to 30 cm. The soil water content response variables were: volumetric water content at 10 cm, 20 cm, and cm of soil water in the top 30 cm. To calculate
14
represented the entire section of 0 to 15 cm, and the 20-cm value represented the entire section of 15 to 30 cm.
Weather
ISUAG is southeast of ADW, and it has greater normal precipitation and greater normal temperatures (Table II-4 and Table II-5). There were unique precipitation distributions throughout the 5-year period. Notably, the drought of 2012 was one of the driest years since the 1950s at both sites (NOAA-NCDC, 2013). From May through August, ADW had 198 mm (normal is 466) (Table II-4), and ISUAG had 250 mm (normal is 476) (Table II-5). In contrast, in 2013 and 2014, both sites had low spring temperatures and intense late spring precipitation. In 2014, June precipitation was 1.8x (ISUAG) and 2.4x (ADW) the average amount.
Results and Discussion
Rye biomass
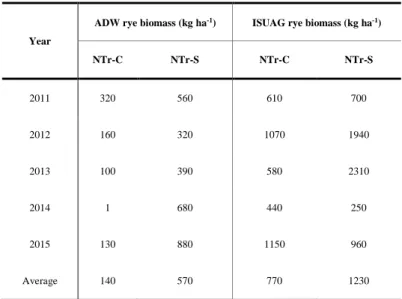
The aboveground rye biomass in this study averaged 140 kg ha-1 before corn and 570 kg ha-1 before soybean at ADW (Table II-6). At ADW, the rye biomass was greater in soybean
every year compared to corn, due to longer growth time in the spring (an average of 25 more days of growth in soybean). In a previous study from 2005 to 2009 at ADW, rye growth was on average 410 kg ha-1 before corn (as high as 910 kg ha-1) and 1,600 kg ha-1 before soybean (as high as 3,000 kg ha-1)(Qi et al., 2011). In the previous study, all plots were conventionally tilled, so decreased growth because of residue in NT plots combined with weather (high spring and October temperatures and precipitation) could explain the previous study’s higher rye biomass values. Examples of the correlation of low rye biomass and weather at ADW is further explained in chapter III.
15
The aboveground rye biomass at ISUAG was, on average, 770 kg ha-1 before corn and 1,230 kg ha-1 before soybean (Table II-6). At this site, there was an average of 11 days between terminating plots (ranging from 0 to 19) before corn and soybean. Biomass in plots going to corn were higher in 2015, despite being killed earlier. This cannot explained by monthly precipitation and temperature averages, but could be attributed to greater residue on the ground following corn or from low fall residual soil nitrate from the previous corn crop. Kaspar et al. (2012) also measured greater cover crop biomass following soybean compared to corn. The crop year of 2013 had the highest rye biomass in plots going to soybean at ISUAG. This correlated with a warm wet spring in 2013 (Table II-5), and relatively early seeding of rye in September of 2012 (Table II-3). The crop year of 2015 had the highest rye biomass in plots going to corn at ISUAG, correlating with a warm and wet October in 2014 (Table II-5). Pantoja et al. (2016) compiled results from 4 sites across Iowa over 2 crop-years and found a mean of 900 kg ha-1 of rye before corn and 1,020 kg ha-1 of rye before soybean. They found a correlation of low biomass with cooler climates, shorter springs, and low post harvest soil nitrate. Higher rye biomass at ISUAG compared to ADW is likely due to a shorter growing period for rye from earlier fall freezes and later spring thaws at ADW.
Impact of NT on soil moisture
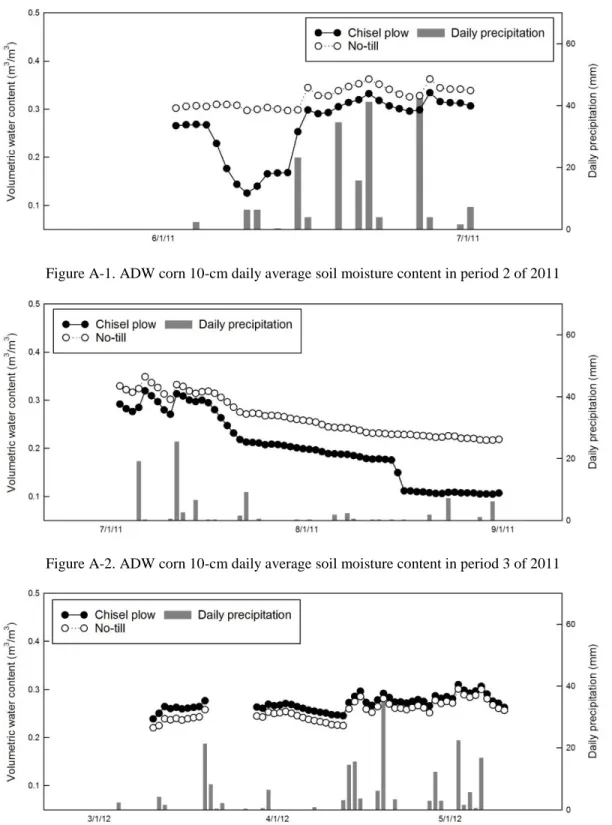
Period means of daily average volumetric water content and soil water for CT and NT at ADW are summarized in Table II-7. Daily means of volumetric water content and soil water for CT and NT at ADW are presented by period in Appendix A. Corn residue (in a soybean crop year) impacted soil moisture at the 10-cm depth more than soybean residue (example in Figure II-1 and Figure II-2). Soybean residue (a corn crop year) with NT did not significantly
16
(Table II-7). Over the five years, NT-S (under corn residue) had 0.043 m3 m-3 greater mean 10-cm moisture content in period 1 (p=0.05) and 0.044 m3 m-3 greater in period 2 (p=0.05) than CT-S (Table II-7). Soil moisture content at the 20-cm depth was less impacted than the 10-cm depth (Figure II-3 and Figure II-4).
In a wet spring (period 1 in 2013) at ADW, NT-C had 0.050 m3 m-3 higher moisture content at 10 cm (p=0.09) compared to CT-C and NT-S had 0.090 m3 m-3 higher moisture content at 10 cm (p=0.01) compared to NT-S (Figure II-1 and Figure II-2) (Table II-7). The summer of 2013 was very dry and NT-S retained significantly higher 10-cm soil moisture content compared to CT-S in period 2 (0.104 m3 m-3 difference; p=0.004) and period 3 (0.062
m3 m-3 difference; p=0.05) (Figure II-5 and Figure II-6) (Table II-7). The differences measured over the 5-year average in this study in NT in the top 10-cm in the period prior to planting (0.010 m3 m-3 greater in NT before corn and 0.043 m3 m-3 greater in NT before soybean) are
similar to what Johnson et al. (1984) found (a difference of 0.045 m3 m-3) at 7.6 cm prior to planting over a three-year period in continuous corn. The volumetric water contents during the beginning of the growing season (period 2) in this study at ADW averaged over 5 years were, 0.317 m3 m-3 in NT compared to 0.273 m3 m-3 in CT with soybean (under corn residue). This study found a greater change in moisture content under corn residue than Johnson et al. (1984) who observed a deficit of 0.011 m3 m-3 in CT compared to NT during the growing season in continuous corn. The differences during the beginning of the growing season (period 2) with corn (under soybean residue) averaged over 5 years were 0.300 m3 m-3 in NT compared to 0.288 m3 m-3 in CT.
17
Impact of NT on soil temperature
Period means of maximum soil temperature for CT and NT at ADW are summarized in Table II-8. Daily maximums of soil temperature for CT and NT at ADW are presented by period in Appendix B. Temperature was less affected than moisture. In periods 1 and 2, CT-S was frequently higher in daily maximum soil temperature in the top 30 cm than NT-S (Figure II-7 and Figure II-8), and were the same by period 3 (Figure II-9). Johnson and Lowery (1985) also found that temperature differences disappeared by June. On average, the differences between tillage treatment were less than 1 degree Celsius (Table II-8). Gupta et al. (1983) considered differences to be minor if they are less than 3 degrees Celsius. However, Walker (1969) states that 1 degree Celsius difference can impact corn growth. Overall, the temperature differences measured at ADW were smaller than those found in other studies. In a 9-year study in Indiana, Griffith et al. (1988) found the 4-week daily average temperature reduction in corn following soybean was between 1 and 3 degrees Celsius in no-till compared to plow tillage. Kaspar et al. (1990) reported differences ranging from 4 to 6 degrees Celsius in the 20-day average maximum daily temperature in late spring. The largest decrease in temperature (4 degrees Celsius in period 1 2014) correlates with the largest decrease in corn yield with no-till (yields for ADW are presented in chapter III). Aside from this instance in Period 1 of 2014 (a cold and wet spring), there were several occasions where temperatures were lower with no-till with corn residue, but not soybean residue (Figure II-10 and Figure II-11). Several studies state that soybean residue impacts soil temperature less than corn residue (Erbach, 1982; Griffith et
18
Impact of rye on soil moisture
Period means of daily volumetric water content and soil water for NT and NTr at ADW are summarized in Table II-9. Daily means of volumetric water content and soil water for NT and NTr at ADW are presented by period in Appendix C. At ADW, at both 10-cm and 20-cm depths, in both corn and soybean phases, soil moisture with NTr was commonly lower than with NT in periods 1 and 2 (Figures II-12 through II-15) but this effect was more significant at the 20-cm depth (Table II-9). This is likely due to increased transpiration and rye depleting the 20-cm soil water in period 1. Soil moisture content was depleted at the 20-cm depth for both NTr-S and NTr-C compared to NT, despite the lower biomass in NTr-C (Table II-6). When averaged over all 5 years, the 20-cm depth soil water content was 0.039 m3 m-3 lower in plots with rye in period 1 before corn (p=0.04), and 0.032 m3 m-3 lower in plots with rye in period 1 before soybean (p=0.08) (Table II-9). In period 2, when rye was no longer transpiring, at the 20-cm depth, and when averaged over all 5 years, the soil moisture content was still 0.036 m3 m-3 (corn; p = 0.06) and 0.038 m3 m-3 (soybean; p = 0.05) lower in plots with rye.
Although the 10-cm moisture content was commonly lower in NTr plots compared to NT, this was rarely significant (Table II-9). This suggests that perhaps evaporation was decreased from the mulch effect, but not great enough to cancel out the effects of increased transpiration.
Period means of daily volumetric water content and soil water for NT and NTr at ISUAG are summarized in Table II-10. Daily means of volumetric water content and soil water for NT and NTr at ISUAG are presented by period in Appendix E. At ISUAG, when averaged over all 5 years, rye significantly increased soil water in the top 30 cm before corn in periods 1 (1.27 cm increase, p=0.05) and 2 (1.19 increase, p=0.07) (Table II-10). The greatest increase in NTr compared to NT before corn was in all three periods in year 2015, a wet year (Figure
19
II-16, Figure II-17, and Figure II-18). This year also had the greatest rye growth before corn (1150 kg ha-1; Table II-6). The most pronounced increase in top 30-cm soil water in NTr-S compared to NT-S was in periods 1 and 2 in 2012, a drought year (Figure 19 and Figure II-20). Similar to what was observed by Daigh et al. (2014) and Basche et al. (2016), even during period 1 when rye was depleting moisture because of transpiration, soil moisture was recharged in rye plots after a precipitation event in both wet and dry springs (Figure 21 and Figure II-22).
One of the reasons ISUAG retained more soil water in the top 30 cm, while ADW did not, is likely the amount of rye growth. Studies that found similar rye biomass to ADW (Daigh et al., 2014; Krueger et al., 2011; Qi and Helmers, 2010) reported no increase in soil water. Studies with greater rye biomass than ADW and as much as ISUAG (Basche et al., 2016; Daigh et al., 2014) reported an increase in soil water. In a study in Boone County, IA, Basche et al. (2016) measured 0.03-0.04 m3 m-3 lower soil moisture content in cover crop plots on individual spring days when the cover crop was growing, but no significant difference by the time cash crop was planted. Once the cash crop was growing and up to July 10th, Basche et al. (2016) found greater water content means with the cover crop (around 0.02 – 0.03 m3 m-3) through the summer period. They attribute greater soil water content to decreased soil evaporation, increased aggregation, and increased organic matter resulting in increased infiltration (Jokela et al., 2009; Moore et al., 2014; Unger and Vigil, 1998). In theory, all of these soil properties would increase with an increase in rye shoot or root growth, but may be possibly overshadowed by transpiration.
20
content was not significantly impacted in NTr-S plots compared to NT-S plots at the 10-cm depth or 20-cm depth in period 1 of 2015 (Table II-10). However, ADW soil moisture content had a 0.048 m3 m-3 decrease in rye plots at 20-cm (p=0.07), and no significant difference at 10 cm in this same period (Table II-9). ISUAG generally had between 2x and 9x greater rye biomass than ADW throughout the study (Table II-6). ADW had similar rye biomass to ISUAG in 2015 but still significantly lower soil moisture at the 20-cm depth compared to NT. This suggests that one year of relatively high rye biomass is not enough to promote an increase in soil water with rye in that year because ISUAG and ADW soil water responded differently despite having similar rye biomass. Soil water holding capacity is impacted by presence of organic matter, soil aggregation, and soil porosity (Emerson, 1995; Hudson, 1994; Kay, 1998).
Long-term higher biomass of rye at ISUAG could have increased these soil properties over time, thus increasing soil water holding capacity, which could explain the results of this study.
Impact of rye on soil temperature
Period means of maximum soil temperature for NT and NTr at ADW are summarized in Table II-11. Daily maximums of soil temperature for NT and NTr at ADW are presented by period in Appendix D. Period means of maximum soil temperature for NT and NTr at ISUAG are summarized in Table II-12. Daily maximums of soil temperature for NT and NTr at ISUAG are presented by period in Appendix F. There is considerable literature on the impact of crop residue on temperature, but not in the context of a growing mulch such as a cover crop. Residue on the surface increases resistance to heat and vapor transfer, which can lead to maintaining cooler temperatures in the spring (Horton et al., 1994; Sauer et al., 1996). At ADW, temperature differences were rarely significant, but NTr-S had significantly higher temperatures than NT-S plots in 2012 and 2013 (two very dry years) (Table II-11). At ISUAG,
21
temperature differences were rarely significant (Table II-12). Temperatures were significantly higher at ISUAG in NTr-C compared to NT-C during periods 2 and 3 in 2013, which was a very dry summer.
Discussion and Conclusion
This study illustrates how no tillage influences soil moisture and temperature in north-central Iowa over 5 different weather patterns observed throughout a 5-year period. NT increased daily average soil moisture content and decreased maximum daily soil temperature most significantly at the 10-cm depth under corn residue (soybean crop year). Increases in soil moisture under NT corn residue, compared to chisel plow, had a five-year soil moisture content average of 0.043 m3 m-3 in period 1, 0.044 m3 m-3 and period 2, and 0.026 m3 m-3 in period 3. Decreases in daily maximum soil temperature under NT corn residue, compared to chisel plow, had a five-year average of 0.5 degrees C in period 1, 0.9 degrees C in period 2, and 0.2 degrees C in period 3. These increases in soil moisture (similar in magnitude to other studies) and decreases in soil temperature (lower in magnitude compared to other studies) likely contribute to the yield decreases found in NT plots. Yield data is presented in chapter III.
This study also illustrated how cover crops can influence soil water and temperature at two different Iowa sites over a 5-year period. At ADW, the north-central site with minimal rye growth, rye decreased soil moisture content at the 20-cm depth. The decrease in soil moisture at the 20-cm depth was present over most periods (despite the cover crop being terminated), and was often significant in both corn and soybean. This depletion at 20-cm is likely due to water uptake from rye roots in the first period, and not enough rye biomass to increase soil water holding capacity or the mulching effect in later periods. At this site, 10-cm
22
were significant, rye plots had less moisture than plots without rye. Although the reductions in soil moisture were significant, no soil moisture content when averaged over the top 30 cm was below wilting point, which Or et al. (2012) states is 15% for clay loams. This suggests that the lesser moisture contents associated with NTr at ADW could improve spring trafficability without compromising summer crop growth due to lack of water.
At ISUAG, the site with greater rye growth, rye increased soil moisture content at both the 10-cm and 20-cm depth (also combined as soil water in the top 30 cm). Soil water in the top 30 cm was either very similar (within 0.32 cm) in plots with and without rye or significantly greater in rye plots. Soil temperature was rarely impacted by the presence of rye at either site. Although the results found between the two different studies appear to contradict each other, i.e. increase in soil water from rye (ISUAG) and decrease in soil water from rye (ADW), it supports the compiled literature stating that amount of rye biomass affects the impact of rye on soil water. Future research should emphasize promoting rye biomass in a northern climate such as ADW.
23
References
Aldarby A.M., Lowery B. (1986) Evaluation of corn growth and productivity with 3 conservation tillage systems. Agronomy Journal 78:901-907.
Aldarby A.M., Lowery B. (1987) Seed zone soil-temperature and early corn growth with 3 conservation tillage systems. Soil Science Society of America Journal 51:768-774. Allmaras R.R., Burrows W.C., Larson W.E. (1964) Early growth of corn as affected by soil
temperature. Soil Sci Soc Amer Proc 28:271-275.
Basche A.D., Kaspar T.C., Archontoulis S.V., Jaynes D.B., Sauer T.J., Parkin T.B., Miguez F.E. (2016) Soil water improvements with the long-term use of a winter rye cover crop. Agricultural Water Management 172:40-50. DOI: 10.1016/j.agwat.2016.04.006. Beauchamp E.G., Lathwell D.J. (1967) Root-zone temperature effects on early development
of maize. Plant and Soil 26:224-+. DOI: 10.1007/bf01880173.
Burrows W.C., Larson W.E. (1962) Effects of amount of mulch on soil temperature and early growth of corn. Agronomy Journal 54:19-24.
Coelho D.T., Dale R.F. (1980) An energy-crop growth variable and temperature function for predicting corn growth and development - planting to silking. Agronomy Journal 72:503-510.
Cox W.J., Zobel R.W., Vanes H.M., Otis D.J. (1990) Tillage effects on some soil physical and corn physiological-characteristics. Agronomy Journal 82:806-812.
Daigh A.L., Helmers M.J., Kladivko E., Zhou X., Goeken R., Cavdini J., Barker D., Sawyer J. (2014) Soil water during the drought of 2012 as affected by rye cover crops in fields in Iowa and Indiana. Journal of Soil and Water Conservation 69:564-573. DOI: 10.2489/jswc.69.6.564.
Emerson W.W. (1995) Water-retention, organic-c and soil texture. Australian Journal of Soil Research 33:241-251. DOI: 10.1071/sr9950241.
Erbach D.C. (1982) Tillage for continuous corn and corn-soybean rotation. Transactions of the Asae 25:906-&.
Ewing R.P., Wagger M.G., Denton H.P. (1991) Tillage and cover crop management effects on soil-water and corn yield. Soil Science Society of America Journal 55:1081-1085. Fortin M.C., Pierce F.J. (1990) Developmental and growth effects of crop residues on corn.
Agronomy Journal 82:710-715.
Goeken R. (2013) Effects of perennial and cover crops on hydrology in Iowa Sustainable Agriculture, Iowa State University Ames, Iowa.
Griffith D.R., Kladivko E.J., Mannering J.V., West T.D., Parsons S.D. (1988) Long-term tillage and rotation effects on corn growth and yield on high and low organic matter, poorly drained soils. Agronomy Journal 80:599-605.
Griffith D.R., Mannering J.V., Box J.E. (1986) Soil and moisture management with reduced tillage.
Gupta S.C., Larson W.E., Linden D.R. (1983) Tillage and surface residue effects on soil upper boundary temperatures. Soil Science Society of America Journal 47:1212-1218. Horton R., Kluitenberg G.J., Vristow K.L. (1994) Surface crop residue effects on the soil
surface energy balance.
Hudson B.D. (1994) Soil organic-matter and available water capacity. Journal of Soil and Water Conservation 49:189-194.
24
Imholte A.A., Carter P.R. (1987) Planting date and tillage effects on corn following corn. Agronomy Journal 79:746-751.
Iowa State University Science Team. (2013) Iowa science assessment of nonpoint source practices to reduce nitrogen and phosphorus transport in the Mississippi River basin, Ames, Iowa
Johnson M.D., Lowery B. (1985) Effect of 3 conservation tillage practices on soil-temperature and thermal-properties. Soil Science Society of America Journal 49:1547-1552. Johnson M.D., Lowery B., Daniel T.C. (1984) Soil-moisture regimes of 3 conservation tillage
systems. Transactions of the Asae 27:1385-&.
Jokela W.E., Grabber J.H., Karlen D.L., Balser T.C., Palmquist D.E. (2009) Cover crop and liquid manure effects on soil quality indicators in a corn silage system. Agronomy Journal 101:727-737. DOI: 10.2134/agronj2008.0191.
Jolly R.W., Edwards W.M., Erbach D.C. (1983) Economics of conservation tillage in Iowa. Journal of Soil and Water Conservation 38:271-294.
Kaspar T.C., Crosbie T.M., Cruse R.M., Erbach D.C., Timmons D.R., Potter K.N. (1987) Growth and productivity of 4 corn hybrids as affected by tillage. Agronomy Journal 79:477-481.
Kaspar T.C., Erbach D.C., Cruse R.M. (1990) Corn response to seed-row residue removal. Soil Science Society of America Journal 54:1112-1117.
Kaspar T.C., Jaynes D.B., Parkin T.B., Moorman T.B., Singer J.W. (2012) Effectiveness of oat and rye cover crops in reducing nitrate losses in drainage water. Agricultural Water Management 110:25-33. DOI: 10.1016/j.agwat.2012.03.010.
Kay B.D. (1998) Soil structure and organic carbon: a review CRC Press Inc., Boca Raton,. Krueger E.S., Ochsner T.E., Porter P.M., Baker J.M. (2011) Winter rye cover crop
management influences on soil water, soil nitrate, and corn development. Agronomy Journal 103:316-323. DOI: 10.2134/agronj2010.0327.
Logsdon S.D., Reneau R.B., Parker J.C. (1987) Corn seedling root-growth as influenced by soil physical-properties. Agronomy Journal 79:221-224.
Mackay A.D., Barber S.A. (1985) Soil-moisture effects on root-growth and phosphorus uptake by corn. Agronomy Journal 77:519-523.
Miedema P. (1982) The effects of low-temperature on zea-mays. Advances in Agronomy 35:93-128. DOI: 10.1016/s0065-2113(08)60322-3.
Moore E.B., Wiedenhoeft M.H., Kaspar T.C., Cambardella C.A. (2014) Rye cover crop effects on soil quality in no-till corn silage-soybean cropping systems. Soil Science Society of America Journal 78:968-976. DOI: 10.2136/sssaj2013.09.0401.
Mulumba L.N., Lal R. (2008) Mulching effects on selected soil physical properties. Soil & Tillage Research 98:106-111. DOI: 10.1016/j.still.2007.10.011.
NOAA-NCDC. (2013) Drought - July 2012.
Or D., Wraith J.M., Robinson D.A., Jones S.B. (2012) Soil water content and water potential relationships CRC Press, Taylor and Francis Group, Boca Raton, FL.
Pantoja J.L., Woli K.P., Sawyer J.E., Barker D.W. (2016) Winter rye cover crop biomass production, degradation, and nitrogen recycling. Agronomy Journal 108:841-853. DOI: 10.2134/agronj2015.0336.
Qi Z.M., Helmers M.J. (2010) Soil water dynamics under winter rye cover crop in central Iowa. Vadose Zone Journal 9:53-60. DOI: 10.2136/vzj2008.0163.
25
Qi Z.M., Helmers M.J., Christianson R.D., Pederson C.H. (2011) Nitrate-nitrogen losses through subsurface drainage under various agricultural land covers. Journal of Environmental Quality 40:1578-1585. DOI: 10.2134/jeq2011.0151.
SAS. (2012) The SAS systems for Windows SAS Institute, Inc. , Cary, North Carolina, USA Sauer T.J., Hatfield J.L., Prueger J.H. (1996) Corn residue age and placement effects on evaporation and soil thermal regime. Soil Science Society of America Journal 60:1558-1564.
Shaw R.H. (1977) Climatic Requirement Agronomy Journal 18:591-623. Steiner J.L. (1994) Crop residue effects on water conservation.
Swan J.B., Kaspar T.C., Erbach D.C. (1996) Seed-row residue management for corn establishment in the northern U.S. corn belt. Soil & Tillage Research 40:55-72. DOI: 10.1016/s0167-1987(96)01046-x.
Unger P.W., Vigil M.F. (1998) Cover crop effects on soil water relationships. Journal of Soil and Water Conservation 53:200-207.
Van Wijk W.R., Larson W.E., Burrows W.C. (1959) Soil temperature and the early growth of corn from mulched and unmulched soil. Soil Sci Soc Amer Proc 23:428-434.
Walker J.M. (1969) One-degree increments in soil temperatures affect maize seedling behavior. Soil Sci Soc Amer Proc 33:729-736.
26
Tables
Table II-1. Treatments for crop-years 2011-2015. All plots were in a corn-soybean rotation.
Site Treatment Spring
Cover Crop
Fall Tillage
Spring Tillage
ADW CT-S fallow soybean chisel plow field
cultivation
ADW & ISUAG NT-S fallow soybean no-till no-till
ADW & ISUAG NTr-S winter cereal rye soybean no-till no-till
ADW CT-C fallow corn chisel plow field
cultivation
ADW & ISUAG NT-C fallow corn no-till no-till
27
Table II-2. Field operations from 2011 to 2015 at ADW.
Operation at ADW 2011 Crop 2012 Crop 2013 Crop 2014 Crop 2015 Crop
Drill-seed rye in corn residue
100 kg ha-1 10/13/2010 10/12/2011 10/12/2012 10/31/2013 10/16/2014
Drill-seed rye in soybean residue
100 kg ha-1 10/13/2010 10/12/2011 10/8/2012 10/31/2013 10/16/2014
Chisel plow CT 11/29/2010 11/17/2011 11/13/2012 11/21/2013 11/10/2014 Collect rye in plots going to corn 4/28/2011 4/10/2012 4/25/2013 4/17/2014 4/16/2015
Terminate rye in plots going to
corn 5/2/2011 4/12/2012 4/25/2013 4/17/2014 4/17/2015 Field cultivate CT-C 5/9/2011 5/8/2012 5/13/2013 5/7/2014 4/29/2015 Plant corn 5/10/2011 5/10/2012 5/14/2013 5/7/2014 4/30/2015 Collect rye in plots going to
soybean 5/9/2011 5/9/2012 5/22/2013 5/20/2014 5/12/2015 Terminate rye in plot going to
soybean 5/11/2011 5/9/2012 5/23/2013 5/20/2014 5/15/2015 Field cultivate CT-S 5/9/2011 5/8/2012 6/6/2013 5/22/2014 4/29/2015 Plant soybean 5/11/2011 5/16/2012 6/6/2013 5/22/2014 5/28/2015 Apply aqua ammonia to corn
(168 kg N ha-1) 6/16/2011 6/19/2012 6/13/2013 6/24/2014 6/26/2015
Harvest soybean 10/6/2011 9/25/2012 10/21/2013 10/16/2014 10/12/2015 Harvest corn 10/12/2011 10/4/2012 10/29/2013 10/8/2014 10/20/2015
28
Table II-3. Fields operations from 2011 to 2015 at ISUAG.
Operation at ISUAG 2011 Crop 2012 Crop 2013 Crop 2014 Crop 2015 Crop
Drill-seed rye in soybean residue
63 kg ha-1 10/5/2010 10/3/2011 9/20/2012 10/2/2013 9/30/2014
Drill-seed rye in corn residue
63 kg ha-1 10/5/2010 10/6/2011 9/20/2012 10/10/2013 10/22/2014
Collect rye in plots going to corn 4/29/2011 4/6/2012 4/25/2013 5/5/2014 4/29/2015 Terminate rye in plots going to
corn 5/2/2011 4/6/2012 4/27/2013 5/6/2014 4/29/2015 Plant corn 5/10/2011 4/26/2012 5/17/2013 5/19/2014 5/13/2015 Collect rye in plots going to
soybean 5/8/2011 4/25/2012 5/15/2013 5/5/2014 5/8/2015 Terminate rye in plots going to
soybean 5/10/2011 4/25/2012 5/15/2013 5/6/2014 5/9/2015 Plant soybean 5/10/2011 5/11/2012 5/24/2013 5/20/2014 5/23/2015 Apply UAN 134 kg N ha-1
to corn 5/19/2011 5/11/2012 6/13/2013 6/11/2014 6/2/2015 Sample corn canopy 7/8/2011 6/25/2012 7/10/2013 6/10/2014 7/7/2015 Harvest soybean 9/30/2011 9/19/2012 10/2/2013 9/30/2014 10/14/2015
29
Table II-4. Weather at ADW.
Month
Average Precipitation (mm) Average Air Temperature (degrees Celsius)
2010 2011 2012 2013 2014 2015 Normal* 2010 2011 2012 2013 2014 2015 Normal* Jan 0 3 4 0 3 23 -10.7 -4.2 -7.2 -10.4 -6.5 -8.4 Feb 29 40 7 8 0 20 -6.3 -2.7 -5.3 -11.5 -10.1 -5.7 Mar 6 47 17 6 18 53 0.1 9.7 -2.8 -1.9 2.9 1.1 Apr 86 125 198 122 125 85 7.6 10.9 5.4 7.6 10.1 8.8 May 102 50 186 87 131 104 14.9 18.2 14.0 15.7 15.0 15.5 Jun 185 94 81 302 154 124 21.0 22.3 20.4 20.9 20.9 21.1 Jul 73 29 46 36 48 119 24.9 24.9 22.6 20.0 22.1 22.9 Aug 22 25 36 154 224 119 21.1 20.8 21.6 21.2 19.7 21.6 Sep 24 52 11 78 51 73 14.8 16.0 18.8 16.1 19.4 16.9 Oct 14 4 39 54 39 33 53 11.2 11.0 8.3 9.4 9.8 11.0 9.9 Nov 3 8 12 35 6 81 45 2.0 2.9 3.3 0.0 -1.3 4.1 1.4 Dec 6 25 14 1 0 46 32 -7.9 -2.8 -3.8 -9.7 -4.1 1.2 -6.4 Annual 565 529 676 839 913 852
*From: Climatological Data for Iowa, National Climate Data Center for Pocahontas, Iowa 1981-2010
Table II-5. Weather at ISUAG. Month
Average precipitation (mm) Average air temperature (degrees Celsius)
2010 2011 2012 2013 2014 2015 Normal* 2010 2011 2012 2013 2014 2015 Normal* Jan 7 3 3 1 20 19 8 4.3 5.2 6.5 3.6 -6.8 Feb 3 7 2 7 6 24 6.4 3.5 4.9 10.2 9.7 -4.1 Mar 4 12 11 5 2 53 2.6 3.3 3.4 4.5 3.3 2.7 Apr 103 118 128 117 66 87 7.4 9.8 6.5 8.6 8.8 9.8 May 117 63 180 108 115 117 15.9 19.5 15.7 16.6 16.7 15.8 Jun 128 75 77 225 175 128 21.7 22.8 21.3 21.7 21.5 21.1 Jul 99 37 26 73 151 119 25.7 26.4 23.2 20.9 22.6 23 Aug 91 75 55 145 209 112 22.6 22.3 22.9 22.4 20.9 21.7 Sep 51 47 30 140 128 77 16.5 18.1 20.4 17.6 20.9 17.1 Oct 12 22 59 64 95 32 65 13.3 12.9 10.5 11.2 11.7 12.4 10.4 Nov 58 68 23 35 26 69 53 4 5.2 5.1 1.7 -0.6 6 2.4 Dec 20 57 26 9 30 132 26 -6.5 -0.5 -2.2 -7.8 -1.5 0.5 -4.9 Annual 751 543 618 972 1107 881
30
Table II-6. Rye biomass before corn and soybean at ADW and ISUAG
Year
ADW rye biomass (kg ha-1) ISUAG rye biomass (kg ha-1)
NTr-C NTr-S NTr-C NTr-S 2011 320 560 610 700 2012 160 320 1070 1940 2013 100 390 580 2310 2014 1 680 440 250 2015 130 880 1150 960 Average 140 570 770 1230