See discussions, stats, and author profiles for this publication at: https://www.researchgate.net/publication/332170086
Classification of EMG Signal for Health Screening Task for Musculoskeletal
Disorder
Article in International Journal of Engineering and Technology · January 2019 DOI: 10.14419/ijet.v8i1.7.25980 CITATIONS 0 READS 144 6 authors, including:
Some of the authors of this publication are also working on these related projects:
Electrical and Electronic View project
Finger vein Biometric Identification SystemView project Tengku Nor Shuhada Tengku Zawawi
Technical University of Malaysia Malacca
16PUBLICATIONS 48CITATIONS
SEE PROFILE
Abdul Rahim Abdullah
Technical University of Malaysia Malacca
171PUBLICATIONS 691CITATIONS
SEE PROFILE Rubita Sudirman
Universiti Teknologi Malaysia
161PUBLICATIONS 526CITATIONS
SEE PROFILE
Ezreen Farina Shair
Technical University of Malaysia Malacca
31PUBLICATIONS 125CITATIONS
SEE PROFILE
All content following this page was uploaded by Tengku Nor Shuhada Tengku Zawawi on 03 April 2019. The user has requested enhancement of the downloaded file.
Copyright © 2019 Authors. This is an open access article distributed under the Creative Commons Attribution License, which permits unrestricted use, distribution, and reproduction in any medium, provided the original work is properly cited.
International Journal of Engineering & Technology
Website: www.sciencepubco.com/index.php/IJET
Research paper
Classification of EMG Signal for Health Screening Task for
Musculoskeletal Disorder
Tengku Nor Shuhada Tengku Zawawi
1*, Abdul Rahim Abdullah
2, Rubita Sudriman
3, Norhashimah Mohd Saad
4,
Jingwei Too
5, Ezreen Farina Shair
61,2,4,5,6
Center for Robotics and Industrial Automation (CeRIA), Faculty of Electrical Engineering, Universiti Teknikal Malaysia Melaka (UTeM), Malaysia
3
School of Electrical Engineering, Faculty of Electrical Engineering, Universiti Teknologi Malaysia, Malaysia. *Corresponding author E-mail: tgnorshuhadatgzawawi@gmail.com
Abstract
Electromyography signal analysis and classification method for Health Screening Program for Social Security Organisation (SOCSO) Malaysia is the first time applied using time-frequency distribution (TFD). This paper presents the classification of EMG signals for health screening task for musculoskeletal disorder. A time-frequency method, i.e spectrogram is employed to obtain the data of time and frequency information of the EMG signal. Four machine learning classifier of k-Nearest Neighbor (k-NN), Linear Discriminant Analysis (LDA), Naïve Bayes (NB) and Support Vector Machine (SVM) are implemented to EMG signal. Three out of six tasks (axial rotational task, kneeling reach and kneeling to standing back reach) which focused on the upper limb was performed using Multi Sensor Manage-ment ConsensysPRO and functional range on motion (FROM). From the experiManage-ment, SVM classifier is outperformed others using the purposed extracted features from spectrogram which is more than 80% except NB with 73.33%. The finding of the study concludes that SVM is suitable to classify EMG signal and can help rehabilitation center to diagnose their patients.
Keywords: Electromyography, Spectrogram, Machine learning classifier, Mean root mean square voltage.
1.
Introduction
Musculoskeletal Disorders (MSDs) are the second most common cause of disability in the work setting which give the impact of fatigue
and the productivity of the workers [1], [2]. Social Security Organisation(SOCSO) Malaysia has reported that 25% of the worker in
in-dustries continued to suffer from upper limb injuries [3]. SOCSO has classified occupational diseases into hearing impairment , muscu-loskeletal disorder, vibration disorder, skin diseases and occupational asthma. Statistic of industrial accidents in Malaysia recorded 57,639 cases compared to 55,186 for the previous year. The musculoskeletal disorder is one of the critical occupational injuries and dis-abilities. In 2016, it showed an increment of 174% from 31 to 85 cases [2]. The effect of MSDs can be progressed from mild to severe disorder [4], [5].
There has been an increasing effort in recent years to investigate the causes of MSDs and to take action to prevent them. It is important to know the method that able to detect the symptoms that will contribute to MSDs problem in the body [2]. Recent years, electromyogra-phy (EMG) is widely used in the analytical study, clinical and rehabilitation areas of electrical activity produced by skeletal muscles [6], [7]. EMG signal is different between persons, and changes depending on physical condition even for the same motion of the same person
[8]. Various techniques for handling EMG signals are used aspre-processing stages before the analysis and feature extraction to improve
the accuracy and response time of the data controller [5]. However, previous researchers found that it is difficult to obtain high accuracy in classifying in the data analysis process [9], [10].
The previous EMG researcher used time domain features in the classification of EMG signal because of its better processing sp eed and simplicity [11]. It can be directly extracted without need more mathematical transformation [12]. However, it does not contain spectral information and needs more features to be classified with higher accuracy [3], [13]. Frequency domain analysis as Fourier Transform to gain frequency information, but it is reasonable to approach stationary signal, not for non-stationary as an EMG signal with variable am-plitude and frequencies [14], [15]. Therefore, the time-frequency distribution is proposed to cater non-stationary signal. Wavelet Trans-form (WT) is one of the common techniques used for EMG analysis. This technique offers high time resolution for high-frequency com-ponent and high frequency resolution for low-frequency comcom-ponent such as transient [16], [17]. Though, this technique provides poor frequency resolution for high-frequency component and poor time resolution for low-frequency components as EMG signal. WT also has multi-resolution analysis and required neural network programming technique for classification which can increase computer memory and computational overhead due to the large number of features [18].
Nowadays, the application of machine learning is most significant in data mining. People are often to making mistakes analyse s and also trying to establish the relationship between multiple features [19]. The algorithms are very often helpful to classi fy and predict whether a document represents a positive or negative sentiment [20]. The extracted features have been classified into four groups based on the three types of tasks performed. Four approaches of sentiment classification are very often used in literature, also known as binary sentiment
220 International Journal of Engineering & Technology
classification and multi-class sentiment classification [21]. There are classifiers algorithm of k-Nearest Neighbor (k-NN), Linear Dis-criminant Analysis (LDA), Naïve Bayes (NB) and Support Vector Machine (SVM) are implemented to EMG.
k-Nearest Neigbor (k-NN) is a simple yet effective widely renowned, method in data mining. However, the actual application of this model in the big data domain is not achievable due to time and memory restrictions [22], [23]. Though, it has successfully been devel-oped in the real application, but with a large scale of the dataset. kNN needs to compute the distance (or similarity) of all training sam-ples for each test sample in the process of selecting k nearest neighbors where n is the size of the training dataset and d is the dimension-ality. It needs high cost because of the complexity is expensive for big data.
Linear Discriminant Analysis (LDA) is a statistical classification method which covers the boundary points and the different data points lie on the hyperplane. It is a common classification method used in EMG pattern recognition [24]. It is a supervised linear transformation based feature reduction strategy also able to provide information in high-dimensional feature vector to a low-dimensional space such that the ratio between maximised intra class scatter (within the class) SW and the inter class (between class) scatter SB [25]. The number of training samples are much lesser than the number of features and therefore the intra class scatter matrix would tend to be a singular ma-trix and the LDA computational will be so demanding [26].
Naïve Bayes (NB) is a machine learning method that predicts the density of the data set. NB is a truly qualified classifier due to its good behavior in the classification task [3], [27]. This class assumes class in independent conditions. Bayesian classifier predicts the probabil-ity of data belonging to a particular class. In order to predict probabilprobabil-ity, it uses the concept of Bayes’ theorem. Bayes’ theorem is useful in providing a way of calculating the posterior probability [28].
Support Vector Machine (SVM) classifiers are the most advanced ones, generally, designed to solve binary classification problems [27]. It just need small number of support vectors [29]. It is a well established machine learning method of classifying neuromuscular disease and pattern recognition process [30]. SVM has shown its superiority, especially for nonlinear and high dimensional pattern recognition [31]. However, the major drawbacks of the SVM are high computational time and selection of kernel function because its performance is based on the kernel function. Thus, it is one of the classify method can be used to classify the health screening task from t he chosen pa-rameter.
In this study, the performance of spectrogram is investigated to classify the tasks performed by the subject. The analysis will start with finding suitable features for EMG signal from spectrogram. Then, the features will be extracted from this method. The process continues with the classification method from machine learning. There are four different types of classification is used such as Naïve Bayes (NB), k-Nearest Neighbor (k-NN), Linear Discriminant Analysis (LDA) and Support Vector Machine (SVM) to classify the movement of the Health Screening Program. The finding of this research is able to assist SOCSO in evaluating the performances of their patients with more details compared to their current method.
2.
Procedure for data collection
One out of the five healthy subject with no previous injury from musculoskeletal disorder has selected to become the example of this paper’s scope which is to evaluate the classification method for EMG signal. The subject with 58 kg and 166 cm is proposed to perform the experiment. There are some procedures implemented in earlier experiment, which are skin preparation and electrode placeme nt based on the Surface EMG for non-Invasive Assessment of Muscles (SENIAM) standard.
Multi Sensor Management ConsensysPRO is used in configuring Shimmer sensors, streaming real-time data and managing collected data before the data analysis process. Shimmer sensor is interfacing with Consensys software to configure the data capture.
The acquired is filtered by using highpass filter. All the rest time are removed from the raw signal and exactly dataset is taken in the analysis process. For the data acquisition, the experiment would be performed to get the data before analysis would be a start. The se-lected method which is spectrogram is applied and four features have been extracted. There are four sese-lected features extracted from the signal which are the mean root mean square voltage (Vrms), mean frequency (MNF), Variance (VAR) and standard deviation (STD). After that, the classification of k-NN, DT, LDA and SVM were applied to investigate the best classification with highest accuracy per-formed from the task. Thus, the performance of the task is identified.
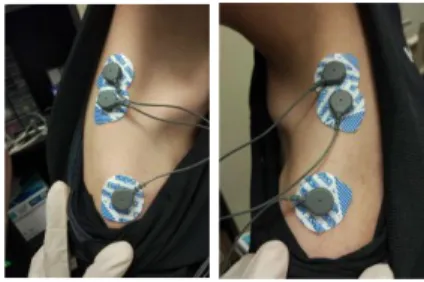
2.1. Electrode Placement
There are six muscles (upper limb) involved in this experiment which are as follows and Figure 1 shows the exact position of the muscles.
i. Right biceps brachii
ii. Left biceps brachii
iii. Right erector spinae (lumbar region)
iv. Left erector spinae (lumbar region)
v. Right Trapezius p. descendenz
vi. Right Trapezius p. descendenz
(d) (e)
Fig. 1: The positioning of the electrodes for EMG measurement (a) right biceps brachii, (b) left biceps brachii, (c) right and left erector spinae, (d) right trapezius and (e) left trapezius
2.2. Health screening task uses Functional Range of Motion
There are three tasks from six are selected to be tested in this research which are the axial rotational reach, kneeling reach and kneeling to standing back reach. Axial rotational reach is a function to determine a subject’s ability to perform axial rotation activities in a standing position and performing functional reaching. Kneeling reach is performed to determine a subject’s ability to perform kneeling activities with functional reaching and kneeling to standing back reach is to determine a subject’s ability to perform activities requiring going into and out of the kneeling position and performing functional reaching.
Functional Range on Motion (FROM) is used for Health Screening Task (HST). It consists of 6 panels from left to right: 1, 2, 3, 4, 5 and 6. Each of these panels contains 45 holes of 5 different colours and three zones: A, B and C. Three types of HST with selected features and four types of classification method are discussed in this paper and the detailed procedures for this task is described below:
2.2.1. Axial rotational reach
1) As in Figure 2, The client is instructed to move five rows of pegs from Panel 6 (Zone B) to Panel 4 (Zone B).
2) The client should stand in the center of the board assembly (approximately 15 inches from the panel) while performing the test in
order to achieve some back rotation.
3) The transfer process requires the subject to take the peg out of the hole with the left hand, transfer it to the right hand a nd then
place the peg into the corresponding hole with the right hand (forward order)
4) Take rest 2 minutes, then repeat step 1 to 3 until 5 times
Fig.2: Procedure of axial rotational reach (a) take the peg out with left hand and (b) place into corresponding hole with right hand 2.2.2. Kneeling reach
1) Figure 3 shows the client is instructed to move five rows of pegs from Panel 2 (Zone C) to the corresponding row of holes in
Pan-el 3 (Zone C).
2) The transfer process requires the client to take the peg out of the hole with the left hand, transfer it to the right hand and then place
the peg into the corresponding hole with the right hand.
3) The process starts with the highest level row and then proceeds in order to the lowest level row.
4) Repeat procedure 2 and 3 until FIVE (5) repetition.
222 International Journal of Engineering & Technology
2.2.3. Kneeling to standing and back reach
1) The client is instructed to move a row of pegs from Panel 2 (Zone C) at the lowest row to the next highest row directly above the
row from which the activity started as in Figure 4.
2) Only 3 pegs are used in this test. Two of the pegs must be moved with dominant hand and the third peg must be moved to the
non-dominant hand.
3) The client must be in the standing position before start placement of the pegs in the lowest row of Zone B.
4) Once the pegs have reached the top row in Zone B, a test repetition has been completed.
5) The client then continues to move the pegs downward, one row at a time employing the same process.
6) The client must return to the kneeling position before starts placement of the pegs into the highest row of Zone C. Upon reaching
the lowest row of holes in Zone C, another repetition has been completed. Forward Order
(a) (b) (c) (d)
Fig.4: Procedure of Kneeling to standing back reach (a) take the peg out with dominant hand in Zone C, (b) place into corresponding hole (Zone C), (c) stand to start placement of the pegs in the lowest row of Zone B and (d) standing position before start placement of the pegs in the lowest row of Zone B
3.
Method
3.1. Analysis of EMG Signal
The raw EMG signal is collected in the time domain, however, it can transform into the frequency domain using fast-Fourier transforms [3], [19]. FFT has the limitation which not able to cater non-stationary signal whose it the signal characteristic change in time and fre-quency [20], [21]. The visual representation of the frefre-quency spectrum for spectrogram is suitable to use because of the ability to over-come the imitation of FFT. EMG signals are transferred to time-frequency representation (TFR) and able to provide more information that needed to analyse the signal. EMG signal is really sensitive to noise, thus Hanning window is suitable to use because of its useful-ness for noise measurement with a better frequency resolution than some other windows [22]. Spectrogram with Hanning window 1024 was selected to be applied to each channel. Spectrogram formula can calculate as in (1):
(1)
where is the input signal and is referring to the observation window which is Hanning window function.
Spectrogram analysis is able to have superior accuracy in challenging task color model, which is having multiple color to ide ntify the magnitude, red for the highest magnitude and blue for the lower magnitude [23]. This technique roughly described on how frequency content changes over time. An optimum frequency resolution is useful for extracting features of any signals for further analysis, includ-ing EMG signals [24]. Smaller size window produces better time resolution, but reduces frequency resolution. The window width that has been chosen is maintained, which gives fixed frequency and time resolution for all frequencies. In this technique, the window size will affect time resolution and frequency resolution to produce the optimum presentation of the signal. The suitable size window should be selected for the optimum result of EMG signal because the fixed window will provide easier interpretation in terms of harmonics but effect on time-frequency resolution [27].
3.2. Feature Extraction
Features and extraction process is more crucial to know the suitable method for each different type of signal. Four types of features are chosen to present the information about the signals. There are the mean root mean square voltage (Vrms), mean frequency (MNF),
Vari-ance (VAR) and Standard Deviation (STD). All of this result also can be present in statistical method. Vrms is able to use for providing
fatigue features and energy information. (2) shows the Vrms expression as follow:
(2)
where S(t,f) is the time-frequency distribution and fmax is the maximum frequency of interest.
Mean (RMS) Voltage is used to indicate the strength of the muscle used in manual lifting task. Mean Vrms(t) is mentioned as (3):
(3)
4.
Result and discussion
In this part, the result of the experiment is presented. Data analysis using spectrogram and then features are extracted before proceed to the classification process. The spectral of the spectrogram is demonstrated. Four classifier method is applied to fou r different features to measure the performance of the best classifier due to the accuracy.
4.1. Time-frequency representation (TFR) of EMG Signal
The spectrogram in time-frequency representation (TFR) has provided information on time-frequency information. Figure 5 shows the flow of the result presented started from Figure 5 (a) is the raw signal for five repetitions of tasks performed, each signal is separated into each repetition, then it is divided it into two parts as Figure 5 (b). Part 1 is due to take the peg and part, then place the peg into the corre-sponding hole. Figure 5 (c) shows power spectral information. This example shows the highest amplitude of EMG signal is when the time is at 0.042 minutes with frequency 80 Hz. This frequency is acceptable, as the previous study reported 6-500 Hz is an efficient fre-quency component of EMG signal [28].
(c)
Fig.5: (a) Five repetition of the dataset, (b) one data set is separated and (c) spectrogram of the EMG signal
4.2. Classification of health screening task from extracted features
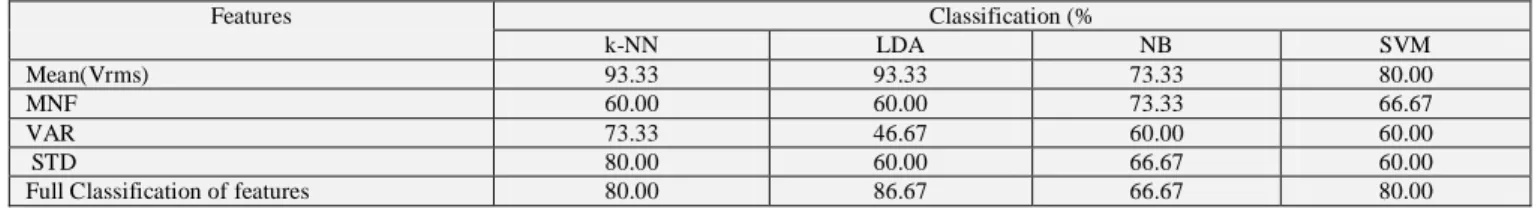
Table 1 shows the summary of classification accuracy for all selected features HST data with 5-fold cross validation. Using spectrogram, it can be observed that three of four classification methods achieved a good result which is 80% and above. k-NN, LDA and SVM are obtained 80, 86.67 and 80% respectively for better classification accuracy, however, NB classification is just under a good classification which 66.67%. The result is very important to determine the best feature and technique used in feature extraction for classification meth-od.
Table 1: Classification accuracy for four different classifications for spectrogram features
Features Classification (% k-NN LDA NB SVM Mean(Vrms) 93.33 93.33 73.33 80.00 MNF 60.00 60.00 73.33 66.67 VAR 73.33 46.67 60.00 60.00 STD 80.00 60.00 66.67 60.00
Full Classification of features 80.00 86.67 66.67 80.00
Figure 6 illustrates the features classification accuracy for k-Nearest Neighbor (k-NN) classification method. This graph indicates the
best classifier discriminate HSP is mean root mean square voltage (Vrms) with an accuracy of 93.33%. Standard deviation (STD), and full
classification have the same accuracy for the second highest which is 80%. It is followed by Variance (VAR) with 73.33% and lowest accuracy is just 60%, which is 64% from the highest accuracy, mean frequency (MNF).
Time (minute) F re q u e n cy (Hz) SPECTROGRAM 0 0.005 0.01 0.015 0.02 0.025 0.03 0.035 0.04 0.045 0.05 0 50 100 150 200 250 300 350 0.5 1 1.5 2 x 10⁻³
224 International Journal of Engineering & Technology
Fig.6: k-Nearest Neighbor (k-NN) classification of spectrogram feature set for HSP
The features classification accuracy of linear discriminant analysis (LDA) is shown in Figure 7. Mean Vrms is obtaining the highest
clas-sification accuracy as k-NN with 93.33%. Full categories of feature clasclas-sification is 86.67%, which is the second highest of accuracy. It is lower accuracy is STD with the same value with MNF and then lowest is VAR with an accuracy of 60%, 60% and 46.67%. LDA is one of the most widely studied dimensionality reduction technique. The application of variants of LDA technique is able to solve the problem of small sample size.
Fig.7: Linear Discriminant Analysis (LDA) classification of spectrogram feature sets for HSP
From Figure 8, the performance of classification for Naïve Bayes (NB) is illustrated. Mean Vrms and mean frequency (MNF) are the best
with a classification accuracy of 73.33%. It is followed by STD with full classification of 66.67% accuracy, then the lowest is VAR with 60%. This classification is the lowest accuracy compared to three others classification method. This is because the naive algorithm of this classification method will assume the independence of features as features do not covary with each other [30]. This classifier is simple in its structure, and the speed of the learning algorithm it employs. The NB classifier assumes that the presence (or abs ence) of a particular feature of a class is unrelated to the presence (or absence) of any other feature [31].
Fig.8: Naïve Bayes (NB) classification of spectrogram feature sets for HSP
In recent times non-linear approaches such as the support vector machine (SVM) have been applied to credit scoring and help to increase the accuracy and reliability of many credit scorecards [32]. The performance of the features for SVM classification method is presented
in Figure 9. The best classification accuracy features are Mean Vrms and full classification due to the same value of accuracy which is
80%. MNF is the second highest with drastically decrease to 66.67%. Then the lowest is VAR and STD of 60% of classification a ccura-cy.
Fig.9: Support vector machine (SVM) classification of spectrogram feature set for HSP 0 10 20 30 40 50 60 70 80 90 100 Mean Vrms Mean Frequency (MNF) Variance (VAR) Standard Deviation (STD) Full Classification P e r c e n ta g e ( 100 %) 0 20 40 60 80 100 Mean Vrms Mean Frequency (MNF) Variance (VAR) Standard Deviation (STD) Full Classification P e r c e n ta g e ( 100 %)
The performance of the positive predictive (PPV) and false discovery rate (FDR) for each type of tasks for HSP is illustrated in Figure 10. The green box is directed for each feature is correctly classified to assign class which involved three tasks (axial rotational reach, kneel-ing reach and kneelkneel-ing to standkneel-ing back reach). Then, the red box is indicated for unable to classify the type of tasks. From Figure 10, the results show the axial rotational reach achieve the highest true positive which is 80% of correctly classified because anoth er 20% is misclassified to kneeling reach. Second higher performance is kneeling to standing back reach with 60% of correct classified and 40% wrongly classified into kneeling to standing back reach. The third is kneeling reach with worse correct classified, with just 20%. Misclas-sified occurred 60% axial rotational reach and 20% with kneeling to standing back reach.
Fig.10: Positive predictive (PPV) and false discovery rate (FDR) for each type of tasks for HSP
5. Conclusion
This paper has presented the classification of EMG Signal for health screening task for musculoskeletal disorder which the performance of spectrogram is demonstrated. The features were extracted from this technique and it shown that it is suitable to be applied to the EMG signal analysis, then feature extraction and classification. Either four demonstrated a classification method, it is clearly shown that sup-port vector machine (SVM) is able to perform the highest classification accuracy. The overall features extracted which is 80% and above for k-NN, LDA, SVM accept NB in just 73.33%. It is shown that SVM will be suitable to be applied in the future to classify EMG signal as HSP. This result is able to be implemented in a rehabilitation center as SOCSO for assessment and easier classified the pe rformance of their patient.
In the nutshell, from positive predictive (PPV) and false discovery rate (FDR), it's shown that the percentage of correct classified accu-racy can be more higher and the additional of other suitable features is needed to increase the potential for correct classification of ma-chine learning.
Acknowledgement
A grateful thank to the Ministry of Higher Education Malaysia (MOHE) and Universiti Teknikal Malaysia Melaka (UTeM) for Zamalah Scheme and PJP/1/2017/FKEKK/H19/S01526 as the funding research. Thank also to support team of this project from Centre of Robotic
& Industrial Information (CeRIA) and specially gratefully thanks to the Faculty of Electrical Engineering of Universiti Teknikal
Malay-sia Melaka (UTeM) for giving the cooperation to do this project.
References
[1] Daneshmandi, H., Choobineh, A. R., Ghaem, H., Alhamd, M., & Fakherpour, A. (2017). The effect of musculoskeletal problems on fatigue and productivity of office personnel: a cross-sectional study. Journal of preventive medicine and hygiene, 58(3), pp. 252-258.
[2] Zawawi, T. T., Abdullah, A. R., Jopri, M. H., Sutikno, T., Saad, N. M., & Sudirman, R. (2018). A Review of Electromyography Signal Analysis Techniques for Musculoskeletal Disorders,11(3), pp. 1136-1146.
[3] Too. Jingwei, A.R Abdullah, Norhashimah Mohd Saad, N. Ali, And T.N.S Tengku Zawawi (2018). Application of Spectrogram and Discrete Wavelet Transform For EMG Pattern Recognition. Journal of Theoretical & Applied Information Technology, 96(10), pp. 3036-3047.
[4] Buckley, P. (2016). Work-related Musculoskeletal Disorder (WRMSDs) Statistics, Great Britain 2016. Health and Safety Executive (HSE), pp. 1-20.
[5] Nazmi, N., Abdul Rahman, M., Yamamoto, S. I., Ahmad, S., Zamzuri, H., & Mazlan, S. (2016). A review of classification techniques of EMG sig-nals during isotonic and isometric contractions. Sensors, 16(8), 1304.
[6] Ruchika, Shalini Dhingra. (2013). An explanatory study of the parameters to be measured from emg signal, International Journal of Engineering and Computer Science , 2(1), pp.207–213.
[7] Y. Ning and Y. Zhang, (2017). A new approach for multi-channel surface EMG signal simulation, Biomedical Engineering Letters, 7(1), pp. 45– 53.
[8] Kiguchi, Kazuo, and Yoshiaki Hayashi, (2012). Estimation of joint torque for a myoelectric arm by genetic programming based on EMG signals,
In World Automation Congress (WAC), pp. 1-4. IEEE.
[9] S. Thongpanja, A. Phinyomark, F. Quaine, Y. Laurillau, C. Limsakul, and P. Phukpattaranont, (2016). Probability Density Functions of Stationary Surface EMG Signals in Noisy Environments, IEEE Transactions on Instrumentation and Measurement, 65(7), pp. 1547–1557.
[10]R. H. Chowdhury, M. B. I. Reaz, M. A. B. M. Ali, A. A. A. Bakar, K. Chellappan, and T. G. Chang,(2013). Surface electromyography signal pro-cessing and classification techniques, Sensors, 13(9), pp. 12431–12466.
226 International Journal of Engineering & Technology
[11]Zhang, Xu, and Ping Zhou, (2012). High-density myoelectric pattern recognition toward improved stroke rehabilitation, IEEE Transactions on Bi-omedical Engineering, 59(6), pp.1649-1657.
[12]Kakoty, Nayan M., and Shyamanta M. Hazarika, (2011). Recognition of grasp types through principal components of dwt based emg features, In
2011 IEEE International Conference on Rehabilitation Robotics (ICORR), pp. 1-6. IEEE
[13]D. Joshi, B. H. Nakamura, and M. E. Hahn, (2015). High energy spectrogram with integrated prior knowledge for EMG-based locomotion classifi-cation, Medical Engineering and Physics, 37(5), pp. 518–524.
[14]Jopri, M. H., A. R. Abdullah, M. Manap, T. Sutikno, and M. R. Ab Ghani, (2018). Harmonic Contribution Analysis of Electric Arc Furnace by Us-ing Spectrogram, Bulletin of Electrical Engineering and Informatics, 7(2), pp. 236-243.
[15]M. B. I. Reaz, M. S. Hussain, and F. Mohd-Yasin, (2006). Techniques of EMG signal analysis: detection, processing, classification and applications, Biol. Proced. Online, 8(1), pp. 11–35.
[16]Tengku Nor Shuhada Tengku Zawawi, Abdul Rahim Abdullah, Isa Halim, Ezreen Farina Shair, and Saleha Mohamad Salleh, (2016). Application of spectrogram in analysing electromyography (EMG) signals of manual lifting, ARPN Journal of Engineering and Applied Sciences, 22(5), pp. 3603-3609.
[17]Andreotti, A., A. Bracale, P. Caramia, and G. Carpinelli, (2009) Adaptive Prony method for the calculation of power-quality indices in the pres-ence of nonstationary disturbance waveforms, IEEE Transactions on Power Delivery, 24(2), pp. 874-883.
[18]Kotsiantis, Sotiris B., I. Zaharakis, and P. Pintelas,(2007). Supervised machine learning: A review of classification techniques, Emerging artificial intelligence applications in computer engineering,160, pp. 3-24.
[19]Tripathy, Abinash, Ankit Agrawal, and Santanu Kumar Rath, (2015). Classification of sentimental reviews using machine learning tech-niques, Procedia Computer Science, 57, pp. 821-829, 2015.
[20]NQ Zainal Abidin et al, (2012) Leakage current analysis on polymeric surface condition using time-frequency distribution. In: 2012 IEEE Interna-tional Power Engineering and Optimization Conference (PEOCO) Melaka,Malaysia,. IEEE. pp. 171–175, 2012.
[21]Maillo, Jesus, Sergio Ramírez, Isaac Triguero, and Francisco Herrera, (2016). kNN-IS: An Iterative Spark-based design of the k-Nearest Neighbors classifier for big data, Knowledge-Based Systems,117, pp. 3-15.
[22]Deng, Zhenyun, Xiaoshu Zhu, Debo Cheng, Ming Zong, and Shichao Zhang, (2016) Efficient kNN classification algorithm for big da-ta. Neurocomputing, 195, pp. 143-148.
[23]G.Venugopal, M. Navaneethakrishna, and S. Ramakrishnan, (2014). Extraction and analysis of multiple time window features associated with muscle fatigue conditions using sEMG signals”, Expert Systems with Applications, 41(6), pp. 2652–2659.
[24]Khan, Salabat, Muhammad Hussain, Hatim Aboalsamh, and George Bebis,(2017). A comparison of different Gabor feature extraction approaches for mass classification in mammography, Multimedia Tools and Applications, 76(1) , pp. 33-57.
[25]P. Bermejo, J. A. Gámez, and J. M. Puerta, (2014). Speeding up incremental wrapper feature subset selection with Naive Bayes classifier,
Knowledge-Based Systems, 55, pp. 140–147.
[26]Wang, Lipo, ed. (2005). Support vector machines: theory and applications. Springer Science & Business Media, 177.
[27]J. Yousefi and A. Hamilton-Wright, Characterizing EMG data using machine- learning tools (2014), Computers Biology and Medicine, 51, pp. 1– 13.
[28]H. Xu and G. Chen, (2013). An intelligent fault identification method of rolling bearings based on LSSVM optimized by improved PSO, Mechani-cal Systems and Signal Processing, 35(1), pp. 167– 175.
[29]A.-C. Tsai, J.-J. Luh, and T.-T. Lin, (2015). A novel STFT-ranking feature of multi-channel EMG for motion pattern recognition, Expert Systems with Applications, 42(7), pp. 3327–3341.
[30]Gao, Vance, Fred Turek, and Martha Vitaterna, (2016). Multiple classifier systems for automatic sleep scoring in mice, Journal of neuroscience methods, 264, pp. 33-39.
[31]Wang, Hua, and Yanchun Zhang, (2016). Detection of motor imagery EEG signals employing Naïve Bayes based learning process, Measurement, 86, pp. 148-158.
[32]Harris, Terry, (2015). Credit scoring using the clustered support vector machine,” Expert Systems with Applications,42(2), pp. 741-750.
View publication stats View publication stats