100
~---112
108
C
i
i
i
i
i
i
i
i
i
i
i
f1101'—
~.
1
106—
1111111111111111111inuun111111u
~
(12) United States Patent
Babinsky et al.
(54) VORTEX GENERATORS TO CONTROL BOUNDARY LAYER INTERACTIONS (75) Inventors: Holger Babinsky, Linton (GB); Eric
Loth, Champaign, IL (US); Sang Lee, Savoy, IL (US)
(73) Assignee: The Board of Trustees of the University of Illinois, Urbana, IL (US) (*) Notice: Subject to any disclaimer, the term of this
patent is extended or adjusted under 35 U.S.C. 154(b) by 522 days.
(21) Appl. No.: 12/895,781 (22) Filed: Sep. 30, 2010
(65) Prior Publication Data US 2012/0018021 Al Jan. 26, 2012
Related U.S. Application Data
(60) Provisional application No. 61/277,878, filed on Sep.
30, 2009. (51) Int. Cl. B64C23106 (2006.01) B64C21110 (2006.01) (52) U.S. Cl. USPC ... 137/809; 244/130; 244/199.1; 244/200.1
(58) Field of Classification Search
USPC ... 137/808, 809; 296/180.1-180.5; 244/130, 199.1, 200, 200.1
See application file for complete search history.
(1o)
Patent No.:
US 8,656,957 B2
(45) Date of Patent:
Feb. 25, 2014
(56) References Cited
U.S. PATENT DOCUMENTS
2,800,291 A * 7/1957 Stephens ... 244/200 4,655,419 A 4/1987 van der Hoeven
5,058,837 A 10/1991 Wheeler 5,598,990 A 2/1997 Farokhi et al.
8,528,601 B2 * 9/2013 Dahm et al . ... 137/809 OTHER PUBLICATIONS
Chohen, S.G., and Motalleb, F., Sub Boundary-Layer Vortex Gen-erators for the Control of Shock Induced Separation,
TheAeronauti-cal Journal, Apr. 2006, pp. 215-226, Department of Engineering,
Queen Mary University of London, London, United Kingdom. Ashill, P.R., Fulker, J.L, and Hackett, K.C., A Review of Recent Developments in Flow Control, The Aeronautical Journal, May 2005, pp. 205-231, QunetiQ, Bedford, United Kingdom.
* cited by examiner
Primary Examiner Craig Schneider
(74) Attorney, Agent, or Firm Brinks Gilson & Lione (57) ABSTRACT
Devices for generating streamwise vorticity in a boundary includes various forms of vortex generators. One form of a split-ramp vortex generator includes a first ramp element and a second ramp element with front ends and back ends, ramp surfaces extending between the front ends and the back ends, and vertical surfaces extending between the front ends and the back ends adjacent the ramp surfaces. A flow channel is between the first ramp element and the second ramp element. The back ends of the ramp elements have a height greater than a height of the front ends, and the front ends of the ramp elements have a width greater than a width of the back ends.
13 Claims, 40 Drawing Sheets
12
10
U.S. Patent
Feb. 25, 2014
Sheet 2 of 40
US 8
,656,957 B2
20,E
48
34
h
40
50
FIG. 2
it
it It
it
it it
it J
~
it it
it
IA it It Alt it
FIG. 3
38
~ ~
►
40
i
i
i
i
X1
'
►
48
i
X2
i
►
47
50
-46
►
i
i
32
30
i
i
i
i
W~ F
r-
FIG.4a
X1
3
50
X2
32
FIGAb
90
E
D
,
,
-72
79
—68
70---,,,-
64'
77
66—
U.S. Patent
Feb. 25
,2014
Sheet 4 of 40
US 8,656,957 B2
60~
62
h
h=hey
64
FIG.5a
FIG.5b
1
110
00
120
.102
106
4,42h
~
130
102
h
6.57h 1
108
104
7.34h
130
112
h'LC
5h
h
6.57h
104
FIG.6a
100
002
c
110
,
120
122
~~' i
i
120
122
102
1
04
104
102
130
`
i
i
i
'D
—
'
106—
►'
130
-108
F~
~F
FIG.6b
FIG.6c
U.S.
Patent
Feb. 25,2014
Sheet
6 of 40
US 8,656,957
B2
Angled View
Top View
a)
jh
.84h
5
5.84
6.57h
b)
tO.5h
5.84h
--
6
~
,577h
0=24'
C)
lh
2,92h
6.57h
d)
j
6.84
~
h
6.57h
e)
"
h
i'
\\
h
10h
---
0=14"
f)
h
- - h ---h
* 6h
8h
---0=1
7'
FIG. 7
FIG. 8b
86.3 6ref
A
0.2
0.4
0.6
0.8
1
1.2
u/u.
FIG. 9a
f
v
L 4 r e1
c
0
1
U.S. Patent
Feb. 25, 2014
Sheet 8 of 40
US 8
,656,957 B2
10
9
8
7
6
0 5
4
3
2
1
00
~►
Experiments
BG LES T* =4
--- BG LES T* =8
--- DG LES T*
=
4
0.2
0.4
0.6
viu ..
FIG. 9b
0.8
1
1.2
sho
c
k
er
expansion
.40Irk
wave
4 .~r { v. X ~FIG. 1 Oa
w..N::
F
IG. 0..
v~ ...FIG. 10c
is W]NppC~'~\•:.i ~~S}}~n.4iU.S. Patent
Feb. 25, 2014
Sheet 12 of 40
US 8
,656,957 B2
BR
i
BR
2.5-_-
i ®
o HHR
2.5
-
-
-
Q
SR
~g 2
,
-
o HWR
-- INV
ag 2
,
BV
o TV
a
1.5
i
p
_
1.5
i
----
INV
1 -
~---
1
fl-o.---1
0.5
~0.5
0
-10
0
10
20
0
-10
0
10
20
(x-X51)/h
(x-%)/h
FIG. 13a
FIG. 13b
0.02
0.02
• BR
0.015
9
o HWR
c~8 O0.017
•
D Oa
o
0.005
o
°
■o
g
0
-10
0
10
20
(x-x
s
~/h
FIG. 13c
0.015
s
0.01
0.005
■BR
•
* SR
0
o BV
2
o TV
.
obg
2
o Q p Ob o
o
a
-10
0
10
20
(x-x
si
)/h
FIG. 13d
2
BR
o° HHR
°
HWR
1.5
sX 1
°
0
A OM.
Ao
w0
0
10
20
30
40
50
(X-X T, )/h
FIG. 14a
5
A HHR
o HWR
- +.-Ashill Ramp
3
0
rrA
Q4
b M p A A D b A A A0
0
---i10
20
30
40
5
0
(X
-XTE
)!h
FIG. 14c
3
BR
o HHR
2.5
2
- + Ashi1 Ramp,.' +
~.
N
1.5
0.
5
x ■r
■ ¢S0011
1
2
1
Oo
10
20
30
40
50
(X-XTE)/h
FIG. 14e
2 7
BR
o SR
°
o QA
BV
1.5
"
n TV
'zx 1
_
AO 0"
o
°
868
O.5
0■
o
~
0
0
--- ■40
50
10
20
30
(X-
XTF )/
h
FIG. 14b
5
BR
O SR
BV
4-0
Ashill Vane.X
3 J2
r rr ■ ■■
p~1
r
8
p 4
QO
00
10
20
30
40
50
(X-X
TE
)/h
FIG. 14d
r BR
3
OSR
° BV
2.5
-
~- Ashill Vane
2
A -C_N_
1.5
~. fix- r1
$~ 80
O O
r"
•
"
■
A
6 6 8 o a ■ ■ ■00
10
20 30
40
50
(X-XTE )/h
FIG. '14f
30
xx
_.-'-._.-._--- ... ---
25
x
x
r
i
20
i
'
~ 1s 15
~'
+
X
+
+
Ashill Ramp
/
+
+
Ashill Ramp curve 6t
10 -
/
x
Ashill Vane
_..._._ Ashill Vane curve fit
i
■
BR
5 i
O SR R
O
a BV
O TV
500
1000 1500 2000 2500 3000
h+
FIG. 16a
00
2
1.5
1
0.5
LOL
X
0
M -0.5
S
-
1
E -1.5
c -2
-2.5
-3
-3.5
-16
■
BR
A HHR
O HWR
O SR
A
BV
O TV
-.-X-.-Ashill Vane
Q ~.
-x
8
O
o
o O O
A Q
O
o
■
O
g
■
b
■
10
20
30
( X-X TE)/h
FIG. 16b
40
50
U.S.
Patent
Feb. 25,2014
Sheet
16
of 40
US 8,656,957
B2
-
BR
_
BR
0.8
HHR
0.8 -
-
--
SR
---
HWR
---
BV
---TV
0.7
-0.4 -0.2
0
02
0.4
0.7
-0.4 -0.2
0
0.2
0.4
z/Dz/D
FIG.
17a
FIG. 17b
2.
2 -
SR
1.8,
----,H
_
B
-
H
R
R
1.8
-BR
1.6 -
---
HWR
1.6 -
-
-,.-.BV
---
TV
1.4-
~'O
1.4 -
PO -A
1.2-
1.2-
0-6
-0.4 -0.2
0
0.2
0.4
0. 8
-0
.4 -02
0
0.2
0.4
z/D
z/D
FIG.
17c
FIG. 17d
0.1 -
0.1 -
< - 0.1 7
< - 0.1 -
BR
-A-
Ash i
I I
Vane
-0.2
-0.2-
BR
---
HWR
----,
BV
---
TV
-0.3' -O,.4
t.2
_OL
0.2 0.4
-0.3"-0
.4
0
0.2 0.4
(j/D
FI
.
We
FIG. 17f
z/ D
h
lh
6.57h
FIG. 18a
h
h
FIG. 18b
U.S. Patent
Feb. 25, 2014
Sheet 18 of 40
US 8,656,957 B2
shock spillage
M up > 1
L
diff MdiffClpotential flow
control sites
linear or sinusoidal
area change
FIG. 19a
FIG. 21b
FIG. 21c
U.S. Patent
Feb. 25, 2014
Sheet 20 of 40
US 8,656,957 B2
FIG.
FIG.
FIG. 22c
FIG.
FIG.
FIG. 23c
23d
FIG. 24a
FIG. 24b
~iQ,s
.".
FIG. 24c
U.S.
Patent
Feb. 25, 2014
Sheet 24 of 40
US 8,656,957 B2
S
R
i
Corner vortices
FIG
FIG
25c
FIG.
FIG.
U.S. Patent
Feb. 25, 2014
Sheet 26 of 40
US 8
,656,957 B2
100
90
80
E 70
a~60
ca
U
C50
40
cu
3: 30
20
10
0
Baseline
--- 2 mm RV
--- 3 mm RV
I~1a
' ---4 mm RV
1
1.u
k
0.7
0.75
0.8
0.85
0.9
0.95
1
Pt /Pt.0
FIG.27a
100
90
80
70
E
cu 60
U C4- 50
40
cu
30
20
10
0
Baseline
--3mmRV
I, ---4 mm RV
1
1 ~;
4 I I I 1 11 .1 1,10.7
0.75
0.8
0.85
0.9
0.95
1
P/P
t 00FIG.27b
90
80
E
70
E
u60
U
50
0
40
cz 30
20
10
0
Baseline
--- 2 mm RV
--- 3 mm RV
---4 mm RV
0.4
0.5
0.6
0,7
0.8
0.9
1
u/U.
FIG.28a
100
90
80
E 70
u60
cu
c
50
40
i~
30
20
10
0
Baseline
3mmSIR
--- 4 mm SR
, I
0.4
0.5
0.8
0.7
0.8
0.9
1
u/u m
FIG.28b
U.S. Patent
Feb. 25, 2014
Sheet 28 of 40
US 8
,656,957 B2
400
300
0
U
200
U)
C
100
c
0
1 t I : ri j-.i I I I..t I I 1 I I r t t I .j~.I I, !- .i, 1 r50
60
70
80
90
100 110 120 130 140 150
Location (Pixels)
FIG. 29a
400
300
0
U
200
c
100
0
50
60
70
80 90
100 110 120 130 140 150
Location (Pixels)
40
nFIG. 29b
300
0
v
200
c
100
c
0 L-
50
60
70
80 90
100 110 120 130 140 150
Location (Pixels)
FIG. 29c
Angled View
Top View
a)
5.84h
6.57h
---0=24'
b)
h
h
6.84
~
h
6.57h
11.5h
h
7.34h
0=24'
6.57h
d)
th
10.
4 \
lh
.11
0-24'
_%
6.57h
h
C::
~~
e)
8=16'--
~
-
---7
8
,36
h
- - ---8 -24 0
,----
~
6.57h
FIG. 30
U.S.
Patent
Feb. 25, 2014
Sheet 30 of 40
US 8,656,957 B2
U.S. Patent
Feb. 25, 2014
Sheet 32 of 40
US 8
,656,957 B2
- -- I A 5L M=1.4
1
.......
1.20L M=1.4
-1.20L M=1.3
jr --- -1.25L M=1.4
0
..
.3
®®
1.50L iii=1.4
~ A f0,0
0.4
0
0
0.1
0.2
03 0.4 0.5
06 0.7 0.8
m
FIG. 33
5 de
g
r
e
es
7 degrees
FIG.
344
FIG..
34b
FIG. 34c
FIG. 34d
1.2
---5
0
1.20L line
;!5
0
1.20L sine
1
... 7
0
1.28L line
---7
0
1.28E sine
0.8
+i
i
i
0.6
0.4
0.2
o
L l l 1/ 1 1 1 1 Ijf 1 1,4111 11 1 It 1 1 1 11 11 1 1 1 1 1 1 11 if 1 110 0.1 0.2 0.3 0.4 0.5 0.6 0.7 0.8
M
FIG. 35
U.S. Patent
Feb.
25, 2014
Sheet 34 of 40
US 8,656,957 B2
2L
Rec
.2L
32L
FIG. 36a
FIG. 36b
FIG. 37a
Feb. 25, 2014
Sheet 36 of 40
US 8,656,957 B2
S
U.S. Patent
40
35
30
25
20
15
10
5
0
10°
6
5.5
5
4.5
N4
N3.5
N 3
'c' 2.5
2
1.5
1
0.5
0
10
1
y
+
10
2
103
FIG. 38a
Y/6
FIG. 38b
0.2 [
0
0
1.2
1
0.8
0.6
0.4
1.2 -
R2
1
---SR2
-.---RV2
0.8-
---RV2U
----RV3
0.6-
---RV1
RV1 B
---_NR
0.4
01
0.2
0.3
0.4
0.5 0.6
U/U,.
FIG.
42a
—
R2
---SR2
---RV2
--- ----
RV2U
----RV3
---RV1
-RVlB
----NR
0.2
0 `
0
1.2
1
0.8
>
-
0.6
0.4
0.2
0
0
0.002 0.004
0.006 0.008
K/U2 .
FIG.
42b
R2
---SR2
-.- , -RV2
---RV2U
RV3
---RV1
-RVlB
0.01
0.02
0.03
0.04
0.05
PRMS/P
~FIG.
42c
U.S.
Patent
Feb. 25,2014
Sheet 40 of 40
US 8,656,957 B2
1
- R2
0.9!
--- SR2
---RV2
0.9(
---RV2U
----RV3
0,9,
--- RV1
a
—RVlB
OR
---NR
O .
c
0.81
0.8( -0.4 -0.2
0
0.2
0.4
z/D
FIG. 43a
4 -
R2
--- SR2
3
---- RV2
RV2U
2.5
----RV3
--- RV1
2
—RVlB
--- NR
1.5
1
6.4, '-'
0
1
.2
0
z/D
FIG. 43b
0.2
0.4
1
= I
1.
—R2
--- SR2
---RV2
--- RV2U
----RV3
--- RV1
—RVlB
-_----NR
0.4 0.2
0
0.2
0.4
z/D
FIG. 43c
CROSS-REFERENCE TO RELATED APPLICATIONS
This application claims priority of U.S. Provisional Appli-cation No. 61/277,878, filed on Sep. 30, 2009 and entitled "Vortex Generators to Control Boundary Layer Interactions," the disclosure of which is incorporated herein by reference in its entirety.
GOVERNMENT INTERESTS
This invention was made with Government support under contract Number NNX07AC74A awarded by the NASA and contract Number FA9550-06-1-0400 awarded by the United States Air Force (USAF). The Government has certain rights in the invention.
FIELD
The present application generally relates to vortex genera-tors, and more particularly to vortex generators that control boundary layer interactions on aerodynamic surfaces.
BACKGROUND
Fluid flow around an object such as an airplane wing gen-erates aerodynamic forces, including lift and drag. A thick boundary layer and flow separation from a surface of the object adversely affects the aerodynamic performance. Vor-tex generators (VGs) have been used in passive flow control applications such as on wings at transonic speeds to generate vorticity, or more circulation of the airflow in the boundary layer, thereby delaying or eliminating flow separation. Streamwise vorticity inside the boundary layer is desirable, which improves the aerodynamic performance of the object. Typical vortex generators generally have a height close to the boundary layer thickness and thus generate undesirable parasitic drag. "Low-profile" or micro-VGs (ltVGs) have been proposed to reduce the parasitic drag while producing benefits similar to those of traditional VGs. The micro-VGs generally have a height less than the boundary layer thick-ness.
When air flows at supersonic speeds, such as at supersonic inlets, a shock wave is generated. Shock wave interaction with a turbulent boundary layer has an adverse impact on the aerodynamic performance of the supersonic inlets, such as shock-induced flow separation, increased thickness inbound-ary layer, and stagnation pressure loss.
A typical flow control method is to bleed the flow at the shock impingement to suppress separations, which thins the boundary layer and increases the pressure recovery. However, bleeding the flow has a significant penalty cost of removing up to tenth of the incoming mass flow in order to function effectively. This requires larger inlets to compensate for the lost mass flow which can lead to weight increase and drag. Therefore, improved flow control devices that can reduce or completely eliminate bleeding are desirable.
SUMMARY
A device for generating streamwise vorticity in a boundary layer is provided by the teachings of the present disclosure.
In one form, a vortex generator for generating streamwise
5 vorticity in a boundary layer isprovidedthatcomprises_afirst ramp element with a front end and a back end, a ramp surface extending between the front end and the back end, and a pair of vertical surfaces extending between the front end and the back end adjacent the ramp surface. A second ramp element
10
has a front end and a back end, a ramp surface extending between the front end and the back end, and a pair of vertical surfaces extending between the front end and the back end adjacent the ramp surface. A flow channel is between the first
15 ramp element and the second ramp element, and the back
ends of the ramp elements have a height greater than a height of the front ends, and the front ends of the ramp elements have a width greater than a width of the back ends.
In another form, a vortex generator for generating stream-
20 wise vorticity in a boundary layer is provided that
compris-es_a first vane element with a front end and a back end, a canted outer surface extending between the front end and the back end, and an inner surface extending between the front end and the back end adjacent the canted outer surface. A
25 second vane element has a front end and a back end, a canted outer surface extending between the front end and the back end, and an inner surface extending between the front end and the back end adjacent the canted outer surface. A flow channel is between the first vane element and the second vane ele-
30 ment, and the back ends of the vane elements have a height greater than a height of the front ends, and the back ends of the vane elements have a width greater than a width of the front ends.
In still another form, a vortex generator for generating
35 streamwise vorticity in a boundary layer is provided that comprises a first ramp-vane element with a front end and a back end, a ramp surface extending between the front end and the back end, and a pair of vertical surfaces extending between the front end and the back end adjacent the ramp
40 surface. A second ramp-vane element has a front end and a back end, a ramp surface extending between the front end and the back end, and a pair of vertical surfaces extending between the front end and the back end adjacent the ramp surface. A flow channel is between the first ramp-vane ele-
45 mentandthe second ramp-vane element, andthebackends of the ramp-vane elements have a height greater than a height of the front ends, and the front ends of the ramp-vane elements have a width greater than a width of the back ends.
Further features and advantages will become apparent after
50 a review of the following description, with reference to the drawings, and the claims.
BRIEF DESCRIPTION OF THE DRAWINGS
55 FIG.1 is a perspective view of an array of vortex generators (VGs) according to the teachings of the present disclosure, wherein the VGs are arranged on an exemplary supersonic inlet;
FIG. 2 is a perspective view of a split-ramp vortex
genera-60 for constructed in accordance with the teachings of the
present disclosure;
FIG. 3 is plan view of a series or array of split-ramp vortex generators arranged on an exemplary aircraft wing in accor-dance with the teachings of the present disclosure;
65 FIG. 4a is a plan view of the split-ramp vortex generator of FIG. 2 having parallel centerlines in accordance with the teachings of the present disclosure;
US 8,656,957 B2
3
FIG. 4b is a plan view of the split-ramp vortex generator of FIG. 2 having non-parallel centerlines in accordance with the teachings of the present disclosure;
FIG. 5a is a perspective view of a thick-vane vortex gen-erator constructed in accordance with the teachings of the 5 present disclosure;
FIG. 5b is a plan view of the thick-vane vortex generator of FIG. 5a in accordance with the teachings of the present dis-closure;
FIG. 6a is two perspective views of ramped-vane vortex 10 generators constructed in accordance with the teachings of the present disclosure;
FIG. 6b is a plan view of one set of the ramped-vane vortex generators of FIG. 6a in accordance with the teachings of the 15 present disclosure;
FIG. 6c is a plan view of another set of the ramped-vane vortex generators of FIG. 6a in accordance with the teachings of the present disclosure;
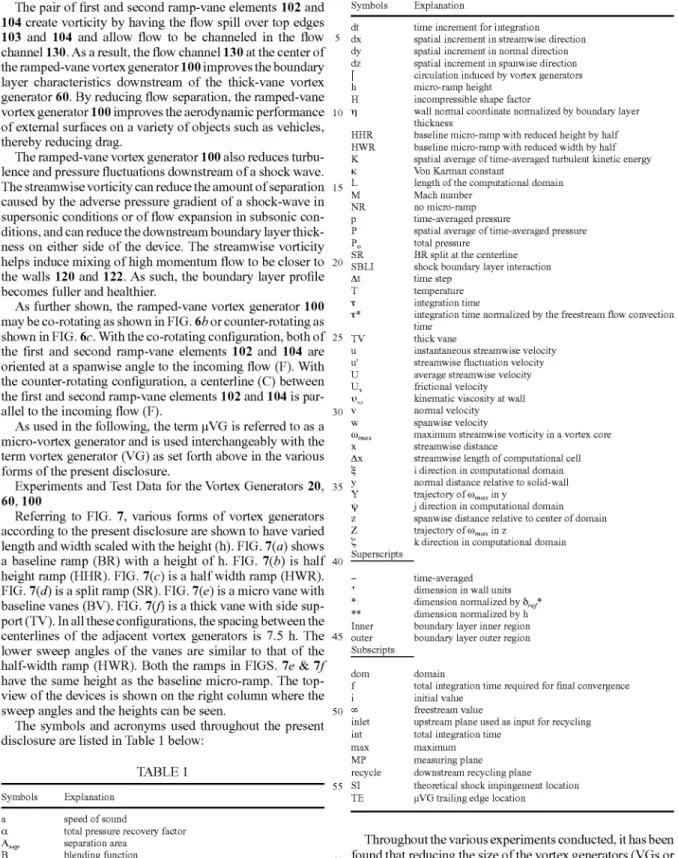
FIG. 7 illustrates various types of vortex generators and 20
their dimensions according to the teachings of the present disclosure;
FIG. 8 shows a computational grid a); at z=0 with the domain dimensions and b) a side view of a vortex generator at
z=11.85 S,. f*; 25
FIG. 9 shows a streamwise velocity profile compared with experimental data at MP for a) NR and b) BR where results for the baseline grid (BG), the dense grid (DG) and two different averaging time-scales are compared;
FIG. 10 shows flow visualization of oblique shock interac- 30
tion: a) density iso-surface for NR, b) velocity contours at y'=5 or NR and c) velocity contours at y'=5 for BR showing reference lengths of 1000 streamwise wall units and 100 wall spanwise wall units;
FIG. 11 shows cross-sections of time-averaged (T*=4) 35
streamwise velocity contour at the trailing edge of µVGs (x*=-57 with the center of the vortices are indicated by the arrows) and the inviscid shock location (x*-0);
FIG. 12 shows time-averaged streamwise velocity contour for a) spanwise view of flow separation region shown in dark 40
for negative wall shear stress at y'=1 and b) streamwise view showing the oblique shock and the separation bubble (blue region) for x*=-57 to 19 at a spanwise location of z*=11.8 (consistent with the red arrow in FIG. 12a);
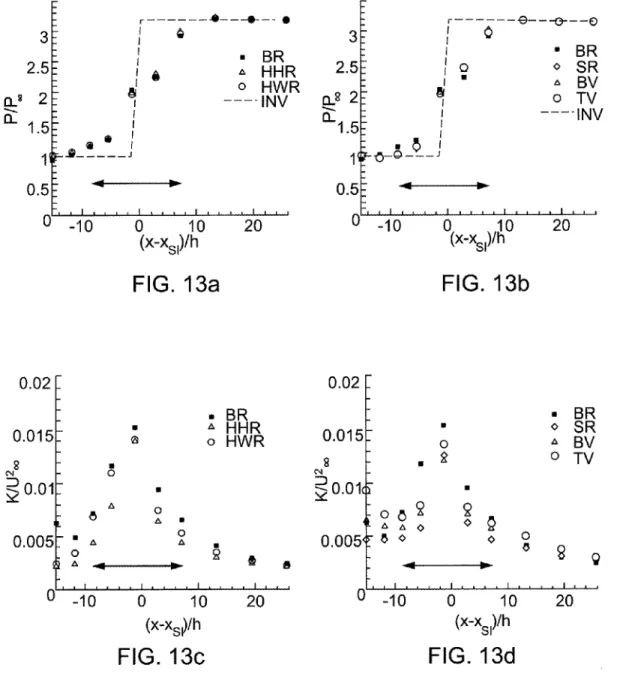
FIG. 13 shows time-spatially averaged (for T*=4 for y*-0 45
to 4.66 and z*-0 to 4.66) values for pressure and turbulent kinetic energy at discrete streamwise locations. Arrows indi-cate the SBLI regions;
FIG. 14 shows temporally and spatially averaged (same as FIG. 13) values for streamwise vorticity and the spatially 50
averaged center that represents the path of the vortex pair for each µVGs. Arrows indicate the SBLI region;
FIG. 15 shows a side view a) schematic of transverse path of the vortex tube with respect to the boundary layer (BL) edge with the oblique shock interaction, b) averaged density 55
contour of BR case, top view of the streamwise velocity contours at y'=5 for c) BR and d) TV where the streamlines show the approximate trajectories of the primary vortices;
FIG. 16 shows correlation of a) circulation of various µVGs at 5 h downstream with the device height in wall units and b) 60
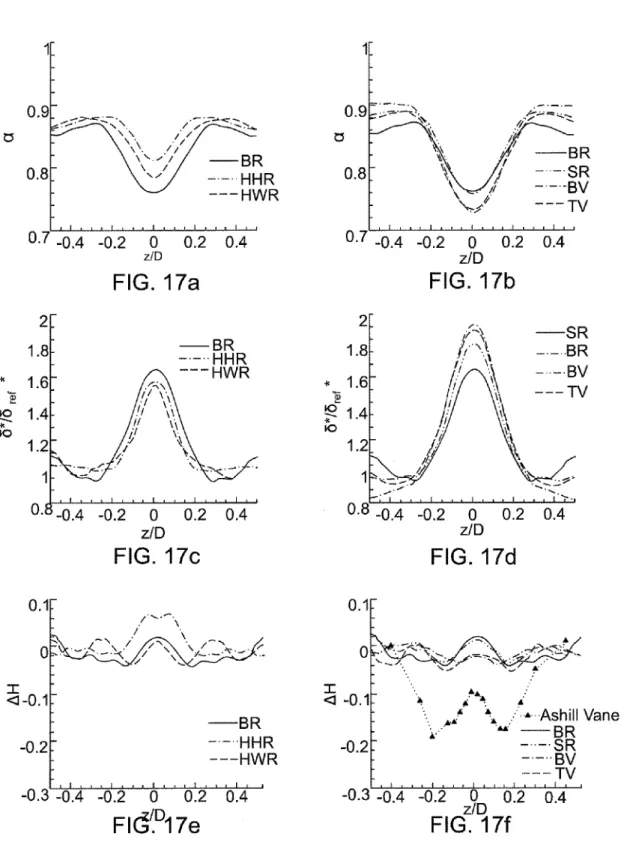
decay of vortex peak strength with downstream distance; FIG. 17 shows spanwise distribution of stagnation pressure recovery, displacement thickness and incompressible shape factor for various µVGs;
FIG. 18a shows a general NSBLI flow control configura- 65
tion used to represent the flow physics of external compres-sion inlet;
4
FIG. 18b shows a wind tunnel test configuration used in the experiment;
FIGS. 19 and 19b show further alternative arrangements of vortex generators wherein FIG. 19 a shows a split-ramp vor-tex generator 20 and FIG. 19b shows a ramped-vane vorvor-tex generator 100;
FIG. 20 is a downstream view of the ramped-vane type VG as installed in the tunnel;
FIG. 21 is instantaneous Schlieren of (a) baseline configu-ration, (b) 4 mm ramped-vanes at the 25 6 position, and (c) 4 mm split-ramps at the 35 6 position;
FIG. 22 is oil flow visualization of base linen-control case (a), and 2 mm ramped vanes at 15 6 (b), 25 6 (c), 35 6 (d), upstream of the shock location;
FIG. 23 is oil flow visualization of base linen-control case (a), and 3 mm ramped vanes at 15 6 (b), 25 6 (c), 35 6 (d), upstream of the shock location;
FIG. 24 is oil flow visualization of base linen-control case (a), and 4 mm ramped vanes at 15 6 (b), 25 6 (c), 35 6 (d), upstream of the shock location;
FIG. 25 is oil flow visualization of base linen-control case (a), and 3 mm split-ramps at 15 6 (b), 25 6 (c), 35 6 (d), upstream of the shock location;
FIG. 26 is oil flow visualization of baseline no-control case (a), and 4 mm split-ramps at 15 6 (b), 25 6 (c), 35 6 (d), upstream of the shock location;
FIG. 27 is normalized stagnation pressure profiles mea-sured-100 6 downstream of devices located 25 6 upstream of the shock for (a) ramped-vanes, and (b) split-ramps;
FIG. 28 shows non nalized velocity profiles computed stag-nation pressure data collected —100 6 downstream of devices located 25 6 upstream of the shock for (a) ramped-vanes, and (b) split-ramps;
FIG. 29 shows Histogram of shock position obtained from 2000 fps Schlierenvideo for a) baseline no-control case (stan-dard deviation=7.37), b) 4 mmramped vanes 25 6 upstream of the shock (standard deviation=5.95), and c) 3 mm split-ramps 35 6 upstream of the shock (standard deviation=6.85);
FIGS. 30a f shows alternate form of various configurations of vortex generators according to the teachings of the present disclosure;
FIG. 31 shows a) schematic of a two dimensional compu-tational domain and b) the mesh which used for RANs flow solutions;
FIG. 32 shows RAINS flow with an freestream Mach num-ber of 1.4 and different diffuser lengths a) 1.15 L, b) 1.20 L,
c) 1.25 L;
FIG. 33 shows Mach profiles at the measuring plane for various diffuser heights and upstream Mach numbers;
FIG. 34 shows streamwise velocity contour showing the effects of the diffuser slop angle (5' and 7') and diffuser shape (straight and sinusoidal curve) where blue regions have a negative streamwise velocity (indicating flow separation) and red regions have a streamwise velocity at least 99% of the freestream velocity;
FIG. 35 shows Mach profiles at the measuring plane for different slope and shapes;
FIG. 36 is a schematic view of a) the computational domain for large eddy simulation is shown which begins with the recycling zone and the micro VGs are placed upstream of the shock, which sits in front of the inlet splitter plate (at x -0), b) streamwise view of the LES grid;
FIG. 37 shows computational grid near a micro-ramped vane: a) top view indicating the leading edge gap (g,,) and trailing edge gap (g z,E) and b) side view;
FIG. 39 shows time-averaged spandwise CG LES in the vicinity of the normal shock (x=-14.9 S, fto 2.1 6,,f) showing flow separation (negative wall shear stress) as the dark regions;
FIG. 40 shows spanwise view of streamwise vorticity at x=-12.3 6,,f oust upstream ofthe shock interaction) based on time-averaged CG LES results for various devices;
FIG. 41 shows spanwise view of turbulent kinetic energy for various devices based on time-averaged CG LES results; FIG. 42 shows spatially and time-averaged profiles at MP for various devices for: a) streamwise velocity b) turbulent kinetic energy, and c) pressure RMS fluctuations; and
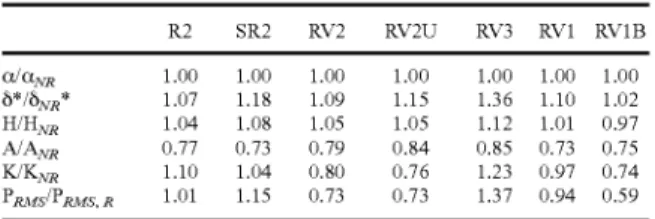
FIG. 43 shows spanwise distribution of stagnation pressure recovery, displacement thickness and incompressible shape factor for various vortex generators at MP.
DETAILED DESCRIPTION
Referring to FIG. 1, an array of micro vortex generators 10 according to the teachings of the present disclosure is illus-trated in an exemplary supersonic inlet 12 of an aircraft engine 14, to generate streamwise vorticity inside the bound-ary layer. Generally, streamwise vorticity inside the boundbound-ary layer delays airflow separation and thus allows an airfoil (in this exemplary form the compressor blades of the engine 14, which are not shown) to operate at higher angles-of-attack without airflow separation.
The micro vortex generators 12 may have both supersonic and subsonic applications. For example, the micro vortex generators 12 may be provided on the wings of aircraft. The micro vortex generators 12 may be used on civil or military aircraft (supersonic or subsonic) and propulsion systems, such as supersonic inlets or SCRAMJET engines. When used with a j et engine, flow with a full healthy boundary layer may be generated when entering a compressor stage or even on a compressor blade. When used in a SCRAMJET engines, the micro vortex generators 12 can be used to generate stream-wise vorticity to mix fuel and air streams. Further, the micro vortex generators 12 may be used in systems that encounter fluid dynamic separation regions, including but not limited to, sailboats, submarines, cars, wind turbines, compressor blades, and turbine blades. The micro vortex generators 12 may further be used in systems such as chemical lasers to generate streamwise vorticity to aid mixing. Accordingly, the various applications of the vortex generators as illustrated and described herein should not be construed as limiting the scope of the present disclosure.
Split-Ramp Vortex Generator
Referring to FIG. 2, one form of a vortex generator accord-ing to the teachaccord-ings of the present disclosure is a split-ramp-type vortex generator, which is generally indicated by refer-ence numeral 20. The split-ramp vortex generator 20 includes a first ramp element 30 and a second ramp element 32 arranged to generate streamwise vorticity through either flow spill or channeling. As shown in FIG. 3, the split-ramp vortex generator 20 may include a series of pairs of first ramp ele-ments 30 and second ramp eleele-ments 32, which are arranged in pairs and placed in an array or series of arrays inside a bound-ary layer (not to scale). Accordingly, any number or arrange-ment of split-ramp vortex generators 20 should be construed as falling within the scope of the present disclosure. Further-more, any number or arrangement (e.g., array or series) may be employed with any of the various forms of vortex genera-
each have a front (upstream) end 34, 36 and a back (down-
5 stream) end 38, 40. The back ends 38 and 40 have a height greater than the height of the front ends 34 and 36 so that ramp surfaces 42 and 44 extend between the front ends 34, 36 and the back ends 38, 40.
As shown in FIGS. 4a and 4b, the first ramp element 30 and io the second ramp element 32 each have a centerline Xl, X2
extending along the length of the first and second elements 30 and 32. The centerlines Xl, X2 of the first ramp element 30 and the second ramp element 32 may be substantially parallel as shown in FIG. 4a or non-parallel as shown in FIG. 4b,
15 depending on the application. Furthermore, the first ramp element 30 and the second ramp element 32 may be oriented ISO' from their position as shown in FIG. 4a such that the back ends 38, 40 face the incoming flow F. It should be understood that any orientation relative to the incoming flow
20 F is within the scope of the present disclosure, and the illus-trations shown herein are merely exemplary and should notbe construed as limiting the scope of the invention.
As further shown, the first ramp element 30 and the second ramp element 32 each have a width (W) at the front ends 34,
25 36 greater than the width at the back ends 38, 40 so that the
ramp surfaces 42, 44 each define a substantially triangular shape. The first and second ramp elements 30 and 32 each define a pair of inner vertical surfaces 46, 48, and outer vertical surfaces 47, 49 extending between the front ends 34,
3o 36 and the back ends 38, 40 adjacent the ramp surfaces 42, 44.
The inner vertical surfaces 46 and 48 are substantially paral-lel, and the outer vertical surfaces 47, 49 are angled as shown. The ramp surfaces 42 and 44 are disposed between the cor-responding pairs of vertical surfaces 46-49 and extend from
35 the front ends 34, 36 to the back ends 38, 40. A flow channel 50 is defined between the first and second ramp elements 30, 32 as shown. Furthermore, the dimensions as shown in FIG. 2 are merely exemplary and should not be construed as limiting the scope of the present disclosure.
40 The first ramp element 30 and the second ramp element 32 are disposed at a distance D, as measured at the front ends 34, 36 as shown in FIG. 4a. The dimensions of the split-ramp vortex generator 20 (including height, width and distance), and more specifically of the first and second ramp elements 30
45 and 32, are functions a number of variables, including but not limited to the flow Mach number, Reynolds number, the type of shock-wave that interacts with the boundary layer, and the desired balance between performance and efficiency. For example, smaller devices may be more efficient in that they
5o have higher stagnation pressure recovery, but may have less performance in that the strength of the vortices will not be as strong nor will persist as long. The size and relative length scales can be chosen based on the downstream incompress-ible shape factor using RANS (Reynolds-Averaged Navier-
55 Stokes) numerical methods.
The pair of first and second ramp elements 30 and 32 create vorticity by having the flow spill over peak edges 51 and 53, which are at an angle to the free-stream flow. The split-ramp vortex generator 20 allows flow to be channeled in the flow
60 channel 50 betweenthe first and second ramp elements 30 and
32. As a result, the flow channel 50 at the center of the split-ramp vortex generator 20 improves the boundary layer characteristics downstream of the split-ramp vortex generator
20. By reducing flow separation, the split-ramp vortex gen-
65 erator 20 improves the aerodynamic performance of external surfaces on a variety of objects such as vehicles, thereby reducing drag.
US 8,656,957 B2
7
The split-ramp vortex generator 20 can also reduce turbu-lence and pressure fluctuations downstream of a shock wave. The streamwise vorticity can reduce the amount of separation caused by the adverse pressure gradient of a shock-wave in supersonic conditions or of flow expansion in subsonic con-ditions, and can reduce the downstream boundary layer thick-ness on either side of the device. The streamwise vorticity helps induce mixing of high momentum flow to be closer to the vertical surfaces 46, 48. As such, the boundary layer profile becomes fuller and healthier.
Detailed test results and analyses of this split-ramp vortex generator 20, along with other configurations of vortex gen-erators as set forth in the following are provided in greater detail below.
Thick Vane Vortex Generator
Referring to FIGS. 5a and 5b, another form of a vortex generator according to the teachings of the present disclosure includes a thick-vane type vortex generator 60. Like the split-ramp type vortex generator 20, the thick vane vortex genera-tor 60 provides streamline vorticity generation through flow spill over and flow channeling and can provide higher stag-nation pressure recovery than prior art vortex generators. The higher stagnation pressure recovery reduces parasitic drag created by the vortex generators, resulting in improved effi-ciency.
The thick-vane vortex generator 60 includes a first vane element 62 and a second vane element 64. The first vane element 62 and the second vane element 64 each have a front (upstream) end 66, 68 and a back (downstream) end 70, 72. The back ends 70 and 72 have a height greater than the height of the front ends 66 and 68, and canted outer surfaces 74 and 76 extend between the front ends 66, 68 and the back ends 70, 72. Inner surfaces 78 and 80 also extend between the front ends 66, 68 andthebackends 70, 72, adjacentthecantedouter surfaces, and are relatively vertical in this form of the thick-vane vortex generators 60. The canted outer surfaces 74, 76 further define outer edges 77, 79, which in one form of the present disclosure are parallel to a direction of flow (F). In another form, the first vane element 62 and the second vane element 64 maybe oriented 180° from their position as shown in FIG. 5b such that the back ends 70, 72 face the incoming flow F. It should be understood that any orientation relative to the incoming flow F is within the scope of the present disclo-sure, and the illustrations shown herein are merely exemplary and should not be construed as limiting the scope of the invention.
Similar to the previous split-ramp vortex generator 20, a flow channel 90 is defined between the first vane element 62 and the second vane element 64. Furthermore, the dimensions as shown in FIG. 5a are merely exemplary and should not be construed as limiting the scope of the present disclosure.
The first vane element 62 and the second vane element 64 are disposed at a distance D, as measured at the front ends 66, 68 as shown in FIG. 5b. As with the previously described split-ramp vortex generator 20, the dimensions of the thick-vane vortex generator 60 (including height, width and dis-tance), and more specifically of the first and second ramp elements 62 and 64, are functions a number of variables, including but not limited to the flow Mach number, Reynolds number, the type of shock-wave that interacts with the bound-ary layer, and the desired balance between performance and efficiency. For example, smaller devices may be more effi-cient in that they have higher stagnation pressure recovery, but may have less performance in that the strength of the vortices will not be as strong nor will persist as long. The size and relative length scales can be chosen based on the down-
8
stream incompressible shape factor using RANS (Reynolds-Averaged Navier-Stokes) numerical methods.
The pair of first and second ramp elements 62 and 64 create vorticity by having the flow spill over peak angle surfaces 63
5 and 65 and allow flow to be channeled in the flow channel 90. As a result, the flow channel 90 at the center of the thick-vane vortex generator 60 improves the boundary layer character-istics downstream of the thick-vane vortex generator 60. By reducing flow separation, the thick-vane vortex generator 60 to improves the aerodynamic performance of external surfaces on a variety of objects such as vehicles, thereby reducing drag.
The thick-vane vortex generator 60 also can reduce turbu-
15 lence and pressure fluctuations downstream of a shock wave.
The streamwise vorticity can reduce the amount of separation caused by the adverse pressure gradient of a shock-wave in supersonic conditions or of flow expansion in subsonic con-ditions, and can reduce the downstream boundary layer thick-
20 ness on either side of the device. The streamwise vorticity helps induce mixing of high momentum flow to be closer to the inner surfaces 78 and 80. As such, the boundary layer profile becomes fuller and healthier.
Ramped-Vane Vortex Generator
25 Referring now to FIGS. 6a-c, another implementation of vortex generators in accordance with the teachings of the present disclosure is shown as a ramped-vane vortex genera-tor 100. The ramped-vane vortex generagenera-tor is similar to the split-ramp vortex generator 20 as set forth above, and differs so in its relative geometric dimensions as set forth in FIG. 6a.
The ramped-vane vortex generator 100 includes a first ramp-vane element 102 and a secondramp-vane element 104. The first ramp-vane element 102 and the second ramp-vane element 104 each have a front (upstream) end 106,108 and a
35 back (downstream) end 110,112. The back ends 110 and 112 have a height greater than the height of the front ends 106 and
108, and eachramp-vane element 102,104 includes relatively
vertical sidewalls 120, 122 that extend from the front ends
106, 108 to the back ends 110, 112. The first ramp-vane
40 element 102 and the second ramp-vane element 106 may be oriented 180° from their position as shown in FIGS. 6b, 6c such that the back ends 110, 112 face the incoming flow F. It should be understood that any orientation relative to the incoming flow F is within the scope of the present disclosure,
45 and the illustrations shown herein are merely exemplary and should not be construed as limiting the scope of the invention. Similar to the previous vortex generators 20, 60, a flow channel 130 is defined between the first ramp-vane element 102 and the second ramp-vane element 104. Furthermore, the
5o dimensions as shown in FIG. 6a are merely exemplary and should not be construed as limiting the scope of the present disclosure.
The first ramp-vane element 102 and the second ramp-vane element 104 are disposed at a distance D, as measured at the
55 front ends 106, 108 as shown in FIG. 6b. As with the previ- ously described generators 20, 60, the dimensions of the ramped-vane vortex generator 100 (including height, width and distance), and more specifically of the first and second ramp-vane elements 102 and 104, are functions a number of
60 variables, including but not limited to the flow Mach number,
Reynolds number, the type of shock-wave that interacts with the boundary layer, and the desired balance between perfor- mance and efficiency. For example, smaller devices may be more efficient in that they have higher stagnation pressure
65 recovery, but may have less performance in that the strength of the vortices will not be as strong nor will persist as long. The size and relative length scales can be chosen based on the
104 create vorticity by having the flow spill over top edges
103 and 104 and allow flow to be channeled in the flow
channel 130. As a result, the flow channel 130 at the center of the ramped-vane vortex generator 100 improves the boundary layer characteristics downstream of the thick-vane vortex generator 60. By reducing flow separation, the ramped-vane vortex generator 100 improves the aerodynamic performance of external surfaces on a variety of objects such as vehicles, thereby reducing drag.
The ramped-vane vortex generator 100 also reduces turbu-lence and pressure fluctuations downstream of a shock wave. The streamwise vorticity can reduce the amount of separation caused by the adverse pressure gradient of a shock-wave in supersonic conditions or of flow expansion in subsonic con-ditions, and can reduce the downstream boundary layer thick-ness on either side of the device. The streamwise vorticity helps induce mixing of high momentum flow to be closer to the walls 120 and 122. As such, the boundary layer profile becomes fuller and healthier.
As further shown, the ramped-vane vortex generator 100 may be co-rotating as shown in FIG. 6b or counter-rotating as shown in FIG. 6c. With the co-rotating configuration, both of the first and second ramp-vane elements 102 and 104 are oriented at a spanwise angle to the incoming flow (F). With the counter-rotating configuration, a centerline (C) between the first and second ramp-vane elements 102 and 104 is par-allel to the incoming flow (F).
As used in the following, the term µVG is referred to as a micro-vortex generator and is used interchangeably with the term vortex generator (VG) as set forth above in the various forms of the present disclosure.
Experiments and Test Data for the Vortex Generators 20,
60,100
Referring to FIG. 7, various forms of vortex generators according to the present disclosure are shown to have varied length and width scaled with the height (h). FIG. 7(a) shows a baseline ramp (BR) with a height of h. FIG. 7(b) is half height ramp (HHR). FIG. 7(c) is a half width ramp (HWR). FIG. 7(d) is a split ramp (SR). FIG. 7(e) is a micro vane with baseline vanes (BV). FIG. 70 is a thick vane with side sup-port (TV). In all these configurations, the spacing between the centerlines of the adjacent vortex generators is 7.5 h. The lower sweep angles of the vanes are similar to that of the half-width ramp (HWR). Both the ramps in FIGS. 7e & 7f have the same height as the baseline micro-ramp. The top-view of the devices is shown on the right column where the sweep angles and the heights can be seen.
The symbols and acronyms used throughout the present disclosure are listed in Table I below:
TABLE I
Symbols Explanation
a speed of sound
a total pressure recovery factor A,, separation area
B blending function BR baseline micro-ramp BV baseline micro-vane
P frictional velocity ratio CFL Courant-Freidrichs-Lewy number D width of the computational domain 6 boundary layer thickness
S,
f
displacement thickness at inviscid shock location but with no shock effectsdt time increment for integration 5 dx spatial increment in streamwise direction
dy spatial increment in normal direction dz spatial increment in spanwise direction
I circulation induced by vortex generators It micro-ramp height
H incompressible shape factor
10 E wall normal coordinate normalized by boundary layer thickness
HHR baseline micro-ramp with reduced height by half HWR baseline micro-ramp with reduced width by half K spatial average of time-averaged turbulent kinetic energy
K Von Karman constant
15 L length of the computational domain
M Mach number
NR no micro-ramp
p time-averaged pressure
P spatial average of time-averaged pressure Po total pressure
SR BR split at the centerline 20 SBLI shock boundary layer interaction
At time step
T temperature
T integration time
T* integration time normalized by the freestream flow convection time
25 TV thick vane
u instantaneous streamwise velocity
U. streamwise fluctuation velocity U average streamwise velocity
U frictional velocity v im, kinematic viscosity at wall
30 v normal velocity
w spanwise velocity
wmax maximum streamwise vorticity in a vortex core x streamwise distance
Ax streamwise length of computational cell i direction in computational domain 35 y normal distance relative to solid-wall
Y trajectory of o)__ in y
2V j direction in computational domain z spanwise distance relative to center of domain Z trajectory of o)__ in z
k direction in computational domain Superscripts
40
— time-averaged
dimension in wall units * dimension normalized by 6,f* ** dimension normalized by It Inner boundary layer inner region 45 outer boundary layer outer region
Subscripts
dom domain
f total integration time required for final convergence i initial value
50 W freestream value
inlet upstream plane used as input for recycling int total integration time
max MP
maximum measuring plane recycle downstream recycling plane 55 SI theoretical shock impingement location
TE µVG trailing edge location
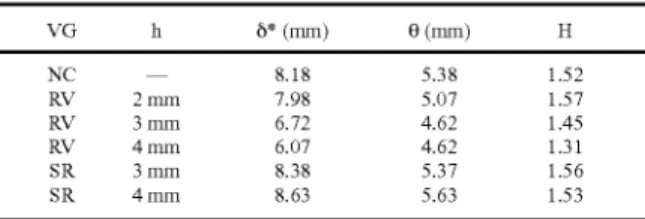
Throughout the various experiments conducted, it has been
60 found that reducing the size of the vortex generators (VGs or
µVGs as used herein) according to the present disclosure and placing them closer to the impinging shock location allowed reduced flow separation area at the impinging shock and increased pressure recovery downstream. This indicates that
65 the optimum µVG design is be dependent on flow conditions and may require capture of the unsteady large-scale struc-tures, or flow over the VGs.
US 8,656,957 B2
11
The study of the physics of the interaction between the shock wave, the turbulent boundary layer and the counter-rotating vortex pair generated from the flow control device is discussed below. The development of the vortices differs between various VG geometries and are compared to that of 5 previous subsonic measurements. The evolution of the turbu-lent structures passing over the µVGs and the impact of the oblique shock is shown, and then the effect of different geom-etries of the µVGs on flow separation and downstream bound-ary layer properties including stagnation pressure recovery l0 was determined. In one experiment, a Mach 3 turbulent boundary layer with Re ba,=3,800 with an 8° oblique
imping-ing shock was investigated.
µVGs and Computational Grid Referring to FIG. 8, the 15 computational grid is a scaled version of the test section of a wind tunnel at AFRL which included a downstream measur-ing plane (MP). The flow domain is dimensioned in this figure in terms of a reference displacement thickness, denoted as S,. f*. The reference displacement thickness of the boundary 20
layer is that measured for a clean flat plate flow (i.e. no shocks and no micro-ramps) but at the position of the theoretical inviscid shock
(xsl).
The ratio of the baseline micro-ramp's height, h, to the displacement thickness is 3.19 (h=3.19 6 f*) based onAnderson. The length and the width of the grid is 312 25S,. f* and 23.7 S,. f*, respectively. The spanwise coordinate z is 0 at the centerline and
z*=zl6r f*.
The normal coordinate y is zero at the floor such that the height of the grid varies from y of 86.3 S,. f* to 61.1 6 r f* at the entrance and the exit of the domain and y=y/S,. f*. The streamwise distance was normal- 30ized by the reference displacement thickness and centered at the theoretical shock impingement location (x l) so that x* (x—xsl)/S,. f*. The micro-ramp trailing edge is located at 57 S,. f* upstream of the inviscid shock impingement location (i.e. x*=-57). The full domain is decomposed into 11 zones 35
for parallelization to increase computational efficiency where each interfacing zones are abutting grids. FIG. 7b shows an enlarged side view of the grid for the baseline micro-ramp (FIG. 6a).
Referring to FIG. 9, the rescale-recycling zone whose 40
length is 29.5 S,. f
*
generates turbulent boundary layer flow at the inflow of the domain which is followed by an oblique shock induced by the 8° wedge on the ceiling. The µVGs were placed approximately at the mid-point between the inflow and the outflow of the domain which is upstream of the inviscid 45shock impingement region. The shock is then reflected from the impingement location and convects downstream passing through the outflow plane at x*=102. Data measurement to assess the µVG performance was conducted at the measuring plane (xm,) which is based at x*=86.2. Periodic boundary 50
conditions were imposed on the side walls of the domain to represent arrays of µVGs in the spanwise direction which would make the spacing between the adjacent µVG equal 23.7 S,. f
*.
Slip and no-slip conditions were imposed on the ceiling and the floor of the domain, respectively, where the outflow 55conditions are based on zero order pressure extrapolation. The grid stretching ratio (division of two consecutive cell lengths) in the normal direction to the wall is 1.15 where the first grid point normal to the wall is at y'1 (based on the shear stress at the inlet station of rescale-recycle zone). The 60
streamwise and the spanwise grid spacing correspond to x' of 28 and z' of 13 whereby the total number of grid points is 3.2 million nodes, which is denoted as the baseline grid (BG). Finer grid spacing was necessary in the zones that surround the µVG in order to conform to the boundaries of the geom- 65
etry, which is shown in vertical slice of the grid above the µVG in FIG. 8.
12
Validation, Mean Flow Convergence and Grid Indepen-dence
FIG. 9a shows a comparison between the mean MILES streamwise velocity at x m, and experimental data obtained by AFRL, (Air Force Research Labs), (also at a similar Reynolds number of 4,000 based on S,. f*) using the baseline grid. The No Ramp (NR) flowfield included the oblique shock wave but there was no control device. FIG. 8b shows a similar com-parison of the oblique-shock case for the baseline micro-ramp (BR). It shows that the fuller boundary layer measurements with the control device are consistent with the predicted trends.
The vortex generators were tested in a Mach 3 turbulent boundary layer at Re b, of 3,800 (based on S,. f)), where the freestream pressure and the temperature are 7076 N/m 2 and 582.3 K, respectively.
Referring to FIG. 10, different types of micro vortex gen-erators of FIG. 7 are placed upstream of the shock interaction with the boundary layer. This flow is subjected to an 8° oblique shock. To characterize the impact, the evolution of the turbulent structures is first discussed followed by that for the evolution of the mean streamwise velocity in terms of stream-wise, transverse, and spanwise distributions.
Next, the streamwise development of a spatially-averaged kinetic energy and streamwise vorticity is investigated, where the latter is compared to previous measurements in low-speed sub-sonic flow. Finally, the impact of the devices on down-stream stagnation pressure recovery, displacement thickness and shape factor are considered, along with the net change in separation area.
Turbulent Boundary Layer
FIG. 10 shows flow visualization of oblique shock interac-tion: a) density iso-surface for NR, b) velocity contours at y'=5 or NR and c) velocity contours at y'=5 for BR showing reference lengths of 1000 streamwise wall units and 100 wall spanwise wall units.
FIGS. 10a & 10b show instantaneous density iso-surfaces and streamwise velocity contours at y' of 5 without the flow control device. In terms of overall gas dynamics, FIG. 9a shows that the oblique shock wave propagating downward (shown in green) followed downstream by an expansion wave generated from the trailing edge of the shock wedge which also propagates downward (shown in green). The reflected shock from the turbulent boundary layer (shown in yellow) moves upwards and interacts with the expansion wave. It should be noted that the incoming oblique shock wave is two-dimensional while the reflected wave contains signifi-cant spatial undulations (and was found to be unsteady). These figures also show the evolution of the coherent struc-tures convecting through the shock. As the shock impinges on the boundary layer, the shapes of the structures just down-stream of the shock become more vertically pronounced (FIG. 10a). This is due, in part, to the boundary layer thick-ening and the adverse pressure gradient. The results also show a reduced aspect ratio of the structures, though they begin to relax towards the pre-shock aspect ratios further downstream (FIGS. 10a & 10b). The reduced aspect ratio and associated reduced coherence of the structures in the streamwise direc-tion near the shock may be attributed to the shock unsteadi-ness. In the present flow, the reflected oblique shock 106 was observed to undergo oscillations with amplitude on the order of 8,. f
*.
Referring to FIG. 10, the streamwise velocity contours indicate the scale and shape of the low speed streaks for the case with no flow control device. The lengths of the streaks are on the order of 1000 wall units where the spacing between each streaks are approximately 100 wall units upstream of the
the spacing widens approximately 15 percent as the flow convects through the shock impingement as shown in the 5
density iso-surface contours of FIG. 10a. Multiple recircula-tion regions are observed near the shock impingement so that the overall separation bubble is quite three-dimensional and unsteady. Upon insertion of the baseline micro-ramp (BR) as shown in FIG. 10c, the presence of the device causes a horse- io shoe vortex which induces flow separation at the foot of the micro-ramp and produces a counter-rotating vortex pair shown by the high speed streaks (yellow and orange) result-ing from the entrainment of high-speed fluid to the wall. As the vortex pair convects downstream, the high streamwise 15
vorticity fluid breaks up the center of the separation region. This contributes to the recovery of the boundary layer (which was afflicted by unsteadiness of the shock and the adverse pressure gradient) in the form of increased number of
high-speed regions. 20
Vortex Evolution
FIG. 11 shows cross-sections of time-averaged (T*°4) streamwise velocity contour at the trailing edge of µVGs (x*=-57 with the center of the vortices are indicated by the arrows) and the inviscid shock location (x* —O). FIG. 11 25
shows the spanwise view of the streamwise velocity contour. The counter-rotating vortex pair mentioned above appears as a pair of vortex tubes when examined just downstream of the µVG trailing edge (left-hand column with arrows indicating the center of the vortex cores). The two primary vortices 30
generated by the BR device are largest in size at the trailing edge and can be seen to locally reduce the boundary layer thickness close to the device due to the entrainment of high speed flow (FIG. lla). However, the boundary layer thick-ness increases away from the centerline indicating significant 35
spanwise variation.
Also shown in FIG. lla, are small secondary vortices (in blue) which form due to the corner flow at the ramp's side wall and the bottom floor. These secondary vortices counter rotate against the primary vortex and, contribute to the rise of 40
the primary vortex from the floor at the inviscid shock loca-tion. However, the rise is primarily driven by the upwash generated by the two counter-rotating vortices. The vortices are shown schematically in FIG. llb superimposed on the velocity field to show their influence. The vortices entrain 45
high-speed fluid downward along the outside edges to thin the boundary layer, but also pull low-speed fluid upwards in between the vortices. At this point (FIG. llb), the boundary layer under the vortex pair remains attached and thin despite the shock impingement which is one of the main benefits of 50
using such flow control devices. However, the boundary layer thickness is significantly increased in the outward regions due to flow separation (shown as dark blue region in FIG. llb). As the height of the micro-ramp is reduced by half with the HEIR geometry, the initial size of the vortex tube pair is 55
reduced proportionally but the vortex core strength is approximately maintained (as is that of the secondary vorti-ces) as shown in FIG. llc. At the inviscid shock location (FIG. 11d), the primary vortex pair is significantly weakened and does not provide as much centerline thinning as the BR 60
device. However, its lower initial height allows it to have a reduced altitude and decreased intensity appear to have reduced the undesirable thickening at the outer spanwise locations, noted for the BR case.
The micro-ramp reduced in width by half and denoted as 65
HWR yields a pair of primary counter-rotating vortices which are more circular and much closer together in the spanwise
counter-rotating vortices causes them to interact more and degrade in their strength as compared to the BR case. This is consistent with trends seen for low-speed subsonic devices which are spaced too close together. The boundary layer thickness (at the centerline) is thinned similar to that seen for the HEIR case but with somewhat more spanwise variation.
The split-ramp (SR) vortex generator is shown in FIG. llg at the trailing edge. In this case, the primary vortices are circular, similar to the case for HWR, but are separated by a significant spanwise spacing on the order of the device height. At the centerline, there is a high speed flow owing to the channel between the two halves of the device. The increased spanwise spacing allows the vortices to stay closer to the wall and with less dissipation further downstream (FIG. llh) as compared to the BR case. This spacing leads to an undesirable upwash near the centerline which causes some boundary layer thickening but also results in thinner boundary layer at outward spanwise locations.
Vortex tubes generated by BV and TV yield streamwise velocity fields which are quite similar to the SR case, but with some differences. At the trailing edge location, BV (FIG.11i) and TV (FIG. llk) show a substantial internal vortex (shown in green) between the vanes which do not retain the high-speed flow seen for the SR case. At the incident shock loca-tion, the similarities of the three cases (FIGS. 11h, j & l) are stronger, with the primary difference that the vane cases have vortex cores that are somewhat closer in spanwise spacing and somewhat higher in distance above the floor. This leads to less upwash near the centerline for the vane case (compared to SR), but all three have similarly thin boundary layers at the outward spanwise locations (as compared to the BR, HEIR and HWR cases).
The above results indicate that the last three devices tend to have the best downstream performance, which makes SR and TV particularly useful owing to their physical robustness. Generally, the differences between the BV and the TV are quite small, though the TV tends to have a bit less upwash so that its centerline region is somewhat better whereas the BV tend to have somewhat more high-speed (shown in red) fluid pulled down around the vortices.
Flow Separation Area
Flow separation area, defined as the surface region with negative shear stress, can be an important parameter for assessing the µVGs performance, given that a decrease in this area is a desirable feature. The mean flow separation area was obtained using a plane at y'=1 for the six geometries inves-tigated and is shown by the dark color regions in the left-hand column of FIG. 12. The first image shows the solid-wall no-ramp (NR) case where the separation at the shock inter-section region is two-dimensional and the accompanying streamwise view of the velocity field (right-hand side col-umn) indicates a thin separation coincident with the oblique shock impact. The left-hand side of baseline ramp (BR) case image shows a pair of thin separation regions related to the streamwise vortices near the centerline. Downstream of these, in the vicinity of the shock, the flow is seen to stay completely attached while the outer spanwise regions yield a much larger streamwise separation length. The outer span-wise changes are consistent with the BR streamspan-wise velocity contours on the right-hand column and both of these aspects are consistent with FIG. llb. The half-height micro-ramp case (HEIR) yields a similar result but does not completely eliminate the centerline separation, which is attributed to the reduced strength of the primary vortices. The HWR case is
US 8,656,957 B2
15
similar to the HEIR except that there is a fully attached cen-terline region though not as wide as for the BR case.
In general, all three of these cases increased the area of separation beyond the NR cases, as shown in Table 2. Table 2 shows spanwise averaged performance parameters for differ-ent µVGs with AsP,,R 8.01D6,,f*.
TABLE 2 BR HHR HWR SR BV TV a/aNR 0.95 0.99 0.98 0.97 0.97 0.96
6*16NR*
1.08 1.06 1.05 1.10 1.10 1.13 H/HNR 0.99 1.02 1.01 1.00 0.99 0.99 A,/A,
,,NR 1.29 1.39 1.50 0.97 0.99 0.85The SR, BV and TV cases are substantially different than the BR, HEIR, and HWR cases which indicate that the channel region between the vanes dramatically alters the flow. In particular, SR, BV and TV cases yielded separation regions which were much more two-dimensional and similar to the NR case though the indicated effects of the streamwise vor-tices are shown near the centerline. In general, all three of these devices reduced the area of separation beyond the NR case, with up to a 15% decrease for the TV case (Table 2). Thi s is attributed to the increased size of the primary vortices for these devices, e.g. note in FIG. 11 that the amount of yellow region for the SR, BV and TV cases is much larger than that for BR, HEIR and HWR cases.
Vortex Characteristics
To assess the characteristics of the streamwise vortices and their affect on the boundary layer in the vicinity of the shock wave, average values were obtained for various quantities at different downstream distances. In particular, a square spatial averaging window was defined which included a spanwise extent from the centerline of the ramps (z -0) to a position equal to the half-width of the BR height (z=1.46 h) and a vertical extent from the bottom floor of the computational domain (y-0) to a similar height (y=1.46 h). The limited vertical extent confines the averaging to be primarily within the turbulent boundary layer. Average values of the pressure and turbulent kinetic energy were also obtained in this square averaging window:
16
streamwise direction. The thickening of the boundary layer and separation before the shock impinges results in a well-established increase in the spatially-averaged pressure. This pressure continues to rise throughout the shock interaction
5 region indicated by the arrow which approximately extends from x** sl -10 to 10 over a distance that is consistent with the length of the separation bubbles.
FIG. 13 shows time-averaged streamwise velocity contour for a) spanwise view of flow separation region shown in dark 10 for negative wall shear stress at y~=1 and b) streamwise view
showing the oblique shock and the separation bubble (blue region) for x*=-57 to 19 at a spanwise location of z*=11.8 (consistent with the red arrow in FIG. lla);
15 FIG. 14 shows time-spatially averaged (for T*°4 for y*-0 to 4.66 and z*-0 to 4.66) values for pressure and turbulent kinetic energy at discrete streamwise locations. Arrows indi-cate the SBLI regions;
FIGS. 13a and 13b show that the BR, HEIR and HWR cases 20 are all nearly identical, but that the SR, BV and TV cases tend to have a less diffused pressure rise. This can be attributed to a reduction in their overall streamwise separation bubble length in comparison. Referring to FIGS. 13c & 13d, the spatially-averaged turbulent kinetic energy, K for all the 25 µVGs cases is somewhat higher than that for traditi