This is an Open Access document downloaded from ORCA, Cardiff University's institutional
repository: http://orca.cf.ac.uk/127327/
This is the author’s version of a work that was submitted to / accepted for publication.
Citation for final published version:
Al-Musawi, Ammar K., Anayi, Fatih and Packianather, Michael 2020. Three-phase induction motor
fault detection based on thermal image segmentation. Infrared Physics and Technology 104 ,
103140. 10.1016/j.infrared.2019.103140 file
Publishers page: http://dx.doi.org/10.1016/j.infrared.2019.103140
<http://dx.doi.org/10.1016/j.infrared.2019.103140>
Please note:
Changes made as a result of publishing processes such as copy-editing, formatting and page
numbers may not be reflected in this version. For the definitive version of this publication, please
refer to the published source. You are advised to consult the publisher’s version if you wish to cite
this paper.
This version is being made available in accordance with publisher policies. See
http://orca.cf.ac.uk/policies.html for usage policies. Copyright and moral rights for publications
made available in ORCA are retained by the copyright holders.
Abstract—Induction motors are widely used in many industrial applications. Hence, it is very important to monitor and detect any faults during their operation in order to alert the operators so that potential problems could be avoided before they occur. In general, a fault in the induction motor causes it to get hot during its operation. Therefore, in this paper, thermal condition monitoring has been applied for detecting and identifying the faults. The main contribution of this study is to apply new colour model identification namely Hue, Saturation and Value (HSV), rather than using the conventional grayscale model. Using this new model the thermal image was first converted into HSV. Then, five image segmentation methods namely Sobel, Prewitt, Roberts, Canny and Otsu was used for segmenting the Hue region, as it represents the hottest area in the thermal image. Later, different image matrices containing the best fault information extracted from the image were used in order to discriminate between the motor faults. The values which were extracted are Mean, Mean Square Error and Peak Signal to Noise Ratio, Variance, Standard Deviation, Skewness and Kurtosis. All the above features were applied in three different motor bearing fault conditions such as outer race, inner race and ball bearing defects with different load conditions namely No load, 50% load and 100% load. The results showed that the proposed HSV colour model based on image segmentation was able to detect and identify the motor faults correctly. In addition, the method described here could be adapted for further processing of the thermal images.
Index Terms—Induction motor, Thermal condition monitoring, HSV colour model, Image segmentation, Edge detection, Bearing faults.
I. INTRODUCTION
Different faults are likely to occur on the induction motor during its operation causing it to fail. However, through condition monitoring the lifetime of the motor could be increased by receiving up-to-date information about its behavior. In general, induction motors have two main types of faults namely electrical and mechanical, which are caused by heavy loading conditions. The most common and frequent fault is the mechanical fault as it accounts for about 53% of faults [1][2]. Generally, bearing defects are classified as mechanical faults referred to as inner race, outer race and ball bearing defects [3][4][5]. Recently, with the purpose of keeping the rotating machinery working in safe and reliable mode, the area of fault diagnosis based on condition monitoring has received
Ammar Khaleel Al-Musawi, Ministry of Higher Education and Scientific Research – University of Wasit – Iraq, [email protected] and Wolfson Centre for Magnetics, Cardiff University, Cardiff, CF24 3AA, UK, [email protected].
Fatih J. Anayi*, Wolfson Centre for Magnetics, Cardiff University, Cardiff, CF24 3AA, U.K, *[email protected].
the researchers’ attention to develop novel fault detection and classification methods which are capable of overcoming the limitations of the current condition monitoring methods. In recent years, Infrared Thermography (IRT) has been used as a condition monitoring technique, as it is intrusive, non-contact, single sensor based on the temperature measurements and fine-grained system [6]. Thus, infrared thermography has been adopted for monitoring the induction motors and diagnose its faults by comparing the hot region of the healthy motor image (reference image) with the hot region of the faulty motor image (faulty image). The thermal image contains much information about the motor and this information could be extracted using different image processing techniques [7]. Furthermore, the simplest way to identify the thermal image hotspot is by applying image segmentation methods. In [8] many segmentation methods have been discussed and compared with each other. The image segmentation relies on the thresholding because it is intuitive and simple to implement. Many studies have applied segmentation methods on grayscale image without considering the limitation of grayscale conversion where the aim is to separate the Region of Interest (ROI) from the background at specific threshold levels by using the gray-level histogram. In [9], the authors have applied Otsu method, an automatic threshold technique, for extracting the hottest region from the thermal image, which is widely used in different applications. Further, Infrared Thermal Anomaly Detection Algorithm (ITADA) has been used for detecting the faults in transformers, capacitors, etc., based on the statistical calculation of Otsu method using the gray-level histogram [7][8][9]. In [10] the authors have indicated that the IRT could monitor the temperature of any electrical device by sensing the device emission of infrared energy, and it has been widely known that the electrical equipment’s life reduces when the temperature is increased.
Nowadays, Artificial Intelligence (AI) based techniques are employed for automatic condition monitoring. In [11] a multilayer perceptron neural network algorithm has been used for diagnosing the electrical equipment faults based on gray-level histogram, gray-gray-level matrix and component based intensity features that were extracted from the thermal image. In [12] a novel feature extraction method known as Method of Area Selection of Image Differences (MoASoID) has been
Michael Packianather, School of Engineering, Cardiff University, Queen’s Buildings, The Parade, Cardiff, CF24 3AA, UK. [email protected].
Ammar K. Al-Musawi, Fatih Anayi*, Michael Packianather
Three-Phase Induction Motor Fault detection
based on Thermal Image Segmentation
2 proposed, which selects the area with the biggest change for
fault recognition, then uses these features as input for the classification system. In the work presented in [13] monochrome thermal image analysis has been carried out for pattern recognition with the application of area perimeter vector to detect the motor rotor fault relying on Bayes classifier. The authors in [14] detect failure of cooling system and the inter-turn faults based on two thermal profile indicators with the help of the International Electrical Testing Association (NETA). Further, more investigation has been done to detect the failure of the cooling system based on the infrared thermography technique, as it is essential for reducing the motor temperature [15]. In [16] the idea of isothermal process has been used to detect several types of induction motor faults in a petrochemical plant based on infrared images for displaying the temperature gradient. An extensive review for most of IRT applications on electrical and mechanical faults detection has been carried out in [17], which states that the IRT has proven to be an important tool for detecting and diagnosing faults. Meanwhile, in [18] the image segmentation has been applied for thermal image with the purpose of finding the edge of the ROI in thermal image. In [19] the Hough Transform and image segmentation has been applied for breast cancer detection based on thermal images. Additionally, in [20] different types of image segmentation methods such as Sobel, Roberts, Canny and many others have been applied for thermal images for finding the edge in thermal images. In [21] Markov Random Field (MRF) was applied on logo image to detect the ROI from the image based on image segmentation. Converting the thermal image to grayscale image and applying the image processing methods was not helpful enough to detect the faults correctly because it locates the point of rapid changes in intensity value of gray-level. Though this could also be done in the colour image, the problem is that it is not easy to gather the prior knowledge about the object colour. Many studies have applied the image segmentation methods in different fields such as logo detection, food processing, medial image processing, traffic signal system and many others [22]. However, very few researchers have applied the image processing methods in the field of condition monitoring based on HSV colour model especially for induction motor fault detection.
All the authors of the references quoted above have adopted the Red, Green and Blue (RGB) thermal image or grayscale image without considering the limitation of this method which leads to some information being lost while converting the original image to the grayscale or RGB image. Another drawback of this method is that the thermal image has colour variation from red through green to blue, thus applying the grayscale may lose significant information of the target object. Therefore, the new studies are required to look for ways to adapt to a new colour model for processing the thermal image. For this reason, the Hue, Saturation and Value (HSV) colour model has been applied in some condition monitoring applications such as monitoring the electrical equipment as in [23]. As a result, in this paper the thermal image was converted to HSV colour model rather than into grayscale for induction motor fault detection. Then, different image segmentation methods have
been applied for the purpose of detecting the hottest area, which are Sobel, Prewitt, Roberts, Canny and Otsu. Further, different image matrices have been applied to extract the best fault information from the image, which are Mean, Mean Square Error and Peak Signal to Noise Ratio, Variance, Standard Deviation, Skewness and Kurtosis in order to detect the induction motor fault correctly. This paper has been organized as follows: section II: describes the proposed feature extraction techniques, section III: presents the experimental study and section IV: gives the conclusion.
II. PROPOSED FEATURE EXTRACTION METHODS FOR THERMAL IMAGE PROCESSING
A. HSV Colour Model
The Hue-Saturation-Value (HSV) colour model is defined as how the human eyes sense colours. The following formulas have been used to convert Red, Green and Blue (RGB) image into HSV colour model in terms of its three components as stated below:
1. In Terms of Hue:
Hue value indicates how the eye perceives the object’s colour and this could be calculated from the red, green and blue colours by measuring the distance. Hue region is very helpful for detecting the hottest region because it works opposite to saturation as it is less meaningful when the saturation is 0 or when intensity is 0 or 1, and more meaningful when the saturation is 1. Consequently, Hue region has been used for further processing in order to detect the motor fault.
The formula of calculating the Hue value (H) is given below:
= { � ≤36 − � � >
� = cos− { [ R−G + R−B ]
[ R−G + R−B G−B ] } (1) Where � is the new image colour the R: Red, G: Green, B: Blue
2. In Terms of Saturation:
Saturation also known as “Chroma” describes the vividness or dullness of a color. The colour range is from 0 to 100%. The faded colour and grayness appears when the saturation value is low. Thus, the range of the grayness is from 0 to 1, if the value
is ‘0’ the colour is gray, while the colour is white if the value is
‘1’. In addition, the higher the fading, the grayer the colour based on the following formula ( : saturation):
= −
R+G+B [min , , � ] (2)
3. In terms of Value
Value represents the brightness of a colour. and it ranges between 0 - 100%. The colour is black when the value is ‘0’, and the colour brightness will change and show various colours when the value (I) increases based on the following formula: I = R + G + B (3) Where I represent the value.
Generally, RGB colour has been widely used in the optical instruments and digital images. However, RGB is not sensitive and helpful to statistical analysis and human visual inspection. Consequently, the non-linear transformation of HSV from RGB colour provides important information with more accuracy than the RGB colour. Hence, HSV was used in this study for processing and analyzing the thermal image of induction motors in order to extract the best and accurate fault information for fault detection.
B. Image Segmentation
Image segmentation is a procedure of dividing the image into several segments. It has three different approaches:
1- Finding the thresholds based on the pixel properties distribution. This technique has been applied onto image pixel intensity. Thus, it converts the digital image into binary image for further processing.
2- Identifying the boundaries between all regions by relying on the discontinuities in intensity level. The image has been divided into sub-regions based on the method rules such as all the image pixels must have the same gray-level if it is in one region. Furthermore, it relies on the neighboring pixel clustering, which sometimes referred as region according to their functional and anatomical roles.
3- Discovering any rapid changes in intensity value. It is known as edge based method. Generally, edge detection methods have been used for finding the discontinuities in gray-level.
Accordingly, image segmentation technique should be chosen based on the problem that needs to be segmented. The next section will discuss the edge detection techniques that have been used in this study for thermal image.
C. Image Segmentation based on Edge Detection
The edge detection methods of an image reduce the image data dimensionality to be processed and they may contain essential information regarding the object shape. This method is able to extract the exact edge line for all objects in the image with good location accuracy. Many papers in the literature covering these techniques are available in application such as biometrics, medical image processing, security, monitoring the electrical devices and many others. However, there is no study indicating and judging the performance of these techniques because all the studies done by authors so far are based on individual applications.
Several methods such as “Sobel”, “Prewitt”, “Roberts”,
“Canny” and “Otsu” have been used for finding and extracting
the hottest region from the thermal images by calculating the gradient. The following sub-sections will review these techniques briefly.
i. Sobel Edge Detection
It was introduced in 1970 by Sobel [24]. It precedes the edges at those points where the gradients are higher. The gradient ( ) is the difference between the columns and rows of neighborhood 3x3 which is calculated by Sobel operators.
Table 1 shows the center pixel in each column and raw [23].
Table 1: Image neighborhood. Z1 Z2 Z3 Z4 Z5 Z6 Z7 Z8 Z9 Where z (1 to n) is the pixel value.
= √ + (4) Where is the gradient, & � are Sobel operators in the X and Y- axis respectively.
ii. Prewitt edge detection
It has been proposed in 1970 by Prewitt [24]. It detects the edges of an image in vertical and horizontal direction. The gradient-based edge detector which operates in the 3*3 neighborhood uses two masks as shown in tables 2 and 3.
Table 2: Masks for direction. -1 -1 -1
0 0 0 1 1 1
Table 3: Masks for direction. -1 0 1
-1 0 1 -1 0 1
Prewitt edge detection technique is simple to implement than the Sobel method, but it produces noisier results in some situations.
iii. Roberts Edge Detection
Lawrence Roberts introduced the Roberts edge detection method in 1965 [25]. It performs a 2-Dimensional spatial gradient, which is quick to compute with simple measurements performed on the image. In addition, each point of the output image represents the estimated absolute magnitude of the spatial gradient at that point. In case of 2*2 gradient operator as shown in tables 4 and 5, Roberts operator has been used for calculating the difference between adjacent pixels.
Table 4: masks for direction in Robert’s operators. -1 0
0 1
Table 5: masks for direction in Robert’s operators. 0 -1
1 0
iv. Canny Edge Detection
It is considered as multi-step method that can detect a wide range of edges in the image with noise reduction [22], as shown in the following steps:
1- Noise Reduction
Gaussian filter has been applied to reduce the noise and unwanted details in the image based on the following equation: , = � , ∗ , (5) Where , is the gradient operator, � , is the Gaussian filter, � is the standard deviation, , is the
4 adaptive filter and , are the image matrices.
The � is calculated by: �=
√ �� � −
+
� (6)
2- The Gradient Computation
The gradient magnitude and direction have been calculated at every single point based on the Sobel operator for both vertical ( ) and horizontal ( ) directions. The gradient can be calculated for each pixel from two images as follows:
� �� � = √ + (7) Where and are the derivatives of point X and Y in horizontal and vertical direction.
In this step, two cases have been considered for gradient: the first one is the high gradient, which means that there is a significant change in the colour (implying edge), secondly is the low gradient, which means that there is no substantial change (no edge).
3- Non-Maximum Suppression
In this step, full image scanning has been done in order to remove any unwanted pixels that may not be considered as an edge. Then, each pixel will be checked, whether it is a local maximum or not. If it is not a local maximum, the pixel will be set to zero, otherwise it will be set to 1 and considered as an edge.
4- Hysteresis Thresholding
The decision will be made to all image pixels in order to determine if they are real edges or not. Therefore, two values for thresholding are needed, maxVal and minVal. Any pixel value with the intensity gradient less than minVal is considered as non-edge, while any pixel value more than maxVal is considered as an edge. The pixel values that lies between these two values (maxVal and minVal) will be checked based on the connectivity to decide either they are an edge or not. They will not be considered as an edge if they are connected to non-edge pixels and they will be considered as an edge if they are connected to an edge.
5- Otsu Method
This method has been widely applied for thermal image processing in order to detect the hottest regions. It automatically performs clustering based on image threshold. Every image has two classes of pixels, and then it separates these classes by calculating the optimum threshold with the aim of differentiating them into different classes based on the intra-class variance. Four important steps need to be followed in this method to obtain the Otsu image, as explained below:
1. Select average value of image intensity (estimated threshold).
2. Divide the image into two regions R1 and R2, and then calculate the mean � and � values for each region. 3. Calculate the mean value of � and � , the mean
gray-level value
= � + � (8) Where is the image mean gray-level value, � and � are the image mean gray-level values for region 1 and region 2.
4. Select a new threshold
5. Repeat steps 2-4 until � and � values do not change. All the proposed edge detection methods above have been used for detecting the hottest region and extracting the best information from the motor thermal image in order to detect the motor faults. In addition, the results that are obtained from the edge detection methods (segmented images) have been used for extracting the image metrics, for example, mean, mean square error and peak signal to noise ratio, variance, standard deviation, skewness and kurtosis with the purpose of using them for fault discriminating. The following section describes them briefly.
D. Image Metrics
The most common image metrics used contains Mean (�), Mean Squared Error (MSE) and Peak Signal to Noise Ratio (PSNR), Variance (V), Standard Deviation (SD), Skewness (S) and Kurtosis (K) as described below [19][26]:
1. Mean (�)
In image processing, the mean is used for noise reduction. It also calculates the average values and extract the brightness information from the image. Many types of mean values have been discussed in [18] such as harmonic mean, geometric mean, arithmetic mean and contra-harmonic mean. All of them relied on the arithmetic mean for reducing the image noise, which could be calculated by the equation given below:
μ = ∑r,c Wg r, c (9) Where is the noisy image, �, are the row and column coordinates respectively, within the size of ∗ image (�).
2. Mean Square Error (MSE) & Peak Signal to Noise Ratio
(PSNR)
MSE measures the differences between the reference image pixel and threshold image. The PSNR value relies on the MSE value as shown in the following formulae:
� = ∑= ∑= , − , (10) � = log −
√ �� (11) Where x (i,j) is the reference image, y (i,j) is the threshold image, and are the height and width of the reference image respectively.
3. Variance
It measures how far a set of numbers is spread out [20]. In image processing, it can be utilized to determine the edge position. Mathematically variance is given by:
Where σ is the variance value.
4. Standard Deviation (SD)
It measures the variation or disruption, which exists from the average (mean). In case of low standard deviation, the data point tends to be very close to the mean, while in case of high standard deviation, the data points spread out over the range of values. Consequently, the standard deviation could be mathematically calculated by using the following formula:
��= √ − ∑�,� � �, − − ∑�,� � �, (13)
The standard deviation filter is able to recognize some important patterns.
5. Skewness
It measures the asymmetry. A data set, is considered as asymmetric if it looks the same to the left and right of the center [21]. Skewness can be positive, negative or undefined [27]. Qualitatively, a positive value indicates that the tail on the right side is longer than the tail on left side. However, a negative value indicates that the tail on the left side is longer than the right side, and the zero value (undefined) indicates that the values have been distributed on both sides, which is defined as:
= − ∑�,� � − ∑�,� �� �,� − −∑�,� �� �,� ( −∑�,� � −∑�,� �� �,� − − ∑�,� �� �,� )
(14)
In image processing, the glossier and darker surfaces tend to be more positively skewed than other surfaces. Thus, the skewness has been used for making judgment between the image surfaces.
6. Kurtosis
It calculates ratio of the four central moment of distribution. In other words, it measures whether the data look heavy or light tailed relative to the distribution [21], [28]. Thus, the data set with high Kurtosis tend to have heavy tails, and the data with low kurtosis tend to have light tails or lack of outliers as defend below:
� = − ∑�,� � −∑�,� �� �,� − − ∑�,� �� �,� ( −∑�,� � − ∑�,� �� �,� − −∑�,� �� �,� )
(15)
In digital image processing, Kurtosis is interpreted in combination with noise and resolution measurement. High Kurtosis goes hand in hand with low noise and resolution. These measures in the image metrics have been adopted in this study for identifying the motor faults, as they are easy and fast
to be calculated by using “MATLAB R2015b” software for
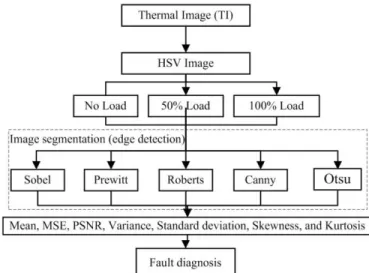
coding and storing them as “Excel” file sheet. Figure 1 illustrates the thermal image processing procedure followed in the experimental study, which is given in the following section.
Figure 1: Thermal image processing flow diagram. III. EXPERIMENTAL STUDY
The experimental setup used in this study is shown in figure 2. The test rig has different equipment which are three-phase
squirrel cage induction motor (model “Clarke”, 0.75 kW output
power, and speed 1480 rpm), “AW” dynamometer which is used for creating the load to the motor and “FLIR C2” thermal image camera for capturing the thermal images as shown in figure 3.
Figure 2: Schematic diagram of the test rig used in the experimental study.
Figure 3: The photograph of the test rig used in the experimental study. During the experiment the thermal image for the healthy motor were captured in order to be used as reference images to be compared with the faulty images. Three bearing faulty conditions were investigated in this study which are inner race, outer race and ball bearing defects. The fault was created by drilling a 0.2 cm hole into the outer race, inner race and one ball
Dynamometer IM
Thermal Camera
Control Unit V: Volt.
RPM: Revolutions per Minute. Hz: Hertz.
6 from its cage was removed as shown in figure 4, the deep
groove ball bearings (6204-Z) was used in the tests.
Figure 4: Bearing, inner and outer race faults.
1) Experimental procedure
First of all, the thermal camera parameters were set according to the experimental conditions and most of these parameters were set automatically. However, most important parameters were set according to the camera specification and experimental requirements such as emissivity, scale temperature, distance, focal length and relative humidity as shown in table 6. All the parameters were chosen according to the test rig conditions and were maintained for all three induction motor faults in order to have the same image dimension for all the faults.
Table 6: Thermal camera specification and fault description.
Thermal camera (FLIR C2)
Focal length: 1.54 mm(millimeter)
IR sensor: 80*60 (4800 measurement pixels). Storage temperature range: -40°C to +70°C (Celsius). Minimum focus distance: 0.15 meter.
Accuracy: ±2°C.
Thermal sensitivity: <0.10°C
Fault simulator
Healthy motor.
Outer race bearing defect. Ball bearing defect. Inner race bearing defect.
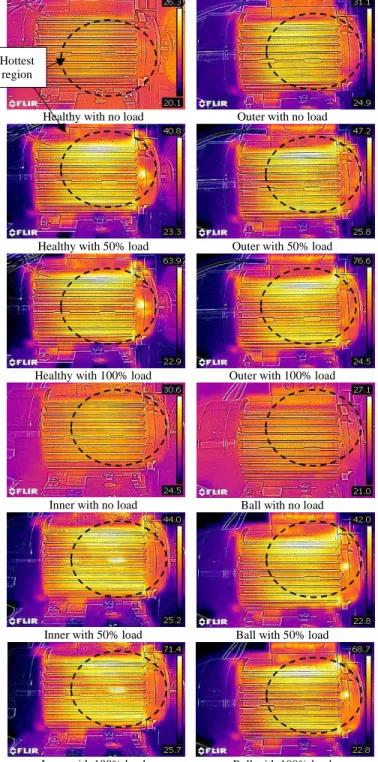
In this study, the analysis was done by capturing the thermal image for the healthy motor in order to be used as reference image and later to compare it with the faulty motor image. In the experimental work, the motor was set to normal condition with a full speed of 1480 rpm (No-Load condition), then the first image was captured after 10 minutes of running in normal condition and the load was increased slightly by AW dynamometer to 50% load condition. Then, the image was captured after 15 minutes of running in 50% load, as well as under 100% load. Afterwards, in each of the load condition, the healthy, outer race bearing defect, ball bearing defect and inner race bearing defect status were captured by the thermal image FLIR C2. The data from the thermal FLIR C2 camera was saved to the camera internal memory and then transferred to the PC (Personal Computer) for further processing. Figure 5 illustrates the thermal images for healthy and faulty motor with three load conditions.
Healthy with no load Outer with no load
Healthy with 50% load Outer with 50% load
Healthy with 100% load Outer with 100% load
Inner with no load Ball with no load
Inner with 50% load Ball with 50% load
Inner with 100% load Ball with 100% load Figure 5: Thermal images for healthy motor and faulty motor under no load,
50% and 100% load.
2) Results and discussion
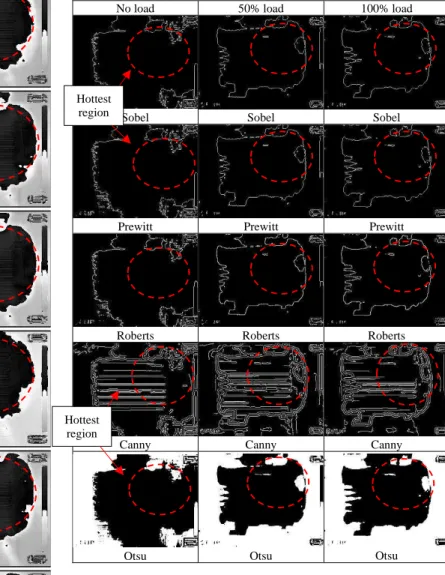
All motor thermal images were converted into HSV colour model image in order to extract the hottest region from the image based on the Hue region, as it was able to detect the hottest region. Figure 6 illustrates the Hue region for the healthy and faulty image with three different load conditions (No-load, 50% load and 100% load). In figure 6 the hottest region clearly appeared after applying the load to the motor, which indicates that the proposed Hue image technique and the image segmentation methods have worked successfully for detecting the motor hot spot without relying on the grayscale colour Outer race defect Inner race defect Ball bearing defect Hottest region
model.
Figure 6: Hue region for healthy (a: No load, b: 50% load, c: 100% load), outer race (d: No load, e: 50% load, f: 100% load), inner race (g: No load, h:
50% load, i: 100% load), ball (j: No load, k: 50% load, l: 100% load). Then the edge detection was applied based on the threshold of the Hue image. Later, the gradient based edge detection techniques such as Sobel, Prewitt, Roberts, Canny and Otsu were used for detecting the hottest region as shown in figure 7. This figure illustrates the image segmentation differences between the hottest regions found on the healthy motor whereby demonstrating that the image segmentation methods have the ability to detect the hottest region based on the Hue image. Careful examination of the figures shows that the hotspot has appeared clearly on the motor image with 50% and 100% loads. Additionally, the hotspots of 100% load condition are narrower than those hotspots for 50% load, which would be helpful for
the operators to diagnose the motor faults correctly. As stated earlier, the Hue region image segmentation was adopted for further processing.
No load 50% load 100% load
Sobel Sobel Sobel
Prewitt Prewitt Prewitt
Roberts Roberts Roberts
Canny Canny Canny
Otsu Otsu Otsu
Figure 7: Thermal image segmentation for healthy motor with different load conditions and segmentation method.
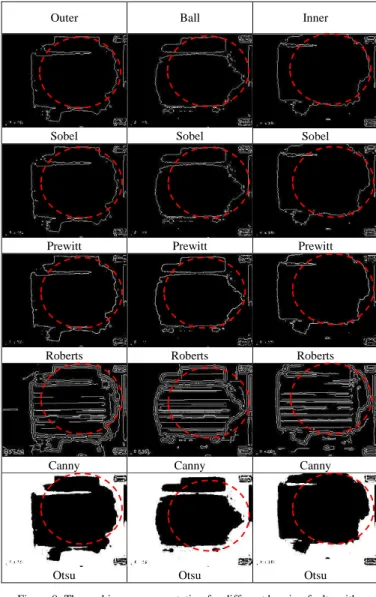
Further, figures 8, 9, and 10 show the results of applying edge detection algorithms on all the faulty bearing defects (outer race, inner race and ball bearing) with three different load conditions. In these figures, all image segmentation methods produced different patterns for all the faults and conditions. This gives the proposed technique the ability to detect the motor faults correctly. These results show that each fault has its own temperature pattern, for example, in case of no load, the hottest pattern is smaller than the pattern generated for 50% load condition. This indicates that the proposed Hue image segmentation method has the ability not only to detect the hottest pattern but also to identify the fault based on the motor temperature as illustrated in the figures shown below. In addition, the difference between the bearing faults was obvious based on the Hue image segmentation due to their effect on the motor rotation behavior. The proposed Hue image segmentation is better than grayscale image segmentation as the latter method is prone to loose most of the image information after the conversion. Hence, in this paper the Hue image segmentation was used to obtain as much information as possible in order to be used for detecting the motor faults
a
b
c
d
e
f
g
h
i
j
k
l
Hottest region Hottest region Hottest region Hottest region8 accurately.
Outer Ball Inner
Sobel Sobel Sobel
Prewitt Prewitt Prewitt
Roberts Roberts Roberts
Canny Canny Canny
Otsu Otsu Otsu
Figure 8: Thermal image segmentation for different bearing faults with no load.
Outer Ball Inner
Sobel Sobel Sobel
Prewitte Prewitt Prewitt
Roberts Roberts Roberts
Canny Canny Canny
Otsu Otsu Otsu
Figure 9: Thermal image segmentation for different bearing faults with 50% load.
Outer Ball Inner
Sobel Sobel Sobel
Prewitt Prewitt Prewitt
Roberts Roberts Roberts
Canny Canny Canny
Otsu Otsu Otsu
Figure 10: Thermal image segmentation for different bearing fault with 100% load.
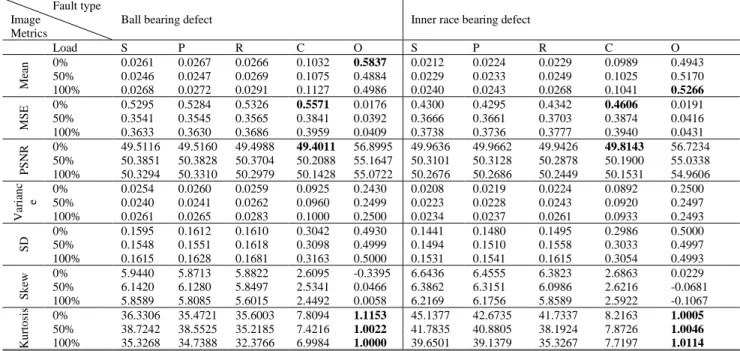
After various segmentation techniques were applied on all motor thermal images, the next step was to calculate the image matrices, which are mean, mse, psnr, variance, standard deviation, skewness and kurtosis, for each segmentation method in order to extract the best information from the image for the purpose of discriminating between the faults. All the comparisons were done based on the Hue region image as shown in tables 7a and 7b.
According to the results given in tables 7a and 7b, the image metrics methods based on the Hue region had good attributes to discriminate between the motor faults. For example, in case of healthy motor, the image segmentation metrics had similarities in values between load conditions; however, it was more helpful comparing it to other faults. It was noted that the highest mean in the healthy motor was 0.5305 with 50% load based on Otsu method compared to other methods, thus making it to be
distinguishable for motor faults detection. Similarly, the highest mean was 0.5221, 0.5837 and 0.5266 for outer, ball and inner
bearing defects with different load conditions respectively. Thus, the Otsu method was able to obtain satisfactory results for motor fault detection comparing to other methods (Sobel, Prewitt, Roberts, Canny) as shown in the tables 7a and 7b. In addition, the Canny edge detection technique obtained very good results based on the MSE and PSNR as the lager MSE and smaller PSNR was different compared to other methods as shown in tables 7a and 7b. The above results show
that the proposed method was able to extract good features from the image for motor fault detection.
Table 7ba: Image metrics values for the thermal images. Fault type
Image Metrics
Healthy motor Outer bearing defect
Load S P R C O S P R C O M ea n 0% 0.0333 0.0330 0.0339 0.1096 0.3409 0.0240 0.0246 0.0260 0.0958 0.5221 50% 0.0241 0.0247 0.0272 0.1131 0.5305 0.0285 0.0283 0.0323 0.0927 0.5179 100% 0.0256 0.0259 0.0283 0.0880 0.5270 0.0274 0.0274 0.0308 0.0948 0.5160 M S E 0% 0.3554 0.3551 0.3568 0.3951 0.0204 0.3730 0.3731 0.3741 0.3880 0.0394 50% 0.3865 0.3863 0.3895 0.4069 0.0408 0.3838 0.3841 0.3835 0.3947 0.0430 100% 0.3821 0.3820 0.3863 0.3944 0.0413 0.3815 0.3808 0.3808 0.3926 0.0432 P S N R 0% 50.3770 50.3793 50.3684 50.1473 56.5785 50.2722 50.2716 50.2658 50.1864 55.1558 50% 50.1948 50.1962 50.1780 50.0836 55.0775 50.2103 50.2088 50.2118 50.1495 54.9617 100% 50.2197 50.2206 50.1964 50.1512 55.0526 50.2231 50.2274 50.2274 50.1611 54.9548 V ar ia n ce 0% 0.0322 0.0320 0.0328 0.0976 0.2247 0.0234 0.0240 0.0253 0.0866 0.2495 50% 0.0235 0.0241 0.0265 0.1003 0.2491 0.0277 0.0275 0.0313 0.0841 0.2497 100% 0.0249 0.0252 0.0275 0.0802 0.2493 0.0266 0.0266 0.0298 0.0858 0.2497 SD 0% 0.1794 0.1788 0.1810 0.3124 0.4740 0.1531 0.1549 0.1590 0.2943 0.4995 50% 0.1532 0.1553 0.1627 0.3167 0.4991 0.1664 0.1659 0.1769 0.2900 0.4997 100% 0.1579 0.1588 0.1660 0.2833 0.4993 0.1632 0.1632 0.1728 0.2929 0.4997 S k ew 0% 50% 5.2028 6.2115 5.2244 6.1193 5.1505 5.8115 2.4428 2.4988 -0.1221 0.6714 5.6669 6.2187 5.6882 6.1403 5.2880 5.9617 2.8084 2.7468 -0.0884 -0.0716 100% 6.0108 5.9731 5.6839 2.9093 -0.1080 5.7905 5.7935 5.4318 2.7671 -0.0640 K u rt o si s 0% 28.0693 28.2939 27.5278 7.2442 1.4507 39.6727 38.7027 36.5417 8.5449 1.0078 50% 39.5826 38.4459 34.7739 6.9672 1.0149 33.1134 33.3553 28.9634 8.8871 1.0051 100% 37.1296 36.6773 33.3066 9.4640 1.0117 34.5296 34.5643 30.5049 8.6569 1.0041
MSE = Mean Squire Error, PSNR = Peak to Signal Noise Ratio, SD = Standard Deviation, S = Sobel, P = Prewitt, R = Roberts, C = Canny, O = Otsu
Table 7a: Image metrics values for the thermal images. Fault type
Image Metrics
Ball bearing defect Inner race bearing defect
Load S P R C O S P R C O M ea n 0% 0.0261 0.0267 0.0266 0.1032 0.5837 0.0212 0.0224 0.0229 0.0989 0.4943 50% 0.0246 0.0247 0.0269 0.1075 0.4884 0.0229 0.0233 0.0249 0.1025 0.5170 100% 0.0268 0.0272 0.0291 0.1127 0.4986 0.0240 0.0243 0.0268 0.1041 0.5266 M S E 0% 0.5295 0.5284 0.5326 0.5571 0.0176 0.4300 0.4295 0.4342 0.4606 0.0191 50% 0.3541 0.3545 0.3565 0.3841 0.0392 0.3666 0.3661 0.3703 0.3874 0.0416 100% 0.3633 0.3630 0.3686 0.3959 0.0409 0.3738 0.3736 0.3777 0.3940 0.0431 P S N R 0% 49.5116 49.5160 49.4988 49.4011 56.8995 49.9636 49.9662 49.9426 49.8143 56.7234 50% 50.3851 50.3828 50.3704 50.2088 55.1647 50.3101 50.3128 50.2878 50.1900 55.0338 100% 50.3294 50.3310 50.2979 50.1428 55.0722 50.2676 50.2686 50.2449 50.1531 54.9606 V ar ia n c e 0% 0.0254 0.0260 0.0259 0.0925 0.2430 0.0208 0.0219 0.0224 0.0892 0.2500 50% 0.0240 0.0241 0.0262 0.0960 0.2499 0.0223 0.0228 0.0243 0.0920 0.2497 100% 0.0261 0.0265 0.0283 0.1000 0.2500 0.0234 0.0237 0.0261 0.0933 0.2493 SD 0% 0.1595 0.1612 0.1610 0.3042 0.4930 0.1441 0.1480 0.1495 0.2986 0.5000 50% 0.1548 0.1551 0.1618 0.3098 0.4999 0.1494 0.1510 0.1558 0.3033 0.4997 100% 0.1615 0.1628 0.1681 0.3163 0.5000 0.1531 0.1541 0.1615 0.3054 0.4993 S k ew 0% 50% 5.9440 6.1420 5.8713 6.1280 5.8822 5.8497 2.5341 2.6095 0.0466 -0.3395 6.3862 6.6436 6.3151 6.4555 6.0986 6.3823 2.6216 2.6863 0.0229 -0.0681 100% 5.8589 5.8085 5.6015 2.4492 0.0058 6.2169 6.1756 5.8589 2.5922 -0.1067 K u rt o si s 0% 36.3306 35.4721 35.6003 7.8094 1.1153 45.1377 42.6735 41.7337 8.2163 1.0005 50% 38.7242 38.5525 35.2185 7.4216 1.0022 41.7835 40.8805 38.1924 7.8726 1.0046 100% 35.3268 34.7388 32.3766 6.9984 1.0000 39.6501 39.1379 35.3267 7.7197 1.0114
10 Furthermore, the variance and the standard deviation measures
were nearly similar values, as the standard deviation is the square root of variance. Therefore, their values were less helpful to detect the motor faults due to their overlap with other features, which may lead to misclassification of the faults. However, comparing to other methods such as the MSE and PSNR, these values were very helpful for induction motor fault detection as they could help the operators to identify the motor faults in an early stage to prevent any potential problems occurring much later.
In terms of skewness and Kurtosis, the values obtained for skewness for all motor conditions were supportive as they indicate the normality and modelled distribution of the motor dataset. Hence, the higher the skewness the higher the skewness of the data. In addition, the skewness values for all induction motor conditions were recorded at values higher than -0.5 and lower than 7 which means that the data were moderately skewed. While the best Kurtosis values were obtained by Otsu method because the optimal value of kurtosis is 3 and the Otsu method achieved the best results among all the other methods as shown in tables 7a and 7b. The results have shown that the image segmentation based on the Hue image is capable of obtaining very satisfactory results for identifying the faults severity in the induction motors. As stated in the literature, most of the researchers have adopted the grayscale colour model for identifying the electrical faults. However, the proposed Hue colour model was able to extract very good features for motor fault identification without using any classifier. Furthermore, the image metrics were very helpful for extracting the best information from the segmented Hue image necessary to recognize the motor fault correctly.
Consequently, the results have indicated that some of the proposed image segmentation methods and metrics were very helpful and have significant discriminatory features to not only detecting the fault but also for diagnosing it. These calculations have also shown that though they were able to detect the faults there were difficulties in making a distinction between the motor load conditions. In this case, the problem was overcome as long as the motor fault was detected and diagnosed correctly, and there was no need to have much information about the load. Overall, the Canny and Otsu methods were able to obtain better results than other methods and they could be used for fault detection based on the proposed HSV colour model. Thus, the proposed image segmentation methods were successfully applied and the results have made a positive impact on the use of induction motor and its fault detection and identification.
IV. CONCLUSION
In this study, thermal image condition monitoring has been used for induction motor fault detection based on the HSV colour model and different image segmentation methods such as Sobel, Prewitt, Roberts, Canny and Otsu have been presented. The thermal image with Hue region has been used for fault detection as it has the ability to detect the image’s hottest region. Then, different image matrices have been applied to the Hue image in order to extract the best fault information. Three different induction motor faults have been investigated with the
aim of testing the ability of the proposed techniques for the detection of motor faults such as outer race, inner race and ball bearing defects with different load conditions based on thermal condition monitoring. The main advantage of the proposed technique is that it has the ability to detect and identify the motor faults accurately with less time and computational complexity. While the main disadvantage is that it is not able to detect or identify the motor load, which is normally not a big issue as the motor fault detection is more important than identifying whether the motor has been loaded or not. Finally, the proposed HSV color model has been able to successfully detect the induction motor fault based on the Hue region and extract best features which could be used for further processing. The future work will focus on how to use these features in conjunction with a classification system to classify the faults. ACKNOWLEDGMENT
This research has been sponsored by the Ministry of Higher Education and Scientific Research – University of Wasit – Iraq. REFERENCES
[1] Y. Han and Y. H. Song, “Condition Monitoring Techniques for Electrical Equipment—A Literature
Survey,” IEEE Trans. Power Deliv., vol. 18, no. 1, pp. 4–13, 2003.
[2] J. Cusidó, L. Romeral, J. A. Ortega, A. Garcia, and J.
Riba, “Signal injection as a fault detection technique,”
Sensors, vol. 11, no. 3, pp. 3356–3380, 2011.
[3] A. M. D. Younus and B. S. Yang, “Intelligent fault diagnosis of rotating machinery using infrared thermal
image,” in Expert Systems with Applications, 2012, vol. 39, no. 2, pp. 2082–2091.
[4] M. D. Prieto, G. Cirrincione, A. G. Espinosa, J. A. Ortega, and H. Henao, “Bearing fault detection by a novel condition-monitoring scheme based on statistical-time features and neural networks,” IEEE
Trans. Ind. Electron., vol. 60, no. 8, pp. 3398–3407,
2013.
[5] H. S. Kumar, P. Srinivasa Pai, N. S. Sriram, and G. S. Vijay, “ANN based evaluation of performance of wavelet transform for condition monitoring of rolling
element bearing,” in Procedia Engineering, 2013, vol. 64, pp. 805–814.
[6] S. Bagavathiappan, B. B. Lahiri, T. Saravanan, J.
Philip, and T. Jayakumar, “Infrared thermography for condition monitoring - A review,” Infrared Physics and
Technology, vol. 60. pp. 35–55, 2013.
[7] Y. C. Chou and L. Yao, “Automatic diagnosis system
of electrical equipment using infrared thermography,”
in SoCPaR 2009 - Soft Computing and Pattern
Recognition, 2009, pp. 155–160.
[8] N. R. Pal and S. K. Pal, “A review on image
segmentation techniques,” Pattern Recognit., vol. 26, no. 9, pp. 1277–1294, 1993.
[9] G. Singh, T. C. Anil Kumar, and V. N. A. Naikan,
“Induction motor inter turn fault detection using
infrared thermographic analysis,” Infrared Phys.
Technol., vol. 77, pp. 277–282, 2016.
the reliability of electrical equipment by using infrared
thermography,” Infrared Physics and Technology, vol. 55, no. 4. pp. 236–245, 2012.
[11] A. S. N. Huda and S. Taib, “Suitable features selection for monitoring thermal condition of electrical
equipment using infrared thermography,” Infrared
Phys. Technol., vol. 61, pp. 184–191, 2013.
[12] A. Glowacz and Z. Glowacz, “Diagnosis of the three
-phase induction motor using thermal imaging,”
Infrared Phys. Technol., vol. 81, pp. 7–16, 2017.
[13] A. Glowacz, A. Glowacz, and Z. Glowacz,
“Recognition of Thermal Images of Direct Current
Motor with Application of Area Perimeter Vector and
Bayes Classifier,” Meas. Sci. Rev., vol. 15, no. 3, pp. 119–126, 2015.
[14] G. Singh and V. N. A. Naikan, “Infrared thermography based diagnosis of inter-turn fault and cooling system failure in three phase induction motor,” Infrared Phys.
Technol., vol. 87, pp. 134–138, 2017.
[15] G. Singh, T. C. A. Kumar, and V. N. A. Naikan, “Fault diagnosis of induction motor cooling system using
infrared thermography,” in 2016 IEEE 6th International Conference on Power Systems, ICPS 2016, 2016.
[16] D. Lopez-Perez and J. Antonino-Daviu, “Failure detection in industrial electric motors through the use of infrared-based isothermal representation,” in Proceedings IECON 2017 - 43rd Annual Conference of the IEEE Industrial Electronics Society, 2017, vol. 2017-January, pp. 3822–3827.
[17] R. Alfredo Osornio-Rios, J. A. Antonino-Daviu, and R. De Jesus Romero-Troncoso, “Recent industrial
applications of infrared thermography: A review,”
IEEE Trans. Ind. Informatics, vol. 15, no. 2, pp. 615–
625, 2019.
[18] R. Gonzalez and R. Woods, Digital image processing. 2002.
[19] V. Kumar and P. Gupta, “Importance of Statistical
Measures in Digital Image Processing,” Int. J. Emerg.
Technol. Adv. Eng., vol. 2, no. 8, pp. 56–62, 2012.
[20] S. Aja-Fernández, R. S. J. Estépar, C. Alberola-López, and C.-F. Westin, “Image quality assessment based on
local variance.,” Proc. 28th IEEE EMBS Annu. Int.
Conf., vol. 1, pp. 4815–8, 2006.
[21] D. N. Joanes and C. A. Gill, “Comparing measures of sample skewness and kurtosis,” J. R. Stat. Soc. Ser. D
Stat., vol. 47, no. 1, pp. 183–189, 1998.
[22] J. Canny, “A Computational Approach to Edge
Detection,” IEEE Trans. Pattern Anal. Mach. Intell., vol. PAMI-8, no. 6, pp. 679–698, 1986.
[23] T. Dutta, J. Sil, and P. Chottopadhyay, “Condition monitoring of electrical equipment using thermal image
processing,” in 2016 IEEE 1st International
Conference on Control, Measurement and
Instrumentation, CMI 2016, 2016.
[24] R. C. Gonzalez, R. E. Woods, and S. L. Eddins, Digital Image Processing Using MATLAB, vol. 1. 2004. [25] L. Gi. Roberts, “Machine perception of three
-dimensional solids,” 1965.
[26] Ashish and Aijay, “Review on thermal image
processing techniques for machine condition
monitoring,” Int. J. Wirel. Commun. Netw. Technol., vol. 3, no. 3, pp. 49–53, 2014.
[27] I. Motoyoshi, S. Nishida, L. Sharan, and E. H. Adelson,
“Image statistics and the perception of surface qualities,” Nature, vol. 447, no. 7141, pp. 206–209, 2007.
[28] R. Ferzli, L. J. Karam, and J. Caviedes, “A robust image sharpness metric based on kurtosis measurement of
wavelet coefficients,” Proc. Int. Work. Video Process. Qual. Metrics Consum. Electron., vol. 12, no. 3, 2005.
V. LIST OF ABBREVIATION HSV Hue, Saturation, Value
MSE Mean Squared Error
PSNR Peak Signal to Noise Ratio
SD Standard Deviation
ITADA Infrared Thermal Anomaly Detection Algorithm
MRF Markov Random Field
RGB Red, Green, Blue
f Gradient
z Image pixel value
Sx, Sy Sobel operators in the X and
Y- axis
IRT Infrared Thermography
MoASoID Method of Area Selection of Image Differences
NETA International Electrical Testing Association I Value , Gradient operator � , Gaussian filter � Variance , Adaptive filter , Image matrix
and Derivatives directions of X and Y points
� , � The values for each region of image after division into two regions
μ Mean
x (i, j) Reference image y (i, j) Threshold image
and The height and width of reference image respectively
RPM Rotate per Minute
Hz Hertz
Ø Phase
IM Induction Motor
mm Millimetres