Groundwater Quality Assessment for Drinking Water using
Water Quality Index (WQI): A Case Study of Eastern Obolo,
Southeastern Nigeria
Uduak E. AFFIAH1 Iniemem J. INIM1* Moshood N. TIJANI2 Abasiama O. ITUEN1
1.Department of Geology, Akwa Ibom State University, Mkpat Enin – Nigeria 2.Department of Geology, University of Ibadan, Ibadan - Nigeria
Abstract
Groundwater, an important source of drinking water for coastal communities of the world including Eastern Obolo, South eastern Nigeria has been adversely affected by both natural and anthropogenic activities. Understanding the quality of this resource for proper management is pertinent. Consequently, this project aims at assessing the groundwater quality of the study area using Water Quality Index (WQI). Eleven (11) groundwater samples from different locations were collected in 120ml plastic bottles and transported to the laboratory for analyses. Physiochemical and chemical analysis including EC, TDS, temperature, pH, Ca2+, Mg2+, K+, Na+,
Mn2+, Fe2+, NH
4+, PO4-, NO3-, NO2-, Cl-, F-, SO42-, HCO32- were analysed for in the water samples. The result of
the physicochemical analysis reveals that the groundwater in the area is slightly acidic to alkaline. The chemical analysis result showed concentration of major cations and anions in order of Fe2+> Mg2+> Na+> Ca2+> Mn2+> K
and Cl-> HCO
3-> NO3-> NO2-> F-> SO42-> PO42- respectively. The dominant hydrochemical facies in the study
area are; Ca-Mg-Cl-HCO3-, and Na+K-Cl-HCO3- with Na+K-Cl as minor water type. The Water Quality Index
(WQI) for the different samples in the study area range from 191.2171 to 1309.489. The Index reveals that the groundwater in this area has poor water quality and are unsuitable for drinking purposes. Hence, treatment before consumption due to high concentration of chloride, bicarbonates, magnesium, iron and manganese is recommended.
Keywords: Water Quality Index, Eastern Obolo, Coastal Region
INTRODUCTION
In the last few decades, there has been a tremendous increase in the demand for fresh water due to rapid growth of population and the accelerated pace of industrialization. Groundwater is an important source of drinking water for many people around the world, especially in rural areas and coastal regions. (Nas and Berktay, 2010), including the Niger Delta region of Nigeria. This is so because, groundwater, which is the sub-surface water that fully saturates pores and cracks in soils and rocks are more protected compared to the surface waters. Furthermore, the tremendous increase in population and accelerated pace of industrialization due to the oil and gas activities within the Niger Delta region of Nigeria resulted in increased demand for groundwater not only for its widespread occurrence and availability but also for its constituent good quality which makes it ideal for supply as drinking water.
However, the quality has been compromised from both natural and anthropogenic activities. Most of the pollutants resulting from these activities make their way through the soil or rocks which acts as “protective filter or barrier”. Groundwater pollution does not only affect the water quality but also threatens human health, economic development and social prosperity. These resources cannot be optimally used unless its quality assessed. These makes it of prime importance to have prior information on the quality of water resources available. According to WHO organization, about 80% of all the diseases in human beings are caused by water. Once the groundwater is contaminated, its quality cannot be restored by stopping the pollutants from the source. It therefore becomes imperative to regularly monitor the quality of groundwater and to device ways and means to protect it. Groundwater chemistry based on hydrochemical data is useful for providing preliminary information on water types, classification of water for various purposes as well as identification of different aquifer and study of different chemical processes (Karanth, 1987; Saxena et al., 2003; Sarwade et al., 2007).
Water Quality Index (WQI) is one of the most effective tools to communicate information on the quality of groundwater to concerned citizens and policy makers. Water quality index (WQI) provides a single number that expresses the overall water quality at a certain location and time based on several water quality parameters. The objective of WQI is to turn complex water quality data into information that is understandable and usable by the
DESCRIPTION OF THE STUDY AREA
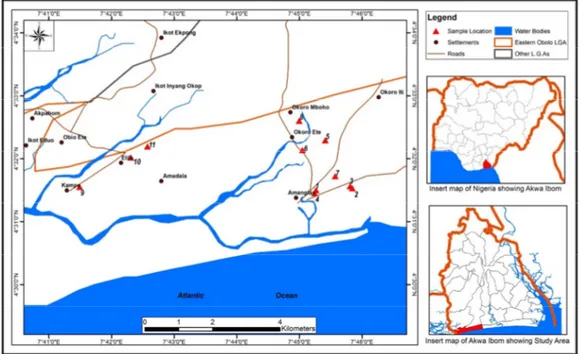
They study area, eastern Obolo is a coastal community in Akwa Ibom state, south-eastern Nigeria. It lies between longitudes 7o35’and 7o50’E and latitudes 4o29’and 4o35’N (Fig. 1) in the Niger Delta region of Southern
Nigeria. It is one of the oil rich regions of the Arcuate Niger Delta, surrounded by both fresh and saline water. The study area is bounded in the North by Mkpat Enin and Onna, in the west by Ikot Abasi, east by Ibeno and in the south by the Atlantic Ocean. It has a total landmass of 117,008 square kilometres with an estimated shoreline of about 184km long.
Fig. 1. Map of the study area showing sample location
MATERIALS AND METHODS
Groundwater samples from eleven drilled boreholes were collected in November and December, 2015 using two sets of polyethylene bottles of 60ml and 120ml capacities, for anions and cations analyzes. Each of the groundwater samples was analyzed for pH, electrical conductivity, TDS, bicarbonate, chloride, sulphate, phosphate, nitrate, nitrite, fluoride, calcium, magnesium, sodium, potassium, iron and manganese using standard procedures recommended by APHA. Samples for cations determinations were acidified with concentrated nitric acid on collections to prevent contamination. All the samples were refrigerated before transported to the laboratory for analyses.
Cations analyses were carried out using Atomic Absorption Spectrometric method and Flame Spectrophotometry while anions determination was by Calorimetric (PO43-, F-, NO2, HCO3- and NO32-),
Volumetric (Cl-) and Turbidimetric (SO
42-) methods with values recorded in mg/l. The pH of the water was
measured insitu whereas other physiochemical parameters like EC, TDS and Temperature were determined in the laboratory using a Ciba-coring conductivity meter, gravimetric method and hand-held mercury-in-glass thermometer with sensor respectively. The water quality index was then evaluated using 17 parameters. The Arimethic weighted WQI method and WHO (2008) standard was used.
RESULTS AND DISCUSSION
Results of the physico-chemical characteristics of water samples from the study area are presented in table 1. The pH of the groundwater in the study area ranges from 6.82 to 7.76 which indicates that the groundwater is slightly acidic to slightly alkaline. This is in total agreement with the results of (Udom, et al 1999; Etu-Efeotor and Akpokodje, 1990; Amadi and Amadi, 1990).
Table 1. Concentration values of major cations and anions with standards permissible limits.
Parameters Min Max Mn. SD WHO
Temp 25.7 26.8 26.2 0.3 Vari. pH 6.82 7.76 7.3 0.3 6.5-9.5 TDS 121.3 272.4 170.6 65.1 500 EC 206.2 284.3 249.9 25.9 1400 Ca2+ 0.72 17.5 4.7 5.4 75 Mg2+ 1.58 62.8 9.1 17.9 50 K+ 0.126 0.8 0.6 0.2 10 Na+ 2.65 7.3 4.7 1.6 50 Mn2+ 0.18 3.7 0.8 0.9 0.3 Fe2+ 6.53 44.5 11.2 11.1 0.3 NH4+ 0.06 0.7 0.3 0.2 1 HCO32- 61 1525 126.9 39.2 100 NO3- 0.3 3.59 1.8 1.1 50 NO2- 0.08 0.39 0.2 0.1 5 Cl- 57.6 245 302.7 711.9 250 F- 0.1 0.29 0.16 0.06 1.5 SO42- 0.03 0.46 0.16 0.13 250 PO4- 0 0.14 0.05 0.05 10
All units except pH, Temperature (oC) and Elcetrical conductivity (µm/cm) are in mg/l, SD = Standard Deviation, Min. = Minimum, Max. = Maximum, Mn = Mean
These values are however, within the permissible limits of 6.5 – 9.5 set by WHO (2008). Acidity in groundwater in the Niger Delta has been attributed partly to gas flaring (Nwankwola and Udom, 2011). Gas flaring releases carbon-dioxide which reacts with atmospheric precipitation to form carbonic acid, which infiltrates into the groundwater system to reduce the pH of the water, and increase acidity. Acidic waters are favorable for iron bacteria to thrive, which will severely corrode metal casing used for reticulation and incrustation of pipes (Olarewaju et al., 1996).
Total Dissolved Solids (TDS) values are in the range of 121.3mg/l to 272.4mg/l (av. 170.57mg/l), these values falls within the permissible limits of WHO (2008) set-out standard. Classification of water based on TDS shows that the groundwater falls within the fresh water type. Electrical Conductivity (EC) values measured from samples in the study area range from 206.2uS/cm to 284.3uS/cm (av. 249.99uS/cm). The EC values from the area are within the permissible limit set by WHO (2008).
The statistical summary of the chemical analyses on the groundwater samples is as presented in Table 4.1. The concentration of major cations; Ca2+, Mg2+, Na+, K+, Fe2+, Mn2+, NH
4+ ranges from 0.72 to 17.5mg/l (av.
4.66mg/l), 1.58 to 62.80mg/l ( av. 9.11mg/l), 2.65mg/l to 7.30mg/l (av. 4.67mg/l), 0.126 to 0.81mg/l (av. 0.605mg/l), 6.53 to 44.50mg/l (av. 11.26 mg/l), 0.18 to 3.71mg/l (av. 0.79mg/l), 0.06 to 0.72mg/l (av. 0.37mg/l) respectively. The concentration values of all cations fall below the WHO (2008) standard for drinking water except the concentration values of Fe2+, Mg2+, and Mn2+ at most locations.
The high iron concentration throughout the study area may be as a result of natural process (geologic) (Etu-Efeotor, 1981). Most of the waters are clear on abstraction from the well but soon become cloudy and then brown from precipitating ferric hydroxide. Amadi et al. (1987) suggested that important factors that influence iron solubility and consequently its concentration in groundwater include the local geologic structure, hydrological conditions of the basin, and complex physiochemical and biochemical factors such as pH and redox potential (Eh), the dissolved carbon dioxide and sulphur species, organic substances with high capacity to form complexes including humic substances, and the content and composition of microflora whereas Magnesium shows high concentration above standard at Location 9(EO9). According to Todd (1980), a higher concentration of magnesium in household water has a laxative effect, especially on new users of the supply (people unaccustomed to it). This contributes to water hardness.
More than 90% of the total water samples have manganese concentration exceeding the WHO (2008) limit of 0.3mg/l. This high level of manganese in groundwater in study area may be from natural leaching processes which varies widely depending upon the types of minerals present at the aquifer. Manganese often occurs
0.158), 57.6mg/l to 2448.0mg/l(av. 302.7mg/l), 61.0mg/l to 146.46mg/l (av. 126.9964mg/l), 0.000 to 0.140mg/l(av. 0.05mg/l), 0.30 to 3.59mg/l(av. 1.85mg/l), 0.080 to 0.389mg/l(av. 0.226mg/l), 0.10 to 0.29mg/l(av. 0.16mg/l) respectively. Sulphate concentration in the area is below WHO standard for drinking water and therefore poses no problem for the groundwater quality. The low values are most probably due to the removal of SO42- by the action of bacteria (Amadi et al., 1989). The low concentrations of sulphate suggest absence of any
abuse of the water by septic tanks in the area. The concentration of chloride and bicarbonates above WHO (2008) permissible limit for drinking water at most location reveals the deterioration in water quality in these areas. Chloride in excess of 250mg/l impacts a salty taste on drinking water and can cause physiological damage.
Groundwater Facies Classification
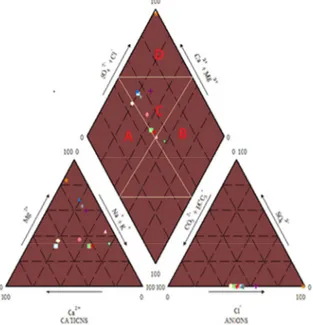
The hydrochemical evolution of groundwater can be understood by plotting the major cations and anions in a piper trilinear diagram (Piper, 1944). This diagram reveals similarities and difference among groundwater samples because those with similar qualities will tend to plot together as groups. The piper trilinear diagram below (Fig.2) is a plot of the major cations and anions of groundwater samples from the study area.
Fig. 2. Piper plot of major cations and anions
Considering the cations trilinear, 45.5% of the samples plot on the No dominant triangle whereas 36.4% plots on Magnesium type and 18.1% plots on the sodium and potassium type. Considering the anion trilinear, 45.5% plots on the Chloride type, 18.1% plots on the bicarbonate type and 36.4% plots on the no dominant area. Generally, the Piper plot reveals Ca-Mg-Cl-HCO3- and Na+K-Cl-HCO3- as major water facies with Na+K-Cl as
minor water facies within the study area. The result of groundwater facies in the study area is in-accordance with that given by Manjusree et al 2009 as it shows alkali earth metals(Ca2+ + Mg2+) dominance over the alkalies (Na+
+ K+) and dominance of weak acids (HCO
3- + CO3-) over strong acids (SO42-).
Water Quality Index
The Groundwater quality for drinking purposes was calculated using Weighted Arithmetic Water Quality Index method. The steps and equations given as follows were used. In the first step, each of the 17 parameters (EC, pH, TDS, Cl, SO4, NO3 , Ca, Mg, Na, K, NO2,Mn, Fe, NH4, F, PO42-, HCO3-) were assigned weight (wi) based on
their perceived effects on primary health. The maximum weight of 5 was assigned to a parameter; nitrate due to its major importance in water quality assessment. Other parameters like calcium, magnesium, nitrite, sodium and potassium etc. were assigned a weight between 1 and 5 depending on their importance in the overall quality of water for drinking purposes.
In the second step, the relative weight (WI) of each parameter is computed using equation 1;
Wi = ∑ . . . eqn. 1
where, wi is the weight assigned to each parameter, n is the number of parameters and Wi is the relative weight.
In the third step, quality rating scale (qi) is calculated for each parameter using Eq. (2):
qi = × 100 . . . . eqn. 2
where qi is the quality rating, Ci is the concentration of each chemical parameter in each water sample in mg/l, Si
The fourth step involves the determination of sub-index (SIi) of each parameter for a place. It is thus calculated
as;
SIi = qi × wi . . . eqn. 3
Where SIi = is the sub index of each parameter
qi = is the quality rating scale of each parameter
Finally, the water Quality Index (WQI) of each station is computed as thus; WQI =∑ . . . . . . eqn. 4
Where n – is the number of parameters being assessed by Water Quality Index (WQI). Table 3. WQI Value for different locations in the study area.
Sample ID WQI values Remark
EO1 297.9 Very poor water quality
EO2 310.7 Unsuitable for drinking
EO3 230.3 Very poor water quality
EO4 212.2 Very poor water quality
EO5 202.7 Very poor water quality
EO6 227.2 Very poor water quality
EO7 198.9 Poor water quality
EO8 191.2 Poor water quality
EO9 1309.5 Unsuitable for drinking
EO10 263.5 Very poor water quality
EO11 211.7 Very poor water quality
Table 4. Water quality classification based on WQI
WQI Water Quality Status Water Samples (%)
< 50 Excellent water quality 0
50 – 100 Good water quality 0
100 – 200 Poor water quality 18.18
200 – 300 Very poor water quality 63.63
>300 Unsuitable for drinking 18.18
The results of the WQI reveals that 6 water samples reveals poor to very poor water quality in Location 1, 3, 4, 5, 6, 7, 8, 10 and 11. This can be attributed to the high concentration of iron and manganese above permissible limits for drinking water at these locations. Furthermore, location 2 and 9 water quality reveals unsuitable for drinking. This is due to very high concentration of chloride, iron, magnesium and manganese at this location. Hence, treatment is highly recommended before consumption.
CONCLUSION
The pH of groundwater in the study area ranges from slightly acidic to alkaline. Acidic groundwater are aggressive, hence boreholes in the area should be constructed with PVC pipes and other non-corrosive materials. This is imperative because if pH and iron are treated for at location where they exceed their limits, the water will be potable and suitable for drinking and other domestic purposes. For cations and anions analyzed, they have concentration dominance in the order of Fe2+> Mg2+> Na+> Ca2+> Mn2+> K+ and Cl-> HCO
3-> NO3-> NO2-> F->
SO42-> PO42- respectively. However, the high concentration of iron requires treatment at some locations.
Aeration and filtration is enough to get rid of the iron. Chloride is the dominant anion followed by bicarbonates, this suggest saltwater contamination and hardness of water at most locations.
The result from the piper tri-linear diagram shows dominant Ca-Mg-Cl-HCO3-, Na+K-Cl-HCO3- and
Na+K-Cl. Water Quality Index (WQI) result shows poor water quality for all locations but these waters at these locations can be good for drinking if treated. Hence, the application of water quality index technique for the assessment of the water quality for drinking purpose is a useful tool.
REFERENCES
Amadi, P.A, Ofoegbu, C.O., and Morrison, T., Hydrogeochemical assessment of groundwater quality in parts of the Niger Delta, Nigeria. Environmental Geology and Water Science.14, 1987; pp. 195-202.
Etu-Efeotor, J.O and Akpokodje, E.G., Aquifer systems of the Niger Delta. Journal Mining Geology, Vol.26(2), 1990; pp. 279-284.
Karanath, K. R. Quality of ground water. In: K. R. Karnath (Edn.). Ground water assessment development and management. New Delhi, Tata McGraw Hill. 1987; pp. 217-275
Manjusree, T. M., Sabu J. and Jobin T., Hydrogeochemistry and Groundwater Quality in the Coastal Sandy Clay Aquifers of Alappuzha District, Kerala. Journal of Geological Society of India, Vol.74, 2009; pp.459-468. Mbonu P. D. C, and Ebeniro J.O., Geo-electric sounding for the determination of Aquifer Characteristics in parts
of Umuahia Area of Nigeria. International Journal of Geophysics, 56, 1991; pp. 284-291.
Nas, B., & Berktay, A., Groundwater quality mapping in urban groundwater using GIS. Environmental Monitoring and Assessment, 160, 2010; pp. 215-227.
Nwankwoala, H.O and Udom, G. J., Hydrochemical Facies and Ionic Ratios of Groundwater in Port Harcourt, Southern Nigeria. Research Journal of Chemical Sciences, Vol.1(3), 2011; pp. 87-101.
Olarewaju, V. O., Olorunfemi, M. O. and Alade, O., Chemical characteristics of Groundwater from some parts of the Basement Complex of central Nigeria. Journal Mining Geology, Vol. 33(2), 1996; pp. 135-139. Piper, A.M., A graphical procedure in the geochemical interpretation of water analyses.American Geophysical
Union Transactions, 25, 1944; pp. 914-923.
Sarwade, D. V., Nandakumar, M. V., Kesari, M. P., Mondal, N. C., Singh, V. S., and Singh, B. Evolution of seawater ingress into an Indian Atoll. Environmental Geology, Vol. 52(2), 2007; pp. 1475-1483.
Sasidhar P., V., and Kumar, S. B. Assessment of groundwater corrosiveness for unconfined aquifer system at Kalpakkam. Environmental Monitoring and Assessment, Vol. 145(1-3), 2008; pp. 445-452.
Saxena, V. K. Singh, V. S., Mondal, N. C., and Jain, S. C. Use of chemical parameters to delineation fresh ground water resources in Potharlanka Island, India. Environmental Geology, Vol. 44(5), 2003; pp. 516-521. Todd, D. K. Groundwater Hydrology, Wiley, New York, 2nd edition. 1980; pp. 315.
Udom, G. J., Etu-Efeotor,J.O. and Esu, E. O. Hydrochemical Evaluation of Groundwater in parts of Port Harcourt and Tai Eleme Local Government areas, Rivers state. Global Journal of Pure and Applied Sciences, Vol. 5(5), 1999; pp. 545-551