Journal of Economics Library
www.kspjournals.org
Volume 4 September 2017 Issue 3
Inflation and economic growth
By
Sergey BLINOV
1†Abstract. Attempts to establish a link between inflation and economic growth are made quite regularly. The aim of such attempts is not only to determine the impact of inflation on economic growth but also to assess efficiency of the inflation rein-in policy, for example, the policy of inflation targeting. This work reveals the nature of the inter-connection between inflation and economic growth and explains why this inter-connection cannot be sustainable without considering the third parameter, i.e. money supply.
Keywords. Monetary policy, Price level, Inflation, Deflation, Economic growth, Business cycles.
JEL. E30, E32, E51, E52, E58, N10, O11, O40, O42.
1. Introduction
ttempts to establish a link between key economic indicators are made quite regularly. An attempt of such kind, for example, is the so-called Okun’s law, which describes the empirical inter-connection between the unemployment trend development and the GDP growth. Another example is the inter-connection between economic crises and shrinkages in money supply established by Milton Friedman.
Inflation is one of the most important macroeconomic parameters and attempts to find its inter-connection with other macroeconomic indicators are also undertaken regularly. One of the universally known examples is the so-called Phillips’ curve or an attempt to establish an inter-connection between inflation and unemployment.
The aim of this article is to show what inter-connection exists between inflation and economic growth. It shows that this dependence is expressed in the following formula: Y=f (M/P), where Y is GDP, М is the nominal money supply, P is the price level (M/P is the real money supply, RMS). And this means that the inter-connection between inflation and economic growth cannot be sustainable without considering the third parameter, i.e. the nominal money supply.
2. Inflation and Economic Growth. Quest of Their
Inter-Dependence with Mixed Success
Attempts to establish the inter-connection between inflation and economic growth have been multiple. Many Nobel laureates have worked over this subject, for example, Robert Lucas (Lucas, 1988), Robert Solow (Orphanides & Solow, 1990), James Tobin (1965). However, no sustainable inter-connections were ever established. One of the examples is Robert Barro’s well known article which is accordingly entitled “Inflation and Economic Growth” (Barro, 1995), based on the statistics of many countries for the period between 1960-1990. It is established that rising inflation depresses GDP growth and growth of investments. However,
“statistically significant results emerge only when high-inflation experiences are included in the sample”. The articles by many other authors are considered below in table 1 (Kartaev, 2017).
1
† Department of Strategy Planning, PTC Kamaz, Naberezhnye Chelny, Tatarstan, Russia. . +7 960 070 0081
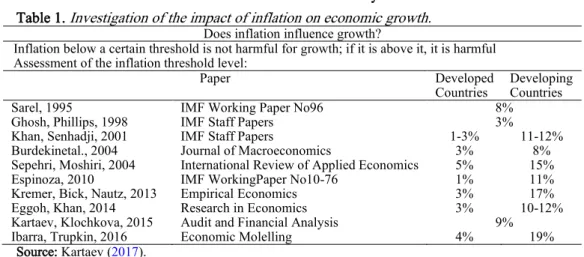
Table 1. Investigation of the impact of inflation on economic growth.
Does inflation influence growth?
Inflation below a certain threshold is not harmful for growth; if it is above it, it is harmful Assessment of the inflation threshold level:
Paper Developed
Countries Developing Countries Sarel, 1995 IMF Working Paper No96 8%
Ghosh, Phillips, 1998 IMF Staff Papers 3% Khan, Senhadji, 2001 IMF Staff Papers 1-3% 11-12% Burdekinetal., 2004 Journal of Macroeconomics 3% 8% Sepehri, Moshiri, 2004 International Review of Applied Economics 5% 15% Espinoza, 2010 IMF WorkingPaper No10-76 1% 11% Kremer, Bick, Nautz, 2013 Empirical Economics 3% 17% Eggoh, Khan, 2014 Research in Economics 3% 10-12% Kartaev, Klochkova, 2015 Audit and Financial Analysis 9% Ibarra, Trupkin, 2016 Economic Molelling 4% 19%
Source: Kartaev (2017).
Indirectly impact of the inflation on the economic growth is examined also in other articles in which the impact on the economic growth by the policy of inflation targeting is assessed.
Table 2. Influence of inflation targeting (IT) on inflation and on economic growth
Does IT reduce inflation?
Method Developed Countries Developing Countries Sheridan, Ball, 2005
The Inflation Targeting Debate. Universety of Chicago Press for the NBER Difference in differences Does not reduce/ hardly reduces it Goncalves, Salles, 2008 Journal of Development Economics Reduces it
Willard, 2006 Princeton University CEPS WP No120
2SLS
Does not reduce Lin, Ye, 2007 Journal of Monetary
Economics
Matching
Does not reduce Lin, Ye, 2009 Journal of Development
Economics Reduces it Zubarev, Trunin, 2015 GMM Reduces it Kartaev, 2016 reduce/hardly reduces it Reduces it
Influence of IT on growth: what do the data say?
Mollick et al., 2011
Method Countries Conclusion Method
Kurihara, 2013
GMM, FE, RE Developed and
Developing Positive Influence GMM, FE, RE Ayres et al., 2014 GMM Developed and Developing Positive Influence GMM Zubarev, Trunin, 2015 GMM Developed and Developing Positive Influence GMM Hale, Philippov , 2015 GMM Developing No Influence GMM Kartaev, Philippov, Khazanov, 2016
Matching Developed and
Developing Positive Influence Matching Guimaraes e Souza et al., 2016 GMM Developed and Developing Positive Influence in Developed Countries GMM FE Developed and Developing Positive Influence FE
It is noteworthy that the results of the studies set out above do not give an unequivocal answer on the linkage between inflation and economic growth. Therefore, researchers are seeking to find dependencies of more specific nature rather than of any general nature. For example, establish influence of inflation separately in the developing countries. Or establish inter-connection of inflation with economic growth for countries in which as at the beginning of the period under review inflation was high. Or establish certain threshold levels of inflation above which influence of inflation on economic growth is high, and below which it weakens.
Such ambiguity of the results allows an assumption to be made that inflation does not exercise influence on the economic growth directly, instead it exerts influence through other economic parameters. And such an approach yields unexpectedly good results.
3. Economic Growth and Real Money Supply (RMS)
The author’s paper entitled “Real Money and Economic Growth” (Blinov, 2015c) shows that there exists a very close correlation between the GDP and such an indicator as real money supply (hereinafter referred to as the RMS). Real money supply hereinafter implies money aggregate М2, adjusted for the level of inflation.
The paper gives examples of such inter-connection for Russia (fig. 1), Brazil (fig. 2), European Union (fig. 3), as well as Japan.
Figure 1. In Russia the inter-connection between the GDP and real money supply (RMS) is very tight2
Source: Blinov (2015c).
2
Figure 2. In Brazil, the GDP is also connected closely with the RMS.
Source: Blinov (2015c).
Figure 3. In the Euro zone countries, the RMS and the GDP also have a close interconnection
Source: Blinov (2015c).
Such a close-knit bond between the GDP and the real money supply is not only characteristic of the above examples, but also of the majority of other countries in the world but for rare exception.
There comes up a justifiable question: and what does it have to do with the inter- connection between inflation and economic growth? The point is that the level of inflation is used as an input parameter in calculating real money supply (RMS). That means that we are pretty close to establishing the nature of the inter-connection between the GDP (economic growth indicator) and inflation.
4. Economic Growth and Inflation. Nature of Dependence
From the established inter-connection between the RMS and the GDP it follows that economic growth does not depend on inflation directly, it depends on the ratio between the growth rate of money supply and price increases. The GDP can be presented as the function of real money supply (RMS).
GDP = f(RMS), (1)
Real money supply at the prices of the baseline period, in its turn, is calculated as the nominal money supply adjusted for the change in the level of prices.
RMSt=М2t/(Pt/P0), (2)
where RMSt is real money supply during the t time period, at the prices of the baseline period, Pt is the level of consumer prices during the t time period,
P0 is the level of consumer prices of the baseline period.
Formula (1) with consideration given to (2) comes to look as below:
GDPt= f(М2t/(Pt/P0)) (3)
Thus, the nature of the inter-connection between the GDP (as an indicator of economic growth) and change in prices (inflation), has been established which is given in the formula as the price increase index (Pt/P0).
I propose the following wording of the law governing the inter-connection between economic growth and inflation: “The Law of the Inter-Connection Between Economic Growth and Inflation: Economic growth is directly dependent on the nominal money supply and is inversely dependent on consumer price increase”
The work “Real Money and Economic Growth” uses a simple and convenient form of recording this law:
Y=f (M/P), (4)
where, Y is GDP,
М is nominal money supply, P is the price level, M/P is real money supply.
Let us consider this inter-connection using a numerical example.
If during the year the nominal money supply has grown by 10% (index 1.1), whereas the prices have increased by 8% (index 1.08), in that case the index of real money supply growth equals 1.1/1.08=1.019. This means that the RMS has grown by 1.9%. RMS growth, pursuant to formula (1), corresponds to the GDP growth.
The article “Real Money and Economic Growth” (Blinov, 2015 c), shows that for Russia and for quite a number of other countries many years’ dependence of the GDP on the RMS has non-linear form. The GDP is linearly connected with the logarithm of RMS, which means that exponential growth of RMS corresponds to linear growth of the GDP.
From formula (3) and the numerical example, it is easy to see that the real money supply RMS (and GDP together with it) grows, if the growth rate of the nominal money supply is greater than the rate of price increase. Otherwise, the RMS declines (contracts, shrinks).
Corollary 1
:
Condition of the GDP Growth: For real money supply to grow (and for GDP to grow in line with that), the growth rate of the nominal money supply must be greater than the rate of price increase.This corollary stemming from the law worded above enables the occurring economic processes to be adequately visualized.
5. Visual Representation
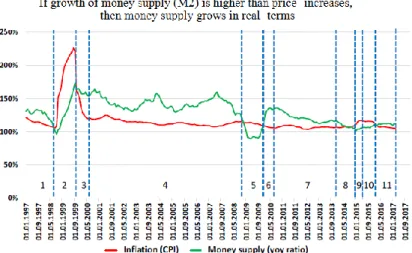
In order to see quite clearly whether the condition for the GDP growth worded above is fulfilled, it is enough, on the time scale, to reflect two graphs: that of price increase and nominal money supply growth. Such a graph for Russia is given below, in figure 4.
Figure 4. Ratio between the price increase rate and the nominal money supply rate determines the trends of real money supply and, together with it, determines the GDP
trends. Data for Russia Jan.1997-Feb.2017
Source: Central Bank, Rosstat, calculations made by S.Blinov
How are we to read this diagram:
1. If the green line is higher than the red line, that means real money supply is growing and the economy is showing GDP growth. In this case:
a. The greater the gap (distance) between the lines is, the higher the GDP growth is.
b. If the gap between the lines is increasing, the GDP growth is speeding up. c. If the gap between the lines is narrowing, the GDP growth is slowing down. 2. If the red line is higher than the green one, real money supply is contracting and the economy is exhibiting GDP decline. In this case:
a. The greater the gap between the lines is, the more intensive the GDP decline is.
b. If the gap between the lines is increasing, the GDP decline is speeding up. c. If the gap between the lines is narrowing, the GDP decline is slowing down. If we use these simple rules for reading the diagram, all the three crises which occurred in Russia during this period (1998, 2008-2009, 2014-2015) become vividly visible. In the diagram, the green line was below the red one in each of these three periods.
Since the mutual position depends on the direction of movement for both lines, the trend development of real money supply and the GDP can change for different reasons (figure 5).
Figure 5. How movements of money supply and prices impact growth
Explanation of figure 5.
Decline (of the GDP and RMS) takes place in the following situations:
1. Sharp growth of inflation with stable or even speeding up growth of the nominal money supply (periods 2, 9). (The red line overtakes the green one in its movement upwards)
2. Sharp reduction in the growth rates of money supply with stable or even slightly decreasing inflation (period 5, 8). (The green line “on its own” is dropping down below the red line).
RMS (and GDP) growth begins for the following reasons:
1. Inflation sharply diminishes with relatively stable growth rates of М2 (periods 3, 11). (The red line “dives” under the green one)
2. Money supply sharply speeds up with relatively stable level of inflation (period 6). (The green line “emerges” from under the red line).
It should be pointed out separately that inflation has a provisional bottom boundary. The point is that price reduction (deflation) or even zero price increase are undesirable for the economy for a number of reasons, which are not under review in this article. While from this the following corollary can be drawn:
Corollary 2: With inflation being low, its further reduction is problematic, therefore the speeding-up of money supply growth rates (increasing gap between the lines in the diagram) and the corresponding speeding-up of the GDP rates can only take place by stepping up the growth rates of money supply М2.
This corollary is relevant to the current status of the economy in Russia (period 11 in figure 5). The potential for expanding the gap by dropping down the red line (by lowering inflation) is virtually exhausted. To expedite economic growth, one needs upwards movement of the green line. Thus it is ensured that growth of real money supply and the GDP rates are expedited. And the current situation is favorable for such actions as risks of inflation or the Ruble exchange rate weakening are low.
6. Certain Paradoxical Conclusions
From the inferences and observations made above, several paradoxical findings can be drawn.
6.1. Economic Growth Happens Even When Inflation Is High
Economic growth is possible when inflation is high, provided one condition is fulfilled: growth rates of the nominal money supply must be higher than inflation (as, for example, period 3 in figure 5).
There are examples from the economic history of other countries, which corroborate this finding:
Brazil: In the late 1980-s – early 1990-s, in certain years, the prices shot up 20-30 times. Between 1985 and 1994, the most “moderate” from the point of view of inflation was 1986, when prices increased “only” 2.5 times (by 147%)
However, a noticeable decline of the GDP in Brazil, during 1985-1994, was observed only once: in 1990, but even during that year, it was comparatively marginal, only -3.1%. Besides, with inflation being so rampant, in certain years, GDP growth exceeded 8% (1985, 1986).
It is all accounted for by the fact that no reduction in real money supply was allowed to happen and nominal money supply, in terms of rates, was ahead of inflation, which is evidenced by the graph in appendix 1.
Vietnam: “Against the background of galloping inflation (in 1988, it amounted to more than 400%), in 1989, during the time when “shock therapy” was pursued, an exceptionally soft monetary policy was being implemented (hereinafter the World Bank data). Money supply М2, during this year, grew by 213% in real terms (in nominal terms, more than 5 times). And instead of decline which was customary for “shock therapy”, Vietnam was experiencing growth of the GDP by 7.4%”. Quoted from the article “Good Example for the Central Bank” (Blinov,
2015).
Russia, dating back to the times of Evgeny Primakov's tenure as prime minister Inflation dramatically escalated after “default” and after the devaluation in 1998 (see the graph in Figure 5, period 2). But money supply rushed headlong “in the wake” until its rates exceeded those of inflation. As a result, in 1999, GDP growth made up 6.4% (an unheard-of rate since the late 1980-s). And following that the GDP growth of the year 2000 ensued, i.e. 10% (higher than in China).
6.2. Economic Decline Or Stagnation Happens Even When Inflation Is
Not High
This will happen if the nominal money supply in this case contracts (for example, period 5 in figure 5).
Examples from the economic history of other countries:
Japan (lost decades of the 1990-s and 2000-s). During this period, Japan was experiencing drastically reduced economic growth. This was going on against the background of low inflation and even deflation. The reason for that was the fact that the growth rates of money supply had drastically decreased compared to the period of the 1970-s and 1980-s (for more details, refer to the article “How to Avoid the “Japanese Trap”, Blinov, 2016).
USA: The Great Depression (1929-1933). Against the backdrop of deflation, there occurred a decline in output by one third, unemployment jumped from 2 to 25%. The cause of that is not deflation (it increases real money supply), the cause of that is contraction of nominal money supply (at a certain moment reaching -38%), which was referred to by М. Friedman (Abel & Bernanke, 2011).
6.3. Deflation Is No Problem for Economic Growth
If, in the case of deflation, nominal money supply expands, real money supply will grow at even higher rates, which means it will produce economic growth. In other words, for economic growth it is not deflation that is the problem, the problem is the slowdown (contraction) of money supply, which often occurs in the case of deflation. In the Russian history of the last 26 years, such situations have not transpired, deflation has not been observed a single time.
Examples from the economic history of other countries are few and far between, because deflation, as a rule, is reflective of “money famine”, that is contraction of money supply. Here they are:
Bahrein. For 5 years (1998-2002) Bahrein was witnessing deflation. Notwithstanding that money supply was growing at an average rate of 10% a year. As a result, the GDP, during these years, grew at a steady rate between 2.5% and 5.3% (on the average by 4.1% a year)
Hong Kong. For 6 years (1999-2004), every year, deflation was observed, average prices fell down by 2.5% a year. Besides, economic growth of the GDP (continuous!) was observed from 0.5% to 8.7% (4% on the average).
Saudi Arabia, during 1998-2001, (4 years), when against the background of continuous deflation, the economy grew for 3 out of four years, sometimes reaching a growth rate of 4.9% (2000)
Japan (2000-2005). For 5 years out of 6, deflation was observed, however despite that, the GDP steadily grew at an average rate of 1.4% a year.
6.4. Geometric Metaphor
If we are to use a metaphor from geometry, it becomes clear why the attempts to find the inter-connection between inflation and economic growth did not yield any sustainable result. Since such attempts are akin to trying to find dependence between the length of one of the sides of a rectangle and its area. Without taking into account the length of the other side, such attempts cannot produce a sustainable result.
Figure 6. Area of the rectangle equals the product of its sides.
Source: A Course of Mathematics for Elementary School.
Side a can be compared with the value inverse to inflation (growth of inflation reduces the length of side a). Side b can be likened to nominal money supply rate. Then the area of rectangle S (product of sides a and b) will show the current status of real money supply growth (which also means GDP growth).
With side b being invariable, an increase in side a results in an increase in the area of the rectangle, while reduction in side a leads to a reduction in its area. But all this is true, let me remind you, provided side b does not change.
If side b is not an invariable value, then there can be such cases where with the increase in side a, the area of the rectangle can decrease because such a reduction in side b was considerably greater than the increase in side a.
Same applies to inflation as well, which, pursuant to our conclusions, in the case of sustainable growth rates of money supply (b = const.) will be demonstrating a strong inter-connection with real money supply, hence with the GDP, too. However, in the case of significant changes in money supply (b ≠ const.), the picture may change for the reverse.
Very much in the same way, attempts to stimulate GDP growth by ramping up nominal money supply can produce different results. RMS can grow only if inflation is under control and relatively stable. However, RMS may not increase and even decrease, if inflation takes off and completely levels off the nominal growth of money supply. In this case, the economy will sustain stagflation.
Hence, this is exactly why the problem is not resolved by the idea “let us print out as much money as necessary”; the focus must be on real money supply rather than nominal one.
7. Conclusion
Economic growth is directly dependent on the nominal money supply and inversely dependent on consumer price increases.
Search for dependence between inflation and economic growth did not yield confident and reliable results because inflation impacts on one variable only (P – price level) in equation (4).
Y=f (M/P)
In accordance with this formula, more reliable results can be obtained when researching dependence between economic growth and inflation with controlled variable М (nominal money supply).
A promising path of research is represented by a study of the Phillips curve giving consideration to the inter-connections set out in this article.
One of the hypotheses to be checked can consist in the following:
Inflation and unemployment exhibited inverse dependence (with unemployment going down when inflation rises) not because of inflation, but because at the time the growth rate of nominal money supply was higher than inflation rates, that is real money supply growth was underway.
The inter-connection discovered by Phillips ceased to manifest itself because real money supply at high levels of inflation stopped growing and, on the contrary, started to contract. This article furthers the ideas set out in the article “Real Money and Economic Growth” (Blinov, 2015).
Appendix
1. Inter-Connection between the GDP and real money supply (RMS) for certain countries in the world (60 countries).
References
Abel, A.B., & Bernanke, B.S. (2011). Macroeconomics. 5-th ed. – StP.: Piter, 2011 (Russian translation). English Edition: Addison Wesley.
Barro, R.J. (1995). Inflation and economic growth, NBER Working Paper, No. 5326. doi.
10.3386/w5326
Bernanke, B. (2004) Money, Gold and the Great Depression. [Retrieved from]. Blinov, S. (2015). A good example for the central bank, 15.07.2015. [Retrieved from]. Blinov, S. (2015b). How to double Russia' GDP. MPRA Paper, No.66625. [Retrieved from]., Blinov, S. (2015c). Real money and economic growth. MPRA Paper, No.67461, [Retrieved from]. Blinov, S. (2016). How to avoid the Japanese trap, 10.08.2016. [Retrieved from].
Blinov, S. (2017). Inflation and economic growth, MPRA Paper No. 78087. 02.04.2017. [Retrieved from].
Bruno, M., & Easterly, W.R. (1996). Inflation and growth: In search of a stable relationship, Federal Reserve Bank of St. Louis, Review, 78(3), 139-146.
Cozier, B., & Selody, J. (1992). Inflation and macroeconomic performance: Some cross-country evidence, Bank of Canada Working Paper No. 92-06, Bank of Canada.
Fischer, S., (1983). Inflation and growth, NBER Working Paper No.1235. doi. 10.3386/w1235
Kartaev, P. (2017). Influence of inflation targeting on the GDP trend development in the long term perspective: Cross-country study”. Report at the Scientific Seminar of the Center for Macroeconomic Analysis and Short Term Forecasting, March. [Retrieved from].
Kartaev, P. (2017). Is inflation targeting useful for economic growth? Voprosy Ekonomiki, 2(1), 1-13. Kormendi, R.C., & Meguire, P.G. (1985). Macroeconomic determinants of growth: Cross-country
evidence, Journal of Monetary Economics, 16(2), 141–163. doi. 10.1016/0304-3932(85)90027-3
Lucas, R.E., (1988). On the mechanics of economic development, Journal of Monetary Economics, 22 (1), 3–42. doi. 10.1016/0304-3932(88)90168-7
McCandless, G.T., & Weber, W.E. (1995). Some monetary facts, Federal Reserve Bank of Minneapolis Quarterly Review, 19(3), 2–11.
Orphanides, A., & Solow, R. (1990). Money, inflation and growth, in B.M. Friedman & F.H. Hahn, (Eds), Handbook of Monetary Economics, Amsterdam: North-Holland, 1990.
Stockman, A.C. (1981). Anticipated inflation and the capital stock in a cash-in-advance economy,
Journal of Monetary Economics, 8(3), 387-393. doi. 10.1016/0304-3932(81)90018-0
Tobin, J. (1965). Money and economic growth, Econometrica, 33(4), 671–684. doi. 10.2307/1910352
Copyrights
Copyright for this article is retained by the author(s), with first publication rights granted to the journal. This is an open-access article distributed under the terms and conditions of the Creative Commons Attribution license (http://creativecommons.org/licenses/by-nc/4.0).