INSTITUTE
of
TRANSPORT
and
LOGISTICS
STUDIES
The
Australian
Key
Centre
in
Transport
and
Logistics
Management
ITLS
‐
WP
‐
15
‐
12
Using
complex
network
theory
to
model
supply
chain
network
resilience:
a
review
of
current
literature
By
Supun Perera and Michael G H Bell
June 2015
ISSN 1832‐570X
network resilience: a review of current literature
ABSTRACT: Traditionally, supply networks are modelled as multi-agent systems, in order to represent explicit communications between various entities involved. However, due to the increasingly complex and interconnected nature of the global supply networks, a recent trend of research work has focussed on modelling supply networks as complex adaptive systems. This approach has enabled researchers to investigate various topological properties which give rise to resilience characteristics in a given supply network. This paper presents a critical review of the published research work on this field. Key insights provided by this paper include; (1) the importance of defining the concepts of ‘resilience’ and ‘disruptions’ as measurable variables; (2) the limitations of existing network models to realistically represent supply networks; (3) potential improvements to the currently used growth mechanisms, which rely on node ‘degree’ to derive attachment probability instead of the more realistic and relevant node ‘fitness’; (4) importance of incorporating operational aspects, such as flows, costs, and capacities of connections between the nodes as well as topological aspects; and (5) derivation of a new set of resilience metrics capturing operational as well as topological aspects. Finally, a conceptual approach incorporating the above improvements to the existing supply network modelling approach is presented.
KEY WORDS: Supply chain resilience, supply chain modelling, complex network
theory
AUTHORS: Perera and Bell
Acknowledgements: The authors would like to thank Prof. Michiel Bliemer, Dr. Tanya Latty and Dr. Eliza Middleton for their valuable comments on the content of this paper. Also, we acknowledge the Australian Research Council (ARC) for funding this work under grant DP140103643.
CONTACT: INSTITUTE OF TRANSPORT AND LOGISTICS STUDIES (C13)
The Australian Key Centre in Transport and Logistics Management
The University of Sydney NSW 2006 Australia Telephone: +612 9114 1824
E-mail: [email protected] Internet: http://sydney.edu.au/business/itls
1. Introduction
In today’s highly interconnected world, global supply chain networks (SCNs) play a vital role in fuelling international trade and economic growth. Due to the interconnectedness of global businesses, which are no longer isolated by industry or geography, any disruptions to supply chains, such as natural disasters, acts of war and terrorism, and even labour disputes are becoming increasingly complex in nature and global in consequences (Manuj and Mentzer, 2008). These disruptions can ripple through global supply chains, magnifying the original damage. Even relatively minor disturbances, such as labour disputes, ground congestion or air traffic delays can result in disproportionately severe disruptions to local and international trade. Therefore, this ‘fragility of interdependence’ creates unprecedented risks to global and local economies (Vespignani, 2010).
At the local level, disturbances to supply chains can have major social and economic ramifications. For instance, during the 2011 Queensland floods in Australia, the key transportation routes were shut down, preventing supermarkets from restocking and leading to critical food shortages (Bartos, 2012). However, at the global level, these consequences are typically magnified, resulting in more and longer lasting damage. A recent example of a global supply chain disruption is the 2011 offshore earthquake, which subsequently manifested itself as a tsunami, which hit the northeast coast of Japan. Alongside the appalling humanitarian impact, this tsunami caused destruction of critical infrastructure, which propagated through global supply chains and transportation networks, with significant global economic consequences (Canis, 2011). Another example of such a high impact-low probability disruption to supply chains is the September 11 terrorist attacks on the United States, which resulted in disruptions to the movement of automotive parts due to the shutdown of air and truck transportation networks (Sheffi, 2001). Such disasters affect a large number of economic variables, such as industrial production, international trade, and logistics operations, and on occasion revealing hitherto hidden vulnerabilities in global supply chains (Tett, 2011).
In addition to these disastrous events, supply chains must also continue to operate through unexpected changes in supply and demand. In 2001, Cisco suffered a loss of 2.2 billion dollars due to a sudden decline in demand for their products, which resulted in the accumulation of a large inventory stockpile (Supply Chain Digest, 2006). Therefore, the design of supply chains that can maintain their function in the face of perturbations, both expected and unexpected, is a key goal of supply chain management. Up until the turn of the millennium, the primary focus of supply chain management was on increasing efficiency by means of globalization, specialisation and lean supply chain practice. Although, these practices enable cost savings in daily operations, they have also made the supply networks more vulnerable to disruptions (World Economic Forum, 2013). Under a low probability-high impact disruption, lean supply chains shut down in a matter of hours, with global implications. Supply concentration and IT reliance make the supply chains vulnerable to targeted attacks, where critical nodes are impacted. This is particularly evident in the supply systems with low levels of ‘buffer’ inventory, which result in rapid impacts under interruptions in supply relative to the demand (Cranfield University, 2002).
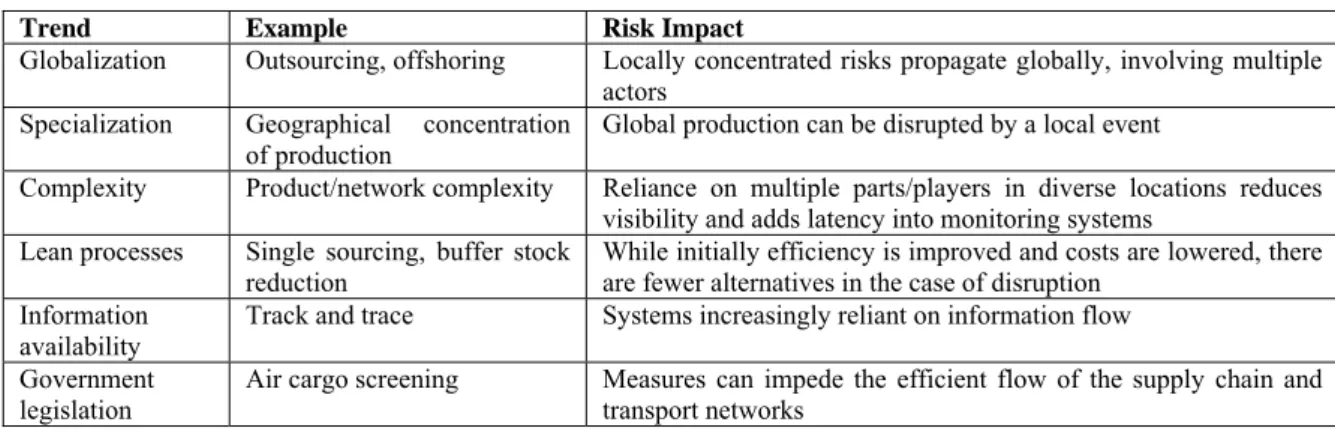
World Economic Forum (2013) presented Accenture’s expert group research findings on how the recent trends in supply chain management practices have shifted risk distributions. Table 1 summarises these effects.
Table 1: Trends in Supply Chain Management Practices (adapted from World Economic Forum, 2013)
Trend Example Risk Impact
Globalization Outsourcing, offshoring Locally concentrated risks propagate globally, involving multiple actors
Specialization Geographical concentration of production
Global production can be disrupted by a local event
Complexity Product/network complexity Reliance on multiple parts/players in diverse locations reduces visibility and adds latency into monitoring systems
Lean processes Single sourcing, buffer stock
reduction While initially efficiency is improved and costs are lowered, there are fewer alternatives in the case of disruption Information
availability Track and trace Systems increasingly reliant on information flow Government
legislation
Air cargo screening Measures can impede the efficient flow of the supply chain and transport networks
It is evident that both practitioners and scholars in the field increasingly recognise the importance of building resilience into supply chains. A recent trend of publications, by both academic and industry communities, reveals the importance of the concept of resilience in global supply chains. Researchers in the field have acknowledged the increasing complexity of supply chains and have started investigating and modelling what were traditionally viewed as linear supply systems as ‘complex systems’ (Wycisk et al., 2008). Recently, increasing focus is given to the modelling of supply networks as ‘complex adaptive systems’, in order to examine the resilience characteristics offered by various complex network topologies (Choi et al, 2001; Surana et al., 2005).
The aim of this paper is to present a comprehensive review of the published research, mainly in the last decade, in fields related to the modelling of supply chain resilience as complex adaptive networks. Clarification of various ideas relating to supply chain resilience is provided and the approaches used by various researchers to model and understand the concept of supply chain resilience, using complex adaptive systems perspective, is discussed. Ultimately, this review paper aims to establish a stepping stone for the development of a comprehensive conceptual framework for assessing supply chain resilience using complex adaptive network modelling techniques.
The paper is structured as follows; Section 2 outlines published findings on the concept of supply chain resilience; Section 3 presents a discussion, including comparisons and critiques, of the reviewed research; Section 4 outlines the possible directions for future research, building on the research published thus far; Section 5 provides a conclusion of this review; while Sections 6 and 7 include acknowledgements and references, respectively.
2. Literature
review
This section first investigates the concept of supply chain resilience, in the light of various definitions provided within the contemporary literature. Subsequently, the research work undertaken in the area of supply chain resilience modelling, particularly from a complex systems topology perspective, is discussed in more detail.
2.1
THE CONCEPT OF SUPPLY CHAIN RESILIENCE
Surana et al. (2005, pp. 4235) define the function of a supply chain as to ‘transfer information, products and finance amongst suppliers of raw materials, manufacturers, distributors, retailers, and consumers’.
Therefore, an efficient supply chain permits the goods to be produced and delivered in the right amounts, at the right time, to the right locations efficiently and reliably (Christopher and Peck, 2004). In line with the above, a resilient supply chain should respond quickly and effectively to a given perturbation such as a change in supply or demand, or to the failure of an individual component within the overall system due to manmade (war and terrorist attacks) or natural (hurricanes, tsunamis, earthquakes, floods, etc) disasters.
Up until the turn of 21st century, the key focus of supply chain management was to create efficient
supply chains with high speed/low cost production and delivery. As a result, many companies have adopted centralised manufacturing and distribution facilities to take advantage of economies of scale arising from such systems. However, when demand for a particular product fluctuates unexpectedly, these companies are unable to respond in time (Lee, 2004).
In light of the experience from 9/11 terrorist attacks, and other manmade and natural disasters which occurred within the last 10 to 15 years, the globalised supply chain operators have realised the importance of building resilient supply chains to withstand high impact-low probability disruptions. Therefore, the focus has recently been shifted from supply chain efficiency to supply chain agility (more broadly defined as supply chain resilience).
The lack of historical data on the effects on supply chain operations from these high impact-low probability events has made it difficult to develop a common resilience framework for SCNs. Therefore, most researchers rely on simulation models to understand this phenomenon. Alternatively, the researchers can extrapolate the effects low impact-high probability disruptions to supply chains, for which they have the benefit of hindsight, in order to estimate the impacts of high impact-low probability events (McFarlane and Sheffi, 2003).
The concept of resilience goes in parallel with the concept of disruption as identified by the researchers in a given context. A review of contemporary literature indicates presence of ambiguity and confusion in how the terms ‘resilience’ and ‘disruption’ are defined within the context of supply chains. Table 2 summarises the attempts by researchers, within the field of supply chain research, to define the concepts of ‘resilience’ and ‘disruption’.
Table 2: Concepts of ‘resilience’ and ‘disruptions’ as defined by various researchers Reference Definition of Disruption Definition of Resilience
Kim et al. (2015)
Supply network disruption is defined as a situation where there no longer exists a walk between the source(s) and sink nodes as a consequence of a disruption(s) in nodes or arcs, i.e.: the supply network becomes disconnected.
Supply network resilience = The total number of node or arc disruptions, which does not result in a supply network disruption, divided by the total number of node or arc disruptions.
Levalle and
Nof (2014) No formal definition provided
Flow from one agent to another must comply with a service level agreement - i.e. A set of pre-arranged, mutually agreed terms of service that describe the required characteristics of the supplied flow. The level of compliance to these pre-arranged conditions is defined as the quality of service (QOS). Resilience is defined as the inherent ability of a supply network agent to (1) anticipate errors and conflicts, (2) prevent them from creating disruptions to normal operation and (3) overcome disruptions with minimum QoS loss, within sustainable use of resources.
Rajesh and
Ravi (2014) No formal definition provided.
Definition of resilience is borrowed from Christopher and Peck (2004). Resilient suppliers are defined as, 'suppliers who are able to provide good quality products at economy rates and flexible enough to accommodate demand fluctuations with shorter lead times over a lower ambience of risk without compromising on safety and environment practices'.
Soni et al. (2014)
The definition of supply chain disruptions is borrowed from Svensson (2001): ‘‘unplanned events that may occur in the supply chain which might affect the normal or expected flow of materials and components’’
Supply chain resilience focuses on the system's adaptive capability to deal with temporary disruptive events. In this paper, the authors consider these capabilities as "enablers" that facilitate the attainment of resilience in supply chain.
Bartos (2012) No formal definition provided
Resilience is defined as the capacity of organisations or systems to return to full functionality in the face of disruption. The characteristics of a resilient logistics network or supply chain are commonly identified in terms of redundancy and flexibility, to which should be added the dimension of concentration (a more concentrated network is less resilient than a dispersed one).
Zhao et al. (2011a)
Disruptions are identified as loss of some structures or functions; i.e.: node and/or link removal within the SCN.
Resilience is defined as the ability of the supply chain to maintain operations and connectedness under the loss of some structures or functions (this is simulated by removal of nodes).
Zhao et al. (2011b)
Disruptions are identified as loss of some structures or functions; i.e.: node and/or link removal within the SCN.
Robustness and resilience are used interchangeably. The authors do not distinguish between them. Subsequently, robustness is defined as the ability of a network to maintain operations and connectedness when some structures or functions are lost.
Klibi et al.
(2010) No formal definition provided.
Resilience is defined as the capability of a SCN to avoid disruptions or quickly recover from failures.
Ponomarov and Holcomb (2009)
A formal definition of disruption has not been provided. Sources of disruptions are discussed.
Resilience is defined as the adaptive capability of the supply chain to prepare for unexpected events, respond to disruptions, and recover from them by maintaining continuity of operations at the desired level of connectedness and control over structure and function.
Wang and Ip
(2009) No formal definition provided.
Resilience is understood as the ability of a system to return to a stable state following strong perturbation from failure or attack. The recover ability may include the failure prediction and identification abilities, quickly repair or replace abilities, and resource reorganizing or emergent supply abilities.
Falasca et al.
(2008) No formal definition provided.
Supply chain resilience is defined as the ability of a supply chain system to reduce the probabilities of a disruption, to reduce the consequences of those disruptions once they occur, and to reduce the time to recover normal performance. The above definition is provided in the context of resilience triangle as per Tierney and Bruneau (2007).
Hu et al. (2008)
Disruption, at its primary form, is defined as a loss of capacity. This can be viewed as removal or reduced capacity of one or more nodes (either transformation or transportation).
Resilience is defined as the ability of an enterprise to withstand potentially high disruptive events.
Datta et al.
(2007) No formal definition provided. Resilience is defined as the ‘performance of an actual production/distribution system under uncertain demand’
Sheffi and Rice (2005)
The term ‘disruption’ has not been formally defined. However, a typical 'disruption' is characterised by 8 distinct stages - (1) preparation, (2) the disruptive event, (3) first response, (4) initial impact, (5) full impact, (6) recovery preparations, (7) recovery and (8) long term impact.
Resilience is defined as the ability to bounce back from a disruption. Resilience can be improved by either creating redundancy or by increasing flexibility.
Christopher and Peck (2004)
Disruption is considered as an exposure to serious disturbance.
Resilience is defined as the ability of a system to return to its original state or move to a new, more desirable state after being disturbed (flexibility and adaptability aspects are built into this definition).
Dalziell and McManus (2004)
No formal definition provided.
Authors propose using the term 'resilience' to describe the overarching goal of a system to continue to function to the fullest possible extent in the face of a stress to achieve its purpose, where resilience is a function of both the vulnerability and of the adaptive capacity of the system.
From the summary presented in Table 2, it is evident that no clear consensus exists among the researchers on the exact definition of the term ‘resilience’. Some researchers define resilience as an inherent property/ability within the supply network (Levalle and Nof, 2014) while the others identify it as a goal for the overall system (Dalziell and McManus, 2004). Some describe resilience as both an inherent property and a dynamic capability of the overall system (Christopher and Peck, 2004; Falasca et al., 2008; Ponomarov and Holcomb, 2009; Klibi et al., 2010).
Sheffi and Rice (2005) stipulate that through creating redundancy or by increasing flexibility, the overall system resilience can be improved. However, this assertion is challenged by Kim et al. (2015) who illustrate through their simulation results that denser networks do not necessarily have higher resilience. As per the above, the resilience measurement is indeed dependent on the analysis perspective and the resilience metrics utilised by each researcher.
Although most researchers define the term ‘resilience’ in unique ways, only a few have attempted to link this concept with a formal definition of ‘disruption’ within the context of supply chain operations. However, from the context of these researchers, it can be assumed that the term ‘disruption’ is used to describe a significant unforeseen variation to business as usual operations. Therefore, it is important to recognise ‘business as usual operations’ within the context of supply chain operations since any business will likely have variations to their operations on a daily basis. The key distinction to be made here is that the term ‘disruption’ should refer to unforeseen events in the system that have adverse impacts on the overall capacity instead of regular perturbations such as expected daily fluctuations in capacity.
As “you can’t manage what you don’t measure”, it is important to establish the term ‘disruption’ as a measurable variable, in order to effectively control and mitigate the unfavourable effects arising from such disruptions. This is particularly relevant in scenarios where post disruption supply network rewiring is sought – at which stage the rewiring costs (costs associated with establishing new relationships/contracts) must be compared against the costs arising from loss of service due to the disruption.
Kim et al. (2015) illustrate the importance of identifying each disruption at the level at which it occurs and the scope of its effect, by providing an example involving Toyota, which experienced a disruption at a component plant in Japan (a cause at node level), which subsequently led to a shutdown in Toyota’s North American truck production (the effect at the supply network level).
Therefore, the term ‘disruption’ should be defined, at an organisational level, as an event, which contributes to the loss of capacity of the supply network, below a pre-set threshold service to capacity ratio (depending on the organisation). Furthermore, it is important to establish the location (node or a link) and scope (spread) of this disruption.
The general definition derived above, in principle, is in agreement with the definition of a disruption as identified by Hu et al. (2008) and Levalle and Nof (2014). Using the above definition, each organisation can establish the costs due to a particular disruption, thus enabling the management to make informed decisions on the various trade-offs involved among respective options.
Longstaff et al. (2010) define resilience in the context of ‘communities’. This definition presents resilience as a function of robustness and adaptive capacity (see Figure 1 below). As can be seen from the figure, the Y-axis of the graph represents the ‘robustness’ of the system – which essentially reflects how difficult it is to disrupt the overall system (i.e. the difficulty of pushing the system below the normal operational capacity by a set threshold). The X-axis of the graph indicates the ‘adaptive capacity’ of the system, which represents how quickly the system can ‘bounce back’ to its normal operations once a disruption has occurred. The resilience of the system is therefore the area under the graph.
Hypothetically, from the above definition, two separate systems could have an equal amount of resilience, but a different mix of robustness and adaptive capacity. Moreover, the relationship between the robustness and the adaptive capacity, as indicated below, suggests that they are inversely related to each other – i.e. increasing the system robustness will reduce its adaptive capacity and vice versa.
Figure 1: Concept of ‘resilience’ defined as a function of robustness and adaptive capacity (Longstaff et al., 2010)
2.2 COMPLEX
SYSTEMS
MODELLING
OF SUPPLY CHAIN RESILIENCE
Most research work, in the area of supply chain resilience, has focussed on qualitative strategies that could be adopted at each level within a supply chain to minimise the adverse impacts of disruptions (Christopher and Peck, 2004; Christopher and Rutherford, 2004; Dalziell and McManus, 2004; Jüttner, 2005; Sheffi and Rice, 2005; Craighead et al., 2007).
In addition to the above, quantitative work involving the simulation of supply chains is developed by a number of researchers. Traditionally, the supply networks are modelled as multi-agent systems, in order to represent explicit communications between various entities involved (Thadakamaila et al., 2004). However, a recent research trend has focussed on modelling supply networks as complex adaptive systems. Such an approach has enabled the researchers to investigate various topological properties of different networks which give rise to resilience characteristics in a given supply network.
Moreover, recent advances in network theory have further encouraged the researchers to adopt a complex network perspective in modelling supply chain operations. This is evident in the work published by: Thadakamaila et al., 2004; Nair and Vidal, 2011; Zhao et al., 2011(a); Zhao et al., 2011(b) and Kim et al., 2015. Complex network perspective can be adopted to assess the supply chain operations, if the level of analysis considers the overall supply network level.
Owing to the advancements in information technology and globalization in the 21st Century, supply
chains which once resembled linear flows of goods from manufacturers to customers, have now evolved into dynamic and complex supply networks comprising various interacting entities. A supply network consists of nodes, which represent spatially stable entities (such as manufacturer, distributers, warehouses and retailers), and links, which represent dynamic interactions between nodes (such as transportation, communication and logistic routes between two or more nodes).
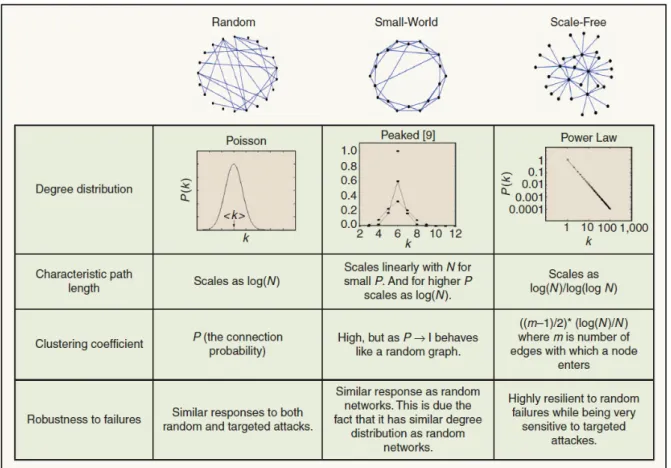
Broadly classified, the complex network modelling of SCNs has mainly focussed on the following network topologies for benchmarking purposes;
1) Random graphs (Erdȍs and Rényi, 1959): where vertices are randomly connected to each other. 2) Small-world networks (Watts and Strogatz, 1998): most nodes of such a network are not
neighbours of one another, but most nodes can be reached from every other node by a small number of steps.
3) Scale-free (Barabási and Albert, 1999): degree distribution follows a power law, at least asymptotically.
The key characteristics of the above network topologies are presented in Figure 2.
Figure 2: Comparison of random, small-world and scale free networks (Thadakamalia et
al., 2004)
Many researchers have developed new ‘hybrid’ network topologies which incorporate various characteristics of one or more basic network structures identified above (Thadakamaila et al., 2004; Zhao et al., 2011(a); Kim et al., 2015). By adopting such a ‘complex network view’ of supply chains, these researchers have studied the resilience of supply networks from a network topological perspective.
2.2.1 Attachment
Rules
The variations to basic random and scale-free network models can be generated by various network growth models. A given network growth model governs the evolution of complex networks by specifying the way in which the new nodes connect with the existing ones in the network (Zhao et al., 2011(a)). This process is referred to as ‘attachment’ and therefore the various network growth models comprise various ‘attachment rules’ which subsequently generate networks with distinctive topologies. By accounting for growth mechanisms, these network models are able to represent dynamical and open system characteristics of real life SCNs, where nodes enter and exit the network over time (Hearnshaw and Wilson, 2013). However, in contrast with the random and scale-free network models, the small-world networks imply a fixed number of nodes and therefore cannot be used to model network growth. Small-world networks are of limited use when growth is involved in the network (typically the case in real world supply networks).
For example, in random networks, the evolution is governed by a random attachment model, in which
pairs of nodes are randomly connected with each other at a pre-defined probability level (Erdȍs and Rényi, 1959). In contrast, scale-free networks evolve through a preferential attachment model which
stipulates that the probability of attaching a new node to an existing node which is directly proportional to the degree (the number of connections) of the existing node (Barabási and Albert, 1999).
The preferential attachment model, in principle, represents the ‘rich get richer’ concept and therefore the resulting scale-free network topology can be used to model many real world networks, such as the World Wide Web, power grids, metabolic networks and social networks (Surana et al., 2005). This concept explains the existence of ‘hubs’ (a few nodes with a large number of connections), which is a unique feature within scale-free networks (Barabasi and Bonabeau, 2003).
2.2.2
Network Resilience Metrics
Each of the complex network topologies discussed above comprise various resilience against failures levels1. Network failures can be categorised either as ‘random failures’ or ‘targeted attacks’. Random
failures entail the same probability of failure across each node within a given network. By contrast, in a ‘targeted attack’ high degree nodes are compromised with a higher probability (Ruj and Pal, 2014). It has, so far, been established that the random networks respond similarly to both random failures and targeted attacks. In comparison, the scale-free networks are resilient against random failures but are highly sensitive to targeted attacks. This is due to the presence of hubs (most connected nodes) in scale-free networks, which are usually the nodes targeted by an attacker.
As per the above, random and scale-free network topologies represent two characteristically distinct network structures which operate in unique ways under random failures and targeted attacks. A number of researchers have modelled the operations of various SCN topologies under both random failures and targeted attacks, and attempted to establish an optimal topology which can withstand each type of failure, without compromising the overall network functionality.
1 The term ‘failure’ is used to identify the removal of nodes and/or links within a network. An important distinction between ‘failure’ and
Each research study has established a set of resilience metrics, in order to assess and compare the resilience of each network topology simulated under random failures and targeted attacks. These resilience (or ‘robustness’, as used by some researchers) metrics are variations of the existing standard topological metrics from graph theory. Some of the most common network topology metrics are outlined in Table 3 below. Costa et al. (2007) and Rubinov and Sporns (2010) provide a comprehensive range of measurements used for characterization of complex networks.
Table 3: Common network topology metrics (Zhao et al., 2011(b)) Topology level metric Description of the metric
Characteristic path length. The average of the shortest path length between any two nodes. Size of the largest connected
component of a network.
The number of nodes in the largest connected component of a network. Average path length in the largest
connected component. The average of the shortest path length between any two nodes in the largest connected component of a network. Maximum path length in the largest
connected component. The maximum path length between any two nodes in the largest connected component of a network.
The above metrics consider the roles of separate entities (nodes and links), within a distribution network, to be homogeneous. Such an assumption would be far-fetched, since the entities within a real-life supply network play different roles with different characteristics – for example, the distance between two supply nodes or two demand nodes are not as important as that between a supply and a demand node (Zhao et al., 2011(b)).
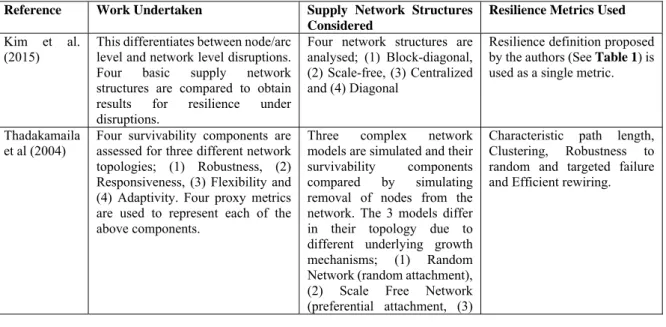
Therefore, the researchers (such as Thadakamaila et al., 2004; Zhao et al., 2011(a) and Zhao et al., 2011(b)) in the field have developed new metrics which realistically represent the heterogeneous roles of entities within the supply network. These metrics include variations to one or more of the basic network topology metrics, by adding a flavour of supply availability, connectivity and accessibility. Table 4 summarises published work in this area, considering various supply network topologies and their resilience measured by various metrics.
Table 4: Supply network topologies and resilience metrics Reference Work Undertaken Supply Network Structures
Considered
Resilience Metrics Used
Kim et al. (2015)
This differentiates between node/arc level and network level disruptions. Four basic supply network structures are compared to obtain results for resilience under disruptions.
Four network structures are analysed; (1) Block-diagonal, (2) Scale-free, (3) Centralized and (4) Diagonal
Resilience definition proposed by the authors (See Table 1) is
used as a single metric.
Thadakamaila et al (2004)
Four survivability components are assessed for three different network topologies; (1) Robustness, (2) Responsiveness, (3) Flexibility and (4) Adaptivity. Four proxy metrics are used to represent each of the above components.
Three complex network models are simulated and their survivability components compared by simulating removal of nodes from the network. The 3 models differ in their topology due to different underlying growth mechanisms; (1) Random Network (random attachment), (2) Scale Free Network (preferential attachment, (3)
Characteristic path length, Clustering, Robustness to random and targeted failure and Efficient rewiring.
Proposed Network Model with new attachment rules specified.
Qiang et al
(2009) A new SCN model is developed with multiple decision makers associated at different tiers and with multiple transportation modes for shipment of the goods between tiers. Furthermore, a weighted supply chain performance and robustness measure is proposed - these are demonstrated through a numerical example.
A novel SCN model is proposed to account for demand-side as well as the supply-side risks, with the demand being random and the supply-side risks modelled as uncertain parameters in the underlying cost functions.
A weighted supply chain (SC) performance measure is proposed. The robustness measure is represented by the difference between the base SC performance and the SC performance measure at some pre-specified uncertainty level.
Zhao et al
(2011(a)) New network resilience metrics that reflect heterogeneous roles of nodes in supply networks are used in a real life military logistic network. A hybrid and tunable network growth model called Degree and Locality-based Attachment (DLA) is proposed. Computer simulations are undertaken to compare resilience of several supply network topologies, which were developed by using different growth models.
Four networks are analysed; (1) Random (with random attachment), (2) Scale free (with preferential attachment), (3) Hierarchy + (with connections of nodes at same level in the hierarchy) and (4) DLA (with degree and locality based attachment).
Availability (supply availability rate), Connectivity
(size of the largest functional sub-network (LFSN)), Accessibility (average supply path length in the LFSN, max supply path length in the LFSN).
Nair and
Vidal (2011) Examines the robustness of individual network topologies by undertaking paired sample t-test for each network topology considered. The performance of a network in the absence of both random failures and targeted attacks is used as the base case. The performance of 20 network topologies considered in the presence of varying degrees of random and targeted disruptions are compared with base case.
Scale-free and random network topologies are considered.
Robustness is represented by; (1) average path length, (2) clustering coefficient, (3) size of the largest connected component, (4) maximum distance between nodes in the largest connected component.
Zhao et al (2011a)
The robustness of heterogeneous distribution against random and targeted supply disruptions are studied. Both system level and corresponding topology level robustness metrics are proposed. This taxonomy consists of system level metrics which include supply availability, network connectivity and delivery efficiency and corresponding topology level metrics. Also, a new RLR (randomized local rewiring) approach based on probabilistic and localized rewiring of a distribution network is proposed with various rewiring probabilities.
Scale-free and random network topologies are considered. Additional analysis is undertaken on small-world networks. Comparison is undertaken for each of these networks against the performance of a RLR (randomized local rewiring) network.
New resilience metrics are proposed to distinguish the heterogeneous roles of the nodes in the systems. These metrics include, supply availability rate, size of the largest functional sub-network, inverse of average minimum supply path length across all demand nodes and the adjusted average inverse supply path length across all (supply and demand) path pairs.
Mari et al.
(2014) A resilience model is developed for a complex SCN. This model is compared against the performance of other major complex networks using agent-based simulation.
Random, small-world, scale free and HK-scale free networks are investigated.
Resilience is represented by; (1) clustering coefficient, (2) supply availability rate, (3) size of the largest functional SCN and (4) average supply path length in the largest functional SCN.
The performance and resilience of various supply chains can be assessed and compared against each other by combining the resilience metrics considered into a single objective function (with the aim of optimising this function). However, most studies have investigated the effects of disruptions on the performance measured by individual resilience metrics.
3.
Discussion of reviewed literature
From the literature presented above, the importance of defining the concept of resilience, in the context of supply chains, is evident. The definition of ‘resilience’ should be established in parallel with the definition of ‘disruption’. Another important distinction should be noted between the concepts of failure and disruption – the former represents a fully compromised node or a link with no capacity while the latter represents a scenario where the affected node or the link can operate, at least partially. Furthermore, depending on the structure of the overall supply network, disruptions can be experienced in various forms, such as; supply disruptions, logistics disruptions, coordination disruptions and demand disruptions (Yi et al., 2013). These various disruptions can be attributed to either nodes or links or both, for modelling purposes.
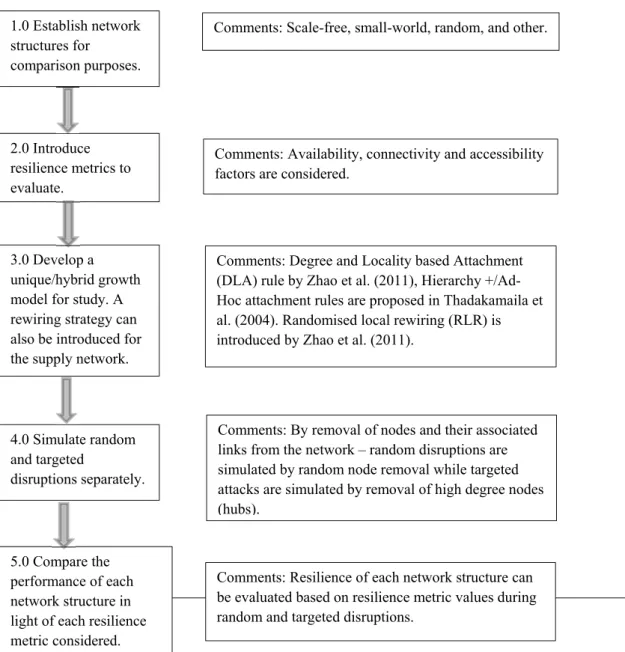
Figure 3 illustrates the general methodology used by researchers to simulate random and targeted disruption to
supply networks in order to assess and compare the resilience of various topologies (Thadakamaila et al., 2004; Zhao et al., 201(a); Zhao et al., 2011(b); Kim et al., 2015).
1.0 Establish network structures for comparison purposes. 2.0 Introduce resilience metrics to evaluate. 3.0 Develop a unique/hybrid growth model for study. A rewiring strategy can also be introduced for the supply network.
4.0 Simulate random and targeted disruptions separately. 5.0 Compare the performance of each network structure in
Comments: Scale-free, small-world, random, and other.
Comments: Availability, connectivity and accessibility factors are considered.
Comments: Degree and Locality based Attachment (DLA) rule by Zhao et al. (2011), Hierarchy +/Ad-Hoc attachment rules are proposed in Thadakamaila et al. (2004). Randomised local rewiring (RLR) is introduced by Zhao et al. (2011).
Comments: By removal of nodes and their associated links from the network – random disruptions are simulated by random node removal while targeted attacks are simulated by removal of high degree nodes (hubs).
Comments: Resilience of each network structure can be evaluated based on resilience metric values during
Figure 3: General simulation methodology
Various metrics are proposed by researchers to assess the supply chain resilience. For example, Kim et al (2015) derive a single metric for assessing supply network resilience, although this metric fails to account for different node and link level capabilities. Zhao et al (2011(a)) introduce a number of metrics which recognise the fact that nodes within a given network play heterogeneous roles. These metrics include availability, connectivity and accessibility characteristics of each network structure considered. Although it is possible to combine all the resilience metrics to a single objective function in order to optimise it, the focus is on investigating each component, which contributes to supply network resilience, separately. Whilst this approach provides a better understanding of supply network’s performance, under disruptions, from different perspectives (Zhao et al., 2011(a)), a single resilience metric would enable convenient comparisons to be undertaken between the resiliency of various network structures. However, such an approach will require the allocation of weights to each aspect of resilience based on their respective importance as determined by the application (for example, in a military logistics system, more importance will be placed on supply availability than on connectivity).
In relation to the growth mechanisms adopted to generate scale-free networks, the rich-gets-richer concept reflected within the mechanism of preferential attachment represents the competitive advantage (also known as the first mover advantage) of the first firm to establish itself within the supply network (by forming exchange relationships), compared to the late entrants. The above mechanism, however, inaccurately assumes that all firms within the supply network are homogeneous in nature with no differentiation (Hearnshaw and Wilson, 2013). In addition, the key requirement of the preferential attachment rule is that every new node joining the network must possess complete and up-to-date information about the degrees of every other existing node in the network. Such information, is unlikely to be readily available in a real world setting – for example, when considering a manufacturer for a new partnership, information about the overall reputation of that supplier may be more accessible than the number of their current suppliers and clients (Smolyarenko, 2014). Furthermore, as Newman (2003) stipulates, the Barabasi Albert (BA) model is a model of an undirected network – whereas the real life SCNs would include directed relationships (e.g.: delivery of physical goods).
Although the growth of random networks is driven by a random attachment model, in reality supply network formation (connection of nodes with others) is governed by a set of objectives which are far from random. In addition, the static network structure (with no growth model due to the fixed number of nodes) offered by small-world networks, in combination with the topology, which represents locally clustered nodes connected by a few long-distance arcs, do not typically represent real world supply networks. Consideration of such networks, which are rarely found in practice, is not suitable for deriving managerial implications for real supply networks. It is also possible for a supply network to comprise of various topologies representing different aspects of the overall operations – for example, the transportation network maybe grid-like while the communication network is scale-free.
The most common application of the complex network theory to real supply chains entails seeking improvements to resilience of the supply network. Therefore, these supply systems represent existing networks, to which improvements are sought – in terms of substituting a new node (or a link) to a failed or a disrupted one within the network. However, it should be realised that the supply networks, for which the resilience testing is sought, already possess a unique structure that may have evolved over time based on a non-generalizable growth model. Despite the large amount of published research in the field of supply chain resilience within the past few years, there is limited empirical validation of the conceptual findings, particularly in the arena of complex network modelling. In this paper, we argue that the attachment rule (or the growth model) of the supply network should consist of a weighted attribute mechanism whereby each organisation (i.e. an existing supply network) can select a new node to attach to, based on its characteristics. These characteristics could include quantitative aspects (such as: labour/product costs, distance etc - which can be consolidated into a single generalised cost function) and
qualitative aspects (such as: reliability, relationship, reputation, etc). This concept is discussed further in the next section.
In addition to the above, literature also varies in terms of level of analysis; from individual firm level to a single supply chain level to the overall supply network level (Kim et al., 2015). Therefore, it is important to recognise that the findings from a study undertaken at the supply network level may not necessarily be applicable for a scenario involving an individual firm and/or a single supply chain. Distinguishing the level of analysis of a given study allows practitioners to generalize valuable research findings at a particular level to which the findings are applicable.
4.
Future research avenues
The rapidly increasing complexity of global supply chains has resulted in a recent shift towards decentralised systems capable of autonomous behaviour. These systems (referred to as ‘smart systems’) are able to make independent decisions about production, distribution and transportation (Scholz-Reiter and Freitag, 2007). Although this smart technology has the ability to streamline the supply chain operations, resulting in significant cost savings to the global companies, the algorithms required to manage these systems as a whole, have not been fully developed. Research work published by Vespignani (2010) and Wycisk et al. (2008) have noted that the use of smart systems, which optimise individual components of the overall system, can aggravate the vulnerability of modern supply chains to perturbations in the volatile and turbulent global markets. Therefore, trade-offs between different variables within the entire system must be considered to achieve the optimal solution for a given supply network. As such, a holistic view of the overall supply network must be adopted, in the future, so that a system optimal solution, in terms of resilience, can be achieved. In this regard, the use of complex network theory to model real world supply networks is justified.
It is evident from the contemporary research work reviewed and presented in this paper that complex network theory can be effectively utilised to create an abstraction of the real SCNs by representing individual entities within the supply network (such as suppliers, manufacturers, distributers, retailers, etc) as nodes and the relationships between them (deliveries, financial transactions, information flows, contracts, etc) as links.
Table 5 illustrates the main findings and proposed future work from the key papers reviewed. Table 5: References/Findings/Future research proposed
Reference Main Findings Future Work Proposed
Kim et al. (2015)
In terms of resilience, it was found that Scale free>Centralized>Diagonal>Block-diagonal. The network-level metrics of betweenness centrality and centralization were found not correlating with resilience. The proposed approach clearly differentiates a node/arc disruption from a network disruption. Also, it was found that redundancy may not always lead to higher resilience.
All nodes and arcs having same probability of failure could be improved to reflect variable probabilities assigned arcs/nodes depending on their importance within the network. Functional and operational characteristics of arcs/nodes could be incorporated into the model. Also, partial functioning of nodes and links and potential rewiring mechanisms could be explored.
Thadakamail a et al. (2004)
For random attacks, the proposed network model is almost equal in robustness to scale free networks > random networks. For targeted attacks, the size of the largest connected component decreases much faster for the proposed network than other two. However, the proposed network performs better on the other two robustness measures.
Modification of the growth mechanisms to represent more realistic scenarios. The adaptivity of the network relates more to node functionality than to topology - the node functionality should facilitate the ability to rewire.
Qiang et al. (2009)
A new SC network model is developed with multiple decision makers associated at different tiers and with multiple transportation modes for shipment of the goods between tiers. Furthermore, a weighted supply chain performance and robustness measure is
Should consider more comprehensive metrics to evaluate the SC network performance and empirical applications should be undertaken for SCs within various industries.
proposed - these are demonstrated through a numerical example.
Zhao et al. (2011(a))
A hybrid and tunable network growth model called Degree and Locality-based Attachment (DLA) is proposed. DLA was found to offer a good compromise strategy under both random and targeted failures. The impact of locality on resilience was found to be weaker than the impact of degree. Resilience against random failures: Hierarchy+>Scale-Free>DLA>Random, Resilience against targeted failures: Random>DLA>Scale-Free>Hierarchy+
Only node failures simulated - must consider link failures. Operational details such as flow of good, capacity limits on various links and nodes have not been incorporated.
Nair and
Vidal (2007) Examined the robustness of individual network topologies by undertaking paired sample t-test for each network topology considered. Long average path lengths between nodes were found to be detrimental to the network's robustness against disruptions. Shorter average distances between nodes in the network allow faster propagation of products/info thus aid in enhancing the responsiveness of the supply network in the event of disruption.
The supply network robustness should be evaluated from multiple outcome metrics. Furthermore, it is important to consider various performance metrics such as inventories, backorders, total costs for a better understanding about network robustness.
Zhao et al. (2011(b))
The robustness of heterogeneous distribution against random and targeted supply disruptions are studied. A new RLR approach based on probabilistic and localized rewiring of a distribution network is proposed with various rewiring probabilities. The proposed RLR approach with various rewiring probabilities indicate reasonable robustness properties under both random and targeted disruptions. Real life application to a military logistic networks with scale free and small world topologies and a retailer's distribution network in California, indicate that rewired distribution networks generally have stable robustness against both types of disruptions.
(1) The simulation has only considered removal of nodes - should focus on removal of links also, (2) The robustness analysis is only presented at topological level, for real world applications, the operational level factors and constraints must be considered, such as the capacities of supply nodes, the needs of demand nodes, and the cost of transportation. (3) Effect of adaptive behaviours, such as increased capacity and new delivery routes, on the distribution network robustness in disruptions can be studied. (4) Could incorporate more heterogeneous roles in order to improve the real life validity of the findings.
From the findings and future research proposals noted in the literature reviewed, as summarised in Table 5, it is
evident that most of the previous research work undertaken in the field of modelling supply chains as complex adaptive systems have given primary consideration to network topology aspects. However, it must be noted that in addition to the network topology, the properties of individual constituents and the nature of their interactions also play a major role in characterizing the resilience of the overall supply network.
Within the past decade, a significant amount of effort is devoted to the study of measurement of node degree distributions, formulation of theories to describe the underlying growth mechanisms, effects of degree distribution and growth mechanisms on network resilience (by simulating addition and/or removal of nodes and links) and other related phenomena. Such investigations indeed further our understanding of the effects of network topology on supply chain resilience. However, such an approach is considered more suitable for a ‘naturally occurring’ networks, whose structure evolves under an autonomous mechanism (endogenous to the system). Several examples of such systems include the internet, World Wide Web and social networks (Ghoshal, 2009). The evolution of the aforementioned systems are distributed in nature, with no intervention by a central authority. In contrast, the evolution of a supply network is dependent on the interests of the overall organisation controlling the operations (e.g, the supply chain of Coca Cola would represent interests and priorities of this organisation). Furthermore, the nodes in supply networks, include various attributes (such as capacity, cost, qualitative features, etc). As such, important insights to supply network operations and resilience can be obtained by including the above operational aspects of nodes within the network model.
In addition, the links in the network which represent exchange relationships between individual entities also include important features. Hitherto, the focus of modelling is on unweighted and, for the most part, undirected
complex networks (where links between nodes are either present or not, as a binary variable). However, many real world networks exhibit large heterogeneity in the capacity and intensity of the connections (links) between the nodes. Rui and Ban (2012) state that empirical observations have illustrated the existence of nontrivial correlations and associations between link weights and topological quantities in complex networks. In the context of supply networks for example, the connection, be it a physical flow or a relationship, between one organisation and others are deemed to have variability in terms or the strength and importance (some exchange relationships may be more important compared to the others).
Therefore, the supply network can be better reflected and understood in terms of weighted networks, so that the heterogeneity in capacity and intensity in various connections are captured accurately in the model. This weighting of links can be a function of volume, frequency and criticality of flows in a given period (Hearnshaw and Wilson, 2013). The final network will include links which carry a numerical value representing the strength of the connection between the two nodes at each end (Boccaletti et al., 2006). A summary of complex network measures for weighted and directed networks is presented in Rubinov and Sporns (2010).
It is therefore imperative to consider the above operational features in any modelling approach to obtain meaningful insights on the behaviour of real life supply networks. In following the above approach, the heterogeneity between the individual constituents of the overall supply network can be more realistically modelled. It should also be noted that the resilience metrics will also need to be updated in light of the incorporated node/link operational characteristics. Cox et al., (2011) define categories specific to static and dynamic resilience metrics in the context of transportation system operation (as opposed to the network topology). Some of these metrics include; conservation of service, input substitution, inventories, excess capacity and relocation. An assessment undertaken against the above set of metrics will accurately represent the resilience of a given supply network in light of both topology and operations.
Most real world supply networks include a fixed number of firms (systems which do not continuously grow). However, modelling fixed number of firms is difficult since the static models do not exhibit a power law connectivity distribution (Barabasi and Bonabeau, 2003). In this regard, some promising research work is undertaken in the recent years, to overcome the difficulty of generate scale-free networks topologies for networks with a fixed number of nodes, by means of either continuously adding links to represent new exchange relationships (Paperin et al., 2008) or through continuous rewiring of existing exchange relationships (Xie et al., 2008). The implication of the connection dynamics above translates to real world events as follows;
1) The continuous addition of links can be described as the ongoing relationships, at various time periods, between different firms within the overall system (a manufacturer for example can have more than a single supplier); and
2) The continuous rewiring of existing links can be described as the ongoing exchange behaviour where firms within the supply network rotate contracts among the available pool (for example, supplier contracts tend to be rotated among various suppliers over time such as periodic retendering of supply contracts).
Hearnshaw and Wilson (2011) note the following limitations in using the ‘preferential attachment’ growth mechanism presented in the BA model for modelling real world supply networks;
1) The network growth, while imperative to model real world supply networks, may not necessarily be applicable for the majority of the cases where supply chains do not continuously grow – i.e. most supply chain systems are likely to include a relatively fixed number of firms over extended periods of time; 2) The preferential attachment assumes that acquisition of new exchange relationships by a given firm is
determined solely by the number of its existing exchange relationships. This assumption implies that the number of exchange relationships for a given firm is a function of their duration within that supply network. Li (2009) has presented significant exception to the above idea using Google as an example – despite being a late entrant, Google has managed to dominate the search engines for the World Wide
Web by establishing much more exchange relationships. As such, a need exists to represent the ‘fitness’ of the firm to explain behaviour where new entrants dominate the supply chain within a relatively short period of time, such as Google.
3) Growth by preferential attachment produces a decaying clustering coefficient as the network expands. This may not a realistic representation of exchange relationships in real supply networks.
As such, the preferential growth mechanism requires several modifications to account for modelling of the real supply chains. Ghadge et al. (2010) develop a lognormal fitness attachment model which accounts for the various factors that contribute to the likelihood of a new node being attracted to an existing node within a network. In the BA model, the attachment probability is based on the degree of the existing node (number of existing connections), and within the context of supply networks, this is a proxy for the existing impact that particular entity (organisation) has on the overall industry. However, within the supply network context, when deciding to connect to a new node, various attributes of this node will certainly be considered (be it the cost, reliability, efficiency, reputation, etc). As such, an attachment rule, which considers the node ‘fitness’ is deemed more relevant for modelling real life supply networks.
In the model proposed by Ghadge et al. (2010), the fitness Φi which represents the propensity of node i to attract
links is formed multiplicatively from a number of attributes {Φ1, Φ2,…., ΦL} as follows;
Where each attribute, Φl is represented as a real non-negative value. Subsequently, it is assumed that the number
of attributes affecting a node’s attractiveness is sufficiently large and are statistically independent. Therefore, the overall fitness Φi will be lognormally distributed, regardless of the type of distribution of individual factors
(Nguyen and Tran, 2012).
The fitness based attachment procedure proposed by Ghadge et al. (2010) is as follows;
1) Start with the initial network of n0 nodes, each assigned a random fitness according to the lognormal
distribution
2) Each time a new node is added; stop after the nth node is added.
a. Assign a random fitness to the new node according to the lognormal distribution.
b. Add m edges linking the new node to m distinct existing nodes such that the probability πi for
connecting to an existing node i is taken to be proportional to its fitness Φi.
Φi ∑ Φj
The above attachment rule, named the ‘Lognormal Fitness Attachment’ (LNFA), is almost identical to the BA model – the key difference being that information on node fitness is substituted in place of node degree information. Based on the BA model, the degree of a new node at the time it joins the network is small, and therefore this node has to exist within the network for a long period of time before it may become a preferential choice for the future new nodes to attach to. In LNFA, a new node which has a large fitness, despite being in the network for a short period of time, can make itself a preferential choice for the other new nodes entering the network (Nguyen and Tran, 2012). The above is a reasonable representation of real life network growth as attractiveness of a node may not result from the number of nodes it is connected to, rather it is the general ‘fitness’ of this node that is significant (see the Google example earlier in this section).
The LNFA includes a tunable parameter Ϭ, which can be manipulated to generate a large range of real world networks. At one extreme, when Ϭ is zero, all nodes have the same fitness and therefore at the time a new node
joins the network, it chooses an existing node as a neighbour with equal probability – thus replicating the random graph model with an exponential degree distribution. On the other hand, when Ϭ is increased beyond a certain threshold, a very few nodes will contain very large level of fitness while an overwhelming majority of nodes include extremely low levels of fitness. As a result, the majority of new connections will be made to a single or a very few nodes which have high levels of fitness. The resulting network therefore resembles a monopolistic/”winner-take-all” scenario, which can also be observed in real world. Between the above two extremes (exponential and monopolistic) lies a spectrum of power-law networks which can closely represent the operations of real world complex networks.
Finally, it is to be noted that the attachment mechanism derived shall indeed be domain specific (Thadakamaila et al., 2004) – i.e. the attachment rule should closely represent the properties and key considerations of the supply network under scrutiny. Also, the attachment rules should be specified at node level rather than at the network level (i.e. the attachment rule varies based on the type of the node that enters the system, for example the fitness criteria for a supplier maybe different to that of a manufacturer, etc).
4.1 Proposed
Considerations
The following table summarises the methodological improvements, as identified in the above section, in modelling a supply network as a complex adaptive network. This improved approach relies on past research work undertaken in the area of topological analysis and attempts to create a model that produces a realistic representation of supply networks by accounting for a number of major factors that play a vital role in the formation of real supply networks. The key questions posed in this respect are summarised in Table 6.
Table 6: Key issues and proposed considerations
Key Question Considerations Potential Solutions
How to incorporate individual
components within a SCN in to the model?
Spatially stable entities as nodes and exchange processes (information, goods, services, relationships, etc) as links. Heterogeneity of each component (nodes and links) should be incorporated.
Create a pool of nodes (suppliers, manufacturer, distributors, retailers, etc) with various attributes to reflect heterogeneity. These attributes could be in the form of Boolean (one of two states), discrete or continuous variables (such as capacity, demand, flows, costs, behaviour, etc). Complete the network using directed and weighted links based on the nature and intensity of the relationship between the two nodes it connects. What is the most
appropriate growth model that should be adopted to model an evolving complex SCN?
Consideration should be given to the unique characteristics of each node entering the system (variable propensity of attraction). Domain specific attachment probabilities should be used.
Customised probabilistic attachment rules can be developed based on key considerations (domain specific).
Node fitness should be a key indicator of attachment probability as opposed to the node degree.
The type of attachment mechanism should depend on the type of the node that enters the system.
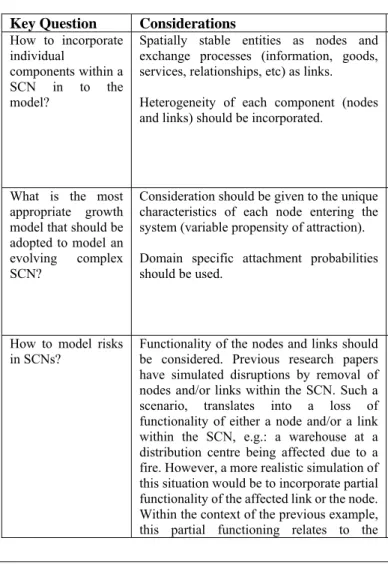
How to model risks in SCNs?
Functionality of the nodes and links should be considered. Previous research papers have simulated disruptions by removal of nodes and/or links within the SCN. Such a scenario, translates into a loss of functionality of either a node and/or a link within the SCN, e.g.: a warehouse at a distribution centre being affected due to a fire. However, a more realistic simulation of this situation would be to incorporate partial functionality of the affected link or the node. Within the context of the previous example, this partial functioning relates to the
An important distinction must be made between the full loss (failure) or partial loss of functionality (disruption) of nodes and/or links within the SCN, in simulation procedures, in order to more realistically represent the SCN functions under disruptions.
The spatially embedded networks, which are similar to most supply networks, exhibit different resilience properties since spatial failure could potentially affect clusters of nodes and/or links. Such considerations could be incorporated within
warehouse, being able to function after the
fire, at least in part. the simulation model by generating network overlays (to indicate network interdependencies). What criteria should
be used to assess the resilience of a SCN?
Similar to the network topological studies, develop relevant operational metrics to optimise. Given the focus of the study is to improve the resilience of supply chains, these operational metrics will correspond to resilience of the overall system.
Initial studies will evaluate the performance of the overall system, when links and/or nodes are randomly removed and when vital links and/or nodes are intentionally removed, in light of the metrics established in the above step.
How to develop a rewiring mechanism for an existing SCN?
Previous research work has considered full removal of a given link and/or a node. However, a more realistic representation can be obtained by modelling partial functionality of these network elements.
Rewiring mechanism can be developed by accounting for the partial functionality of nodes and/or links. This will allow comparison of rewiring costs against the costs incurred due to the loss of service (full or partial).
5.
Conclusions
This paper has presented a comprehensive and critical review of the previous research work undertaken in the arena of complex adaptive systems modelling of supply chain network resilience. Although the complex network theory offers a rich conceptual representation of the supply network principles, a number of potential improvements to the existing modelling approach are identified and are proposed as future research avenues. Furthermore, clarification is provided for the concept of ‘resilience’, which is to be used in parallel with the concept of ‘disruption’.
The next phase of this work entails the incorporation of the proposed methodological improvements in a simulation model to obtain the findings on supply network resiliency. This model can then be tested empirically for on a supply network within a specific domain.
6.
Acknowledgements
The authors would like to thank Prof. Michiel Bliemer, Dr. Tanya Latty and Dr. Eliza Middleton for their valuable comments on the content of this paper. Also, we acknowledge the Australian Research Council (ARC) for funding this work under grant DP140103643.
7.
References
Barabási, A. L., & Albert, R. (1999). Emergence of scaling in random networks. Science, 286(5439), 509-512.
Barabási, A. L., & Bonabeau, E. (2003). Scale-free networks. Scientific American, 288(5), 50-59.
Bartos, S. Department of agriculture Australian government, fisheries and forestry,Commonwealth of Australia, Canberra, 2012.
Boccaletti, S., Latora, V., Moreno, Y., Chavez, M., & Hwang, D. U. (2006). Complex networks: Structure and dynamics. Physics reports, 424(4), 175-308.
Canis, B. The Motor Vehicle Supply Chain: Effects of the Japanese Earthquake and Tsunami.Congressional Res earch Service (2011).
Choi, T. Y., Dooley, K. J., & Rungtusanatham, M. (2001). Supply networks and complex adaptive systems: control versus emergence. Journal of operations management, 19(3), 351-366.
Christopher, M., & Peck, H. (2004). Building the resilient supply chain. The international journal of logistics management, 15(2), 1-14.
Christopher, M., & Rutherford, C. (2004). Creating supply chain resilience through agile six sigma. Critical Eye, 24 - 28.
Costa, L. D. F., Rodrigues, F. A., Travieso, G., & Villas Boas, P. R. (2007). Characterization of complex networks: A survey of measurements. Advances in Physics, 56(1), 167-242.
Cox, A., Prager, F., & Rose, A. (2011). Transportation security and the role of resilience: A foundation for operational metrics. Transport policy, 18(2), 307-317.
Craighead, C. W., Blackhurst, J., Rungtusanatham, M. J., & Handfield, R. B. (2007). The severity of supply chain disruptions: design characteristics and mitigation capabilities. Decision Sciences, 38(1), 131-156.
Dalziell, E. P., & McManus, S. T. (2004). Resilience, vulnerability, and adaptive capacity: implications for system performance.
Datta, P., Christopher, M., & Allen, P. (2007). Agent-based modelling of complex production/distribution systems to improve resilience. International Journal of Logistics Research and Applications, 10(3), 187-203.
Erdős, P.; Rényi, A. (1959). "On Random Graphs. I". Publicationes Mathematicae 6: 290–297.
Falasca, M., Zobel, C. W., & Cook, D. (2008, May). A decision support framework to assess supply chain resilience. In Proceedings of the 5th International ISCRAM Conference (pp. 596-605).
Ghadge, S., Killingback, T., Sundaram, B., & Tran, D. A. (2010). A statistical construction of power-law networks. International Journal of Parallel, Emergent and Distributed Systems, 25(3), 223-235.
Ghoshal, G., Zlatić, V., Caldarelli, G., & Newman, M. E. J. (2009). Random hypergraphs and their applications. Physical Review E, 79(6), 066118.
Hearnshaw, E. J., & Wilson, M. M. (2013). A complex network approach to supply chain network theory. International Journal of Operations & Production Management, 33(4), 442-469.
Hu, Y., Li, J., & Holloway, L. E. (2008, August). Towards modeling of resilience dynamics in manufacturing enterprises: Literature review and problem formulation. In Automation Science and Engineering, 2008. CASE 2008. IEEE International Conference on (pp. 279-284). IEEE.
Jüttner, U., & Maklan, S. (2011). Supply chain resilience in the global financial crisis: an empirical study. Supply Chain Management: An International Journal, 16(4), 246-259.
Kim, Y., Chen, Y. S., & Linderman, K. (2015). Supply network disruption and resilience: A network structural perspective. Journal of Operations Management, 33, 43-59.
Klibi, W., Martel, A., & Guitouni, A. (2010). The design of robust value-creating SCNs: a critical review. European Journal of Operational Research, 203(2), 283-293.
Lee, H. L. (2004). The triple-A supply chain. Harvard business review, 82(10), 102-113.
Levalle, R. R., & Nof, S. Y. (2014). Re