Bottom-up visual attention model for still image:
a preliminary study
Adhi Prahara a,1,*, Murinto a,2, Dewi Pramudi Ismi a,3
a Informatics Department, Universitas Ahmad Dahlan, Yogyakarta, Indonesia 1[email protected]; 2 [email protected]; 3 [email protected]
* corresponding author
1.
Introduction
The study of human visual attention begins with a philosophy, scientifically explained in cognitive psychology and neuroscience, then computationally modeled in computer science and engineering. The computational model of human visual attention has been intensively studied, especially in the field of computer vision. Computer vision is a study to model biological vision into artificial vision. Computer vision has two aims which are to propose the computational models of human visual system (HVS) and to build an autonomous system that performs the same tasks or even surpass the human visual system
[1]. Recently, computer vision has gained attention for its widespread application in various study fields and industries.
Back in the 19th century, the concept of visual attention influences the field of cognitive psychology and neuroscience. Visual attention is defined as a mechanism that helps to overcome the human limitations by placing the limited available resources into the correct place at the right time with focus attention and set the mind into the right context [2]. Survey, observations, and experiments on how stimulus processed by human visual system, how human recognize pattern, how human attention work, and how the response is categorized or constructed, have been conducted by many cognitive psychologists and neuroscientists expert [3]–[11] in order to understand the human visual attention mechanism. Moreover, the development of biological and medical instruments, techniques and imagery such as Electroencephalograph (EEG), Magnetoencephalography (MEG), Positron Emission A R T I C L E I N F O A B S T R A C T
Article history
Received February 20, 2020 Revised March 10, 2020 Accepted March 14, 2020 Available online March 31, 2020
The philosophy of human visual attention is scientifically explained in the field of cognitive psychology and neuroscience then computationally modeled in the field of computer science and engineering. Visual attention models have been applied in computer vision systems such as object detection, object recognition, image segmentation, image and video compression, action recognition, visual tracking, and so on. This work studies bottom-up visual attention, namely human fixation prediction and salient object detection models. The preliminary study briefly covers from the biological perspective of visual attention, including visual pathway, the theory of visual attention, to the computational model of bottom-up visual attention that generates saliency map. The study compares some models at each stage and observes whether the stage is inspired by biological architecture, concept, or behavior of human visual attention. From the study, the use of low-level features, center-surround mechanism, sparse representation, and higher-level guidance with intrinsic cues dominate the bottom-up visual attention approaches. The study also highlights the correlation between bottom-up visual attention and curiosity.
This is an open access article under the CC–BY-SA license.
Keywords Visual attention Bottom-up attention Saliency map Computer vision Curiosity
Tomography (PET), functional Magnetic Resonance Imaging (fMRI), single-cell recording and neuronal tracing allow new and more detailed experiments to prove and to validate the hypothesis of human visual attention.
Human visual attention is observed based on its behavior and mechanism in processing visual stimuli also by investigating the visual pathway and the neuron activity in the primary visual cortex and beyond. The observation leads to the most influential biological inspired computational model of visual attention
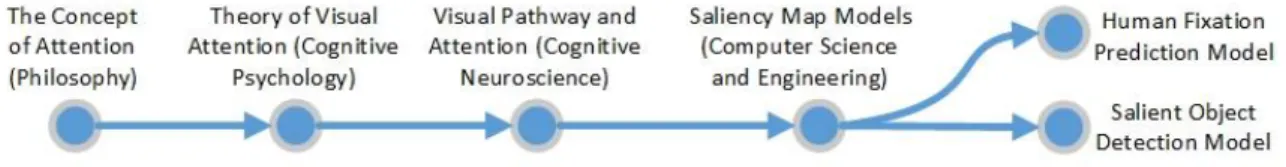
[12][13]. The model adopts the bottom-up mechanism of human visual attention that tends to shift the attention towards salient locations in the visual field. Saliency is defined as the degree of a spatial location to attract attention in a bottom-up manner. The saliency value can be triggered either by unique color, intensity, orientation or motion. The bottom-up visual saliency model then can be divided into human fixation prediction model and salient object detection model. Fig. 1 shows the history of bottom-up visual attention studies from the concept of attention to the computational saliency map models.
Fig. 1.The study of bottom-up visual attention.
But why do we need to study human visual attention? What biological model that inspires the computational model of bottom-up visual attention? What is the advantage of modeling the bottom-up visual attention? To what extent the computational model of bottom-up visual attention has been developed? Those are the important questions that will be covered in this preliminary study, along with our focus of study that investigate and highlight the biologically-inspired bottom-up visual attention model and its future development. The overview of bottom-up visual attention model will be explained in the next sections that organized as follow. Section 2 presents the visual pathway and visual attention in biological perspective. Section 3 presents the cognitive psychology theory of human visual attention. Section 4 presents the bottom-up saliency map models. Section 5 presents the discussion of the future development of bottom-up visual attention model. The conclusion of this work is described in Section 6.
2.
Visual Pathway
This section will briefly overview the visual pathway and highlight the points that later will influence the computational model of visual attention. The present biological instruments allow researchers to observe the human visual system and construct the visual pathway (the illustration of visual pathway can be seen in Aminoff [14]). Visual stimuli begin when the lights fall into the retina photoreceptors. The lights trigger photochemical reactions in rods and cones at the back of the retina. The rods are sensitive to light while the cones are sensitive to color. There are three types of color reception, namely long wavelength (L), middle wavelength (M), and short wavelength (S) cones, which sensitive to red, green, and blue spectrums respectively.
As mention in Frintrop [15] that referred to Palmer [16], the outputs of three types of cones produce color opponency. The red-green contrast is produced from the excitatory output of L-cones combined with the inhibitory output of M-cones, hence the equation is (𝐿 − 𝑀) and the green-red contrast is produced by (𝑀 − 𝐿). The blue-yellow contrast is produced from the excitatory output of S-cones combined with the sum of the inhibitory output of M and L-cones (𝑆 − (𝑀 + 𝐿)) and the yellow-blue contrast is produced by ((𝑀 + 𝐿) − 𝑆). Luminance contrast is produced from the sum of the excitatory output (𝑆 + 𝑀 + 𝐿) or the inhibitory output (−𝑆 − 𝑀 − 𝐿) of S, M and L-cones. In the retina, there is a unique structural arrangement of photoreceptors. The density of photoreceptors decreases rapidly from the fovea into the retinal periphery. This creates an efficient visual field area where small central area describes detail with high resolution while the lateral region covers large visual area with low
resolution [17]. This center-surround mechanism of receptive field and the color opponency of photoreceptors are adopted by some visual attention models that will be described in the later section.
The signals from approximately 65 million photoreceptors per eye that goes through only ten million of bipolar cells indicate that parallel processing occurs from the densely clustered receptors at the fovea
[18]. Additionally, there are approximately ten different types of bipolar cells that indicate parallel processing also happen at the retina i.e. between the cone cells and bipolar cells [19]. The evidence of parallel processing also presents in the ganglion cells. There are approximately 20 different types of ganglion cells that act as parallel filters to encode the different aspects of the visual field [19]. The facts that parallel processing happen in low-level vision and also followed by the result of human reaction time in the cognitive psychological test for visual attention, parallel processing then considered becoming one of the characteristics of bottom-up visual attention.
The photoreceptors send input for ganglion cells through the bipolar cells indirectly. The ganglion cells receptive fields composed of rods and cones input and separated into a center area and a surround area. The receptive field arranged into on-centers/off-surround cells and off-center/on-surround cells. The response of the on-center cells increases when the light falls at the center while the response of the off-center cells decreases when the light falls at the center so the two areas always have the opposite characteristic. Ganglion cells project their axons that converged into optic nerve to a different layer of Lateral Geniculate Nucleus (LGN). The LGN consists of several layers namely Parvocellular layers (P), Magnocellular layers (M), and Koniocellular layers (K). The projecting axons of the ganglion cells that carry the data of high spatial resolution, color perception, and stereopsis will be processed at the parvocellular (P) layers while the ones that carry encoded data from receptors that respond to moving stimuli will be processed at the magnocellular (M) layers [18]. Some portions of signal from ganglion cells are projected to the superior colliculus. Superior colliculus is involved in the visual orientation and generation of rapid eye movements or saccades that used to shift the gaze to objects interest in the different parts of the visual field after receiving the input that mainly from primary visual cortex (V1)
[9][20].
The visual input from LGN is transmitted to M-P related sub-layer and modules in primary visual cortex (V1). From V1, the P-input is fed to the ventral stream and the M-input is fed to the dorsal stream. Ventral stream receives input mainly chromatics stimuli that go through P-system that handles shape, texture, color, pictorial detail, and size to identify object (the “what” pathway). Dorsal stream receives input mainly luminance stimuli that go through M-system that handles location, movement/motion, spatial transformation, spatial relations, and attention to perform spatial vision (the “where” pathway) [19]. In early attention, spatial attention modulates input solely according to their location regardless of their identity. This characteristic is adopted to the salient object detection which identity of the object is not considered important.
It is still under debate where the attention effect happens in visual pathway. It has been known that the neural activity which correlates to visual attention appear in nearly all brain area that associated with visual processing. Different statements are made by the researchers about the location that suspected similar to saliency map e.g. at the Frontal Eye Field (FEF), Lateral IntraParietal area (LIP), Superior Colliculus (SC), or V4. Evidence also stated that the saliency map is in V1 [21]. Several areas have been verified to be involved in visual attention process but the behavior and task of each area as well as the correlation between the area are not yet determined [15].
Visual pathway is one of the major contributions to understand the human visual attention. The other major contribution comes from the theory of human visual attention that will be described in the next section.
3.
Theory of Visual Attention
At the beginning of psychological studies on visual attention, there are two distinctive attention processes namely overt attention and covert attention. In the visual attention context, overt attention is the change in posture to prepare receptors for expected visual input such as eye movements and the
change of pupil size. Covert attention is the ability to catch regions from the visual field that not fixated by the eyes. From this mechanism, the eye movement can be divided into fixation, saccades, and smooth pursuit. Visual attention is useful to overcome the bottleneck of information that happens in the visual pathway by selecting, ignoring, or deleting the information. The example of information deletion is inattentional blindness that blind everything except one aspect of the scene that we pay attention to
[22]. A behavior when we fail to notice the changes in the environment called change blindness [23]. The early study of visual attention behaviors concludes some theories as follows.
3.1.Selective and Divided Attention
The visual attention allows only a small part of the visual input to reach the short-term memory and visual awareness. Therefore, resulting in less computation and localized visual analysis problems. There some kinds of attention based on the focus of cognitive resources to achieve attentive task namely focus attention, sustained attention, alternating attention, selective attention and divided attention [24]. Focus attention focus on specific stimuli or tasks. Sustained attention maintains consistent responses on a longer continuous task. Alternating attention switches between multiple tasks. The idea that there are limits on the number of the scene that we can pay attention to is known as selective attention. Selective attention allows the attention to focus on one thing while ignoring the other [25]. But how we can still perform more than one task at a time? The question leads to divided attention theory that considers the limited cognitive resources and the complexity of the tasks. The attention can be divided to handle more tasks as long as the resources are sufficient. When the resources become insufficient, the divided attention mechanism allocates the resources to a certain task even though some other tasks may suffer. The performance on a task will decline if the resources exceed the pool capacity.
3.2.Bottom-up and Top-down Mechanism
Visual attention can be attracted by salient stimuli that pop-out from the surrounding. Attention can be directed to the objects that currently important to the observer. According to Pessa [26] and Connor et al. [27], the bottom-up mechanism operates rapidly on raw sensory input and involuntarily shifting the attention to salient visual features while top-down mechanism implements longer cognitive strategies, biasing attention towards importance spot with a specific task. The top-down mechanism also called task-driven, goal-directed, voluntary, non-reflexive, and endogenous e.g. directed attention to find a specific object or to look at the specific location. The bottom-up mechanism also called stimulus-driven, goal-independent, involuntary, reflexive, and exogenous e.g. although a task has been given to direct the attention but it can be automatically averted when a salient stimulus attracts the attention.
Experiment to analyze the correlation between bottom-up and top-down mechanism conducted by comparing the response time of subject toward given stimulus. The evidence of top-down mechanism can be seen in the control of the attentional focus location (space-based and object-based attention) while the bottom-up mechanism is parallel and pre-attentive relative to single visual feature such as color, orientation and state of motion (feature-based attention) [26]. Visual attention by top-down or bottom-up mechanism helps shorten the reaction time and increase the accuracy of task performance
[28][29].
3.3.Feature Integration Theory
The feature integration theory of Triesman and Gelade [4] states that only simple visual features are computed in a parallel manner over the entire visual field. The visual scene is assumed to be coded into separable representations/features such as color, orientation, spatial frequency, brightness, and movement. The theory based on Neisser [11] and Hoffman [30] that proposes two-stage models namely pre-attentive and attentive model. Pre-attentive model is spatially parallel, process the information in bottom-up manner, without attentional resources but lack of details. It produces a spatial features map. Attentive is serial, top-down controlled, processing spatial features map and visual search. Visual search refers to scanning the environment for particular features. A feature search happens when only a single feature is required to detect the target (“pop-out phenomenon”) while a conjunction search happens when two or more features must be used in conjunction to detect the target. In the conjunction search, attentional resources are used to perform feature binding to bind together the object features. According
to Treisman and Gelade [4], to ensure the correct synthesis of features in complex display, the stimulus location has to be processed along with focal attention. The focal attention binds the features that present in the same fixation of attention to form a single object.
3.4.Guided Search Theory
Guided search is the modification of the feature integration model of Treisman and Gelade [4]. The theory also based on Neisser [11] and Hoffman [30] that proposes pre-attentive and attentive models and the conjunction search from Egeth et al. [5]. According to Wolfe [31], guided search states that the early stages of visual system process all locations in parallel but only extract a limited amount of information from visual input. In the guided search theory, pre-attentive stage generates a spatial features map. Bottom-up activation measures the difference of value between features in a given location with the other features in the neighborhood location. Top-down activation marks the location given by the feature value to search the subject. The combination of both activations produces an activation map and directs the attention to a point with the highest activation.
4.
Bottom-Up Visual Saliency
The theory of saliency map also based on the pre-attentive and attentive model. Pre-attentive process generates a spatial saliency map. Saliency map is a map that associates each one of the different parts of a scene with a saliency value. Saliency map in the primary visual cortex (V1) corresponds to the highest neural firing rates that responded by superior colliculus to shift the gaze to that location [21]. The attentive process directs attentional focus to the different parts of a scene, following the order of saliency hierarchy. In short, saliency map is used to guide bottom-up selection to the most salient location regardless of features [12][13][31].
Excellent reviews of visual attention model are done by Borji et al. [32]–[34] and Riche et al. [35]. In order to validate and compare the models, researchers create saliency benchmark datasets e.g. MIT
[36], Toronto [37], Kootstra [38], MSRA10K [39], DUT-Omron [40], THUR15K [39], ImgSal [41], ECSSD [42] and so on. The datasets are created by recording eye fixation from several human subjects on a set of image using eye-tracking device. The device has mounted camera to track the eyes movement during experiments. The datasets contain annotated images to benchmark the models using evaluation measures such as Precision-Recall (PR), F-Measure, Receiver Operating Characteristics (ROC) curve, Area Under ROC Curve (AUC) score, and Mean Absolute Error (MAE) score [33].
The famous and influential models of saliency map proposed by Koch and Ullman [12] and Itti et al.
[13] are marked as the first wave in the computational visual attention study [34]. The models called human fixation prediction that predict the likelihood of human eye gaze. Numerous improvements [43]– [50] are proposed since then. The research on bottom-up visual attention model begins to shift to search salient object on the scene rather than predict the eye fixation, thus it is marked as the second wave called salient object detection model. The model is initiated by Liu et al. [39] and continuous improvements [51]–[56] have been made. Recently, the rising of deep learning influences the bottom-up salient object detection model into top-down or hybrid approach. The third wave is all about deep visual attention models that have been proposed by many researchers [57]–[65]. The deep visual attention models will not be covered in this preliminary study because the approach is not bottom-up but top-down approach using supervised learning or guided by object context.
4.1.Human Fixation Prediction Model
Itti et al. (IT) saliency map model [13] is based on the biologically-inspired saliency map architecture from Koch and Ullman [12], related to the features integration theory [4] and the guided search model
[31]. This biologically-driven visual attention model is reflected in the color perception, the feature maps, the center-surround mechanism, and the saliency map generation. In this model, early visual features such as color, intensity and orientation are decomposed from input color image using linear filtering. Aside from the benefit of easy to compute, color, intensity and orientation feature also the basic features that have been proposed in the psychological and biological study of visual attention. The color feature maps inspired by the color opponency produced by the retina photoreceptors. The
orientation features in 0°, 45°, 90° and 135° are extracted using Gabor filters. Gabor filters estimate the receptive field sensitivity characteristics (impulse responses) of orientation-selective neurons in V1 [66]. A set of scale made from Gaussian pyramids used to compute center–surround differences between fine-scale and coarse-scale for all feature types to generate a total of 42 feature maps. The center-surround mechanism that based on the Difference of Gaussian is inspired by the characteristics of visual neurons that most sensitive in a small region in the center of the visual field. This characteristic is good to detect locations which stand out from their surroundings and it is also a general computational principle in the retina, LGN, and V1 [66]. Normalization is performed to promote maps that have a small number of strong peak activity and suppress maps that have numerous comparable peaks response. A combination of each normalized feature maps generates single conspicuity map for each feature type. A linear combination sums the conspicuity maps into final saliency map. The winner-take-all scheme detects the point of highest salience in the map and focuses the attention towards that location. An inhibition-of-return mechanism temporarily suppresses the highest salient location in the saliency map in order to make the attention directed to the next most salient image location autonomously. This mechanism is inspired by the function of superior colliculus that controls eye movements in the visual pathway.
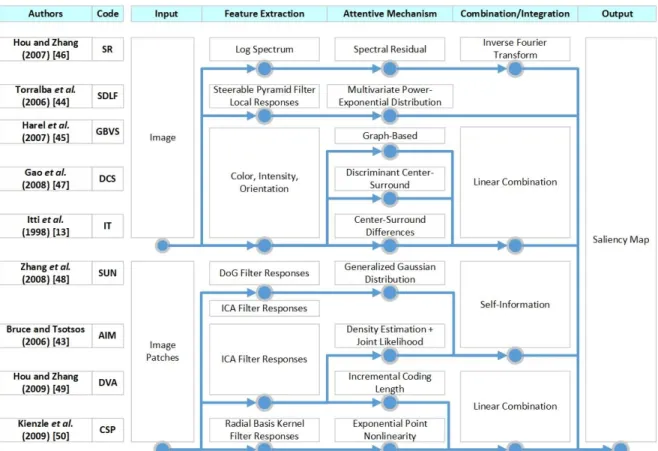
From the influential model of Koch and Ullman [12] and Itti et al. [13], many improvements and reviews have been done. The bottom-up visual saliency models can be grouped based on several characteristics namely 1) global or local approach where the models are applied to the entire image or local image patches, 2) post-processing procedure where the models highlights the center of saliency map by applying centered Gaussian bias, 3) attentive mechanism to generate the saliency map such as cognitive, graphical, spectral, information theory, Bayesian, pattern classification, decision theory, and other (see [32]), and 4) the visual input where the models use color or just grayscale [35]. In this study, the baseline models on each category based on the attentive mechanism are briefly presented. The biologically-inspired approach in the models will be highlighted to fit the purpose of our study. Fig. 2
shows the stages of bottom-up saliency map model namely visual input that divided into global or local, feature extraction stage, attentive mechanism stage, and combination/integration stage to produce saliency map. Most researchers use similar approach at one stage and different for the other stage. Therefore, this per-stage approach explanation is suitable to present the comparison and to identify the biological or mathematical model that inspiring the models.
Bruce and Tsotsos (AIM) [43] proposed saliency based on information maximization (AIM) [37]. The model that belongs to the information theory category uses a large sample of image patches generated from natural images to be fed into Independent Components Analysis (ICA) to learn a set of basis functions. These basis functions can be thought as the sparse representation of local neighborhoods. The work is inspired by the evidence that learning a sparse code from natural image results in the similar pattern of simple-cell receptive fields in V1. The sparse representation allows certain independence assumptions with respect to neural firing. The pseudoinverse of these basis functions is used in the matrix multiplication with any local neighborhood in the input image to generate a set of basis coefficients. Density estimation is used to create a coefficient distribution histogram followed by joint likelihood and Shannon’s self-information measure to generate saliency map.
Torralba et al. (SDLF) [44], introduced visual search based on Bayesian framework. The model belongs to the Bayesian model category. In this model, saliency is defined as probability finding a set of local features which considered salient if they are statistically distinguishable from the background. The model inspired by the human visual search behavior observed from several cognitive psychological tests and measurements. The model consists of two parallel pathway namely local features (saliency) and global features (scene-centered) computation. The bottom-up part is the computation of local features to generate saliency map. Each color channel in the input image is filtered by a set of biologically-inspired multiscale-oriented filters. To compute the saliency, the distribution of local features is modeled using multivariate power-exponential distribution. The conditional distribution then estimated by fitting the power-exponential distribution using local features of the current input image to compute saliency map.
Fig. 2.The comparison of each stage of human fixation prediction models.
Harel et al. (GBVS) [45] proposed Graph-Based Visual Saliency model (GBVS). The model belongs to the graphical model category. Input image is decomposed into feature maps as in Itti et al. [13] then generates the activation maps. The graph-based activation maps treat feature maps as a fully connected directed graph, assign the weight to its edges, normalizing the weights to create Markov chain and compute the equilibrium distribution. The authors claim that the graph-based and Markovian approach is biologically-inspired because nodes (neurons) exist in a retinotopically organized, connected network (the visual cortex), and able to communicate with each other (synaptic firing). The normalization step has the aim to concentrate mass on activation maps to highlights the conspicuity using a similar method as in the activation maps. The normalized maps are combined using a linear combination to form saliency map.
Hou and Zhang (SR) [46], propose saliency map model based on spectral residual. The model belongs to the spectral analysis model category. The model tried to simulate the pre-attentive behavior of human visual search rather than inspired by the biological structured of the human visual system. The log-spectrum is computed from down-sampled input image using Fast Fourier Transform (FFT). The spectral residual is computed by subtracting the log spectrum with the smoothed version of the log spectrum of the input image generated by convolving the log-spectrum with local average filter. The saliency map then constructed using Inverse Fast Fourier Transform (IFFT) in spatial domain.
Gao et al. (DCS) [47], introduce discriminant center-surround to estimate the visual saliency. The model belongs to the decision theory category. Input image is decomposed into color, intensity and orientation feature maps as in Itti et al. [13]. Discriminant center-surround is applied to the feature maps to generate feature saliency maps. The center-surround mechanism itself is inspired by the early stages of biological vision. Discriminant saliency is based on decision theory that consists of two classes namely stimuli of interest which is an observation within its neighborhood (center) and null hypothesis which is an observation within its surroundings (surround). The discriminant between center and surround is measured to generate feature saliency maps. A linear combination then applied to combine the feature saliency maps into saliency map.
Zhang et al. (SUN) [48], propose saliency map model based on Bayesian framework (SUN). The model belongs to the Bayesian model category. The model computes saliency map using two alternatives feature extraction methods namely Difference of Gaussians (DoG) as used in Itti et al. [13] and ICA as used in Bruce and Tsotsos [37][43]. Both features from DoG and ICA have been shown to be biologically-inspired, the DoG filters adopt center-surround mechanism that resembles the characteristics of visual neurons and also a general computational principle in the retina, LGN, and V1 while the ICA responses similar to the receptive fields of neurons in V1 and have sparsity property. Filter response maps on large samples of natural images are used to estimate the probability distribution over the observed values of each feature. The estimated distribution for each features then fitted into generalized Gaussian distribution. The bottom-up saliency map then computed by adding the sum of log probability (self-information) for all features maps with a constant.
Hou and Zhang (DVA) [49], introduced Incremental Coding Length (ICL) for dynamic visual attention model. The model belongs to the information theory category. As in Bruce and Tsotsos [43]
that inspired by the fact that receptive fields of simple cells in V1 produce a sparse representation, the work also uses a set of basis functions learned from large collection of natural image patches. The features are its filter response with the bank of filter functions obtained from the inverse basis functions which its activity is considered as a probability function. The ICL measures the entropy gains of each feature and optimizes the energy distribution to make the unexpected features receive high energy. The feature with large coding length increments determined as salient features. The activity of all features in the region is summed to generate the final saliency region.
Kienzle et al. (CSP) [50] investigate the most relevant image patterns that guide visual search in the bottom-up manner. The model belongs to the pattern classification category. The image patterns that called perceptive fields are analogous with receptive fields in human visual system but at the psychophysical level. The model tries to learn attention directly from eye-tracking data and proposes four distinct solutions of perceptive fields model that represent the most excitatory or inhibitory regions. The perceptive fields are just center-surround patterns of single spatial scale that analogous to receptive fields of neurons in early visual areas (LGN and V1). The input is linearly filtered by four kernels (four perceptive fields) then fed into an exponential operator along with the local signal energy from the image patch. The output signals are weighted according to their excitatory (positive) or inhibitory (negative) and summed into saliency value to generate saliency map.
The models explained previously are the baseline of each category (see [32]). The overview diagrams of each model can be seen in Riche and Mancas [35] and the comparison result with various eye fixation datasets can be found in [32]–[35]. Most of the models utilize biologically-inspired center-surround mechanisms in the retina, sparse representation in the V1, and low-level features in the early human visual system. The commonly used low-level features are color (from RGB channels, CIE Lab channels, or color opponency), intensity, and orientation from Gabor filters with multi-scale. The sparse representation adopted from the analysis of independent components from the local patch image using ICA. The center-surround mechanism usually computed as the difference between fine and coarse-scale. The later methods begin to see saliency as a probability model and optimization problem. The integration method also shifts from a linear combination that performs a weighted sum from each saliency map channel to find the highest probability of saliency value.
4.2.Salient Object Detection Model (SOD)
The salient object detection model searches for dominant objects from the background but still based on the low-level image processing algorithms without semantic object-level understanding. The model is inspired by the human subitizing ability to quickly count the number of objects within range accurately
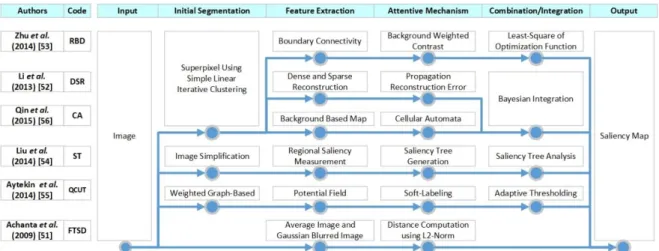
[67]. The salient object detection model detects the most salient object on the scene and segments the object boundary. The models are categorized based on cues namely salient object detection models with intrinsic cues or with extrinsic cues [34]. The cues are used to distinguish the salient objects from the distractors. Intrinsic cues extracted from the input image itself while the extrinsic cues come from outside the image such as user annotation, depth maps, or other statistical information. In this study, salient object detection with intrinsic cues is observed. The comparison at each stage of salient object
detection models is shown in Fig. 3. To achieve the purpose of this study, biological-inspired methods used in the salient object detection model are highlighted.
Fig. 3. The comparison of each stage of salient object detection models.
Achanta et al. (FTSD) [51] proposed frequency-tuned salient region detection (FTSD). The model adopts the biological concept of center-surround contrast which uses a frequency-tuned approach using color and luminance to estimate center-surround contrast. The L2-norm is calculated between Gaussian blurred input image and the average of CIE Lab input image. The method highlights the salient region using mean-shift segmentation algorithm followed by adaptive thresholding. The contribution of this work is keeping the saliency map resolution as the original image size.
Li et al. (DSR) [52] proposed saliency detection via dense and sparse reconstruction. The image boundaries are generated from superpixels at different scales using simple linear iterative clustering (SLIC). For each image region, the dense and sparse reconstruction errors are calculated to measure the saliency. A context-based error propagation method is used to smooth the reconstruction errors by applying k-means clustering. The saliency map is generated by integration of multi-scale reconstruction errors and refined by object-biased Gaussian model. The two saliency maps from dense and sparse reconstruction are integrated using Bayesian.
Zhu et al. (RBD) [53] proposed a robust background measure called boundary connectivity. The boundary connectivity is calculated from the ratio of boundary length and the squared root of its area. The boundary connectivity measurement of image region is obtained from soft segmentation by constructing an undirected weighted graph that connects the segmented region from superpixels using SLIC method. The background weighted contrast then calculated from the background connectivity. The saliency map is generated by minimizing the cost function from the optimization formula which involved background, foreground and smoothness.
Liu et al. (ST) [54] proposed saliency tree to estimate the saliency map. Input image is simplified using adaptive color quantization which quantizes the color into 16 number of bins and region segmentation which used globalized probability of boundary, oriented watershed transform and thresholded ultrametric contour map. The result is used to compute the initial regional saliency measurement which involves three measures namely global contrast, spatial sparsity and object prior. The saliency tree is a binary partition tree with saliency measures. A saliency tree analysis is performed via node selection criteria, salient node selection, regional saliency adjustment and selection, and finally, pixel-wise saliency map derivation.
Aytekin et al. (QCUT) [55] proposed automatic object segmentation by quantum cuts. The proposed quantum cuts algorithm is related to the graph-cuts algorithm. The quantum mechanical concept such as potential field, leads to the definition of probability density of particle occurrence in space which produces soft-labels indicating the foreground/background segmentation. To compute the saliency map, Hermitian matrix is constructed as a weighted graph structure, assigns the potential field,
computes the eigenvector with the smallest eigenvalue (ground state wavefunction) and computes the soft labeling vector. The saliency map then generated by adaptive thresholding over the soft labels.
Qin et al. (CA) [56] proposed a dynamic evolution model to detect saliency called cellular automata. Input image is segmented into small superpixels using SLIC. Global Color Distinction (GCD) map and Global Spatial Distance (GSD) are constructed to generate an initial background-based map. The Single-Layer Cellular Automata (SCA) is modified such as the state of each cell is derived from saliency value of each superpixel, the neighborhood term is extended to the adjacent cells that sharing boundaries (in case of Multi-Layer Cellular Automata (MCA), it expand to the different map with same location coordinate), and the influences of neighbor are related to the similarity between any pair of cells in color space. In order to accommodate the modification, impact factor matrix and coherence matrix are used. The saliency map is generated by updating the rule synchronously after some iterations. The MCA is used to integrate the saliency maps from different methods to enhance the final saliency map via Bayesian framework.
Salient object detection model search for salient objects from the background but without semantic object-level understanding. Some of the overview diagrams of each model can be seen in Riche and Mancas [35] and the comparison result with various salient object datasets can be found in [32]–[35]. From Fig. 3, most of the models adopt biological concepts and human visual attention behaviors such as how the attention responds to stimulus. Higher-level features with intrinsic cues usually used in this model such as center prior, global or local contrast, edge density, background prior, objectness prior, convexity prior, and so on. Most of the models perform initial segmentation via super pixels using SLIC. The integration stage uses an optimization method to find salient objects. Salient object detection is more complex rather than fixation prediction models because the saliency value need to capture the boundary to localize the objects.
5.
Discussion and Future Development
The characteristics of visual attention in bottom-up manner are stimulus-driven, goal-independent, involuntary, reflexive, and exogenous. The stimulus is raw sensory input and low-level features such as color, intensity, orientation, depth and motion. The features acquisition is possible because the technology becomes more supportive in providing more comprehensive information such as depth cue, inter-image correspondence, motion cue, and temporal relationship. The information allows the model to extend into RGBD saliency detection which uses depth information to detect salient regions, co-saliency detection which uses inter-image correspondence to find salient objects in image group, and video saliency detection which uses video-sequences to detect motion-related salient objects [68]. Sometimes low-level features are not enough to distinguish the objects from distractors and need higher-level features to highlight the targets and to suppress distractors. Higher-higher-level features with intrinsic cues are extracted from the image itself so it still considered as bottom-up process. However, the use of low or higher-level features in the models will raise a question, what features actually drive human visual attention?
Kümmerer et al. [69] investigate the low-level (contrast) and high-level (presence of objects) contribution in the fixation prediction models. The result shows similar responses between low-level intensity contrast features (ICF) model and high-level deep object features (DeepGaze II) model. The models perform best if fixation in a high-contrast region (ICF) or presence of object (DeepGaze II) and perform worst if there is a high-contrast region (ICF) or high-level content (DeepGaze II) that does not attract human fixation. However, the performance of high-level features significantly outperforms low-level features model when predicting human fixation. This indicates that high-low-level features (presence of objects) have more contribution in driven human visual attention.
Human visual attention is an excellent mechanism to quickly grasp important information from the visual field [70]. This mechanism helps human visual system (HVS) to cope with enormous information coming from the visual environment effortlessly with limited computational resources. By modeling visual attention mechanism, the computational process of computer vision system can be effective, fast
and smart to select important information and filter out irrelevant information. These characteristics are promising to be implemented in various applications. As mention in Borji et al. [33], the saliency detection model has been successfully applied in many areas such as object detection and recognition, image and video compression, video summarization, image quality assessment, image segmentation, image retrieval, gaze estimation, action recognition, visual tracking and so on.
In the field of artificial intelligence (AI) and intelligent robotics, visual attention becomes really important because it is closely related to curiosity especially the bottom-up approach. Curiosity is the gate of knowledge and visual attention helps to attain a certain important piece of knowledge among the infinite possible knowledge in the universe. According to Berlyne [71], curiosity is differentiated into perceptual curiosity which leads to increase the perception of stimuli and epistemic curiosity which leads to knowledge acquisition though it is closely related to each other. The human curiosity is related to the last one which is epistemic curiosity. This curiosity has a main feature that it aroused by strange or surprising situations or questions. That is, a certain piece of knowledge that attract visual attention is guaranteed to be new and strange or in the computational model of visual attention called salient. The relation between curiosity and visual attention has been studied since the curiosity theory [71] to the computational model of curiosity [72][73].
Curiosity is driven by rewards and uncertainty reduction based on novelty, salience, or surprise that make the AI agents learn [74]. Surprise proportionally correlated with curiosity, the more they surprise, the more they curious. Surprises (the “wow factors”) are triggered by how rare or informative the observation is. The strongest attractors are the stimuli that pop-out from the environment. From Itti and Baldi [75], surprises exist only in the presence of uncertainty and can only be related in a subjective manner. From those assumptions, the surprise attention is modeled based on Bayesian probability. The experiment also shows that human preferably more fixates to surprise location rather than high entropy regions, contrast, saliency, novelty or motion. The concept of surprise and curiosity has been implemented in intelligent robotics by White et al. [76]. The curiosity in artificial intelligence usually modeled into reinforcement learning because the learning emerges from the interaction between learners (AI agents) and the environment.
Agents are more curious about situations that they had intermediate confidence [71][74], not too novel and not too familiar. However, it might be different in the case of infant that see the world full of novelty. Infants may be the most curious learners that develop their own learning structure as they explore [77]. Infants also the best subject that implement bottom-up visual attention as they have only a little information (top-down) about the environment. The curiosity of infants mostly driven by intrinsic motivation (intrinsic rewards in the term of reinforcement learning). The input representation of infants mostly modeled using autoencoder networks which input and the output are the same. Autoencoder has been used in the computation of bottom-up saliency map model by Xia et al. [78]. Different from the traditional center-surround computation in the previous bottom-up saliency map models, the deep autoencoders use powerful feature learning and data reconstruction ability to construct center-surround inference network [78]. The idea is to use global data of the image to influence the local center-surround computation directly. By integrating global competition in sampling and learning processes into local center-surround contrast, the deep autoencoders model performs better than previous models that reconstruct the saliency map independently between global and local rarity.
6.
Conclusion
Human visual attention has a long history of work from the concept of visual attention (philosophy), the theory of visual attention (cognitive psychology), visual pathway and attention (biological perspective, neuroscience), to the computational model of visual attention (computer science and engineering). In this study, bottom-up visual attention models from fixation prediction to salient object detection are observed at each stage. The stage inspired by the biological structure and behavior of human visual attention is highlighted. From the observation, most of the models in bottom-up human fixation prediction inspired by center-surround mechanism in the retina, sparse representation in the V1, and low-level features in the early human visual system. Most of the models in bottom-up salient object
detection adopt biological concepts and human visual attention behaviors and use higher-level features with intrinsic cues. From the review, high-level features (presence of objects) are dominant in determining the visual attention location. The powerful mechanism of visual attention lets human visual system to cope with the enormous information from the visual environment effortlessly with limited computational resources. By modeling the visual attention, a computer vision system can greatly improve especially in an AI agent that implements curiosity. Curiosity allows an AI agent to learn new things from the environment and visual attention provides important information for the agent efficiently. In conclusion, we believe that the future development of artificial intelligent agents and computer vision system majorly contributed by curiosity and visual attention models.
References
[1] T. Huang, “Computer vision: Evolution and promise,” 1996, available at: Google Scholar.
[2] S. Tanimoto, A. Buizza, C. A. Marzi, M. Savini, and S. Vitulano, “Panel Summary Allocation of Attention in Vision,” in Human and Machine Vision, Boston, MA: Springer US, 1994, pp. 171–180, doi: 10.1007/978-1-4899-1004-2_12.
[3] A. L. Yarbus, Eye Movements and Vision. Boston, MA: Springer US, 1967, available at: Google Scholar. [4] A. M. Treisman and G. Gelade, “A feature-integration theory of attention,” Cogn. Psychol., vol. 12, no. 1,
pp. 97–136, Jan. 1980, doi: 10.1016/0010-0285(80)90005-5.
[5] H. E. Egeth, R. A. Virzi, and H. Garbart, “Searching for conjunctively defined targets,” J. Exp. Psychol. Hum. Percept. Perform., vol. 10, no. 1, pp. 32–39, 1984, doi: 10.1037/0096-1523.10.1.32.
[6] K. Nakayama and M. Mackeben, “Sustained and transient components of focal visual attention,” Vision Res., vol. 29, no. 11, pp. 1631–1647, Jan. 1989, doi: 10.1016/0042-6989(89)90144-2.
[7] J. Duncan and G. W. Humphreys, “Visual search and stimulus similarity,” Psychol. Rev., vol. 96, no. 3, p. 433, 1989, available at: Google Scholar.
[8] H. J. Müller and P. M. A. Rabbitt, “Spatial Cueing and the Relation between the Accuracy of ‘Where’ and ‘What’ Decisions in Visual Search,” Q. J. Exp. Psychol. Sect. A, vol. 41, no. 4, pp. 747–773, Nov. 1989, doi:
10.1080/14640748908402392.
[9] E. J. Tehovnik, W. M. Slocum, and P. H. Schiller, “Saccadic eye movements evoked by microstimulation of striate cortex,” Eur. J. Neurosci., vol. 17, no. 4, pp. 870–878, Feb. 2003, doi: 10.1046/j.1460-9568.2003.02489.x.
[10] X. Zhang, L. Zhaoping, T. Zhou, and F. Fang, “Neural Activities in V1 Create a Bottom-Up Saliency Map,” Neuron, vol. 73, no. 1, pp. 183–192, Jan. 2012, doi: 10.1016/J.NEURON.2011.10.035.
[11] U. Neisser, Cognitive Psychology. Psychology Press, 2014, available at: Google Scholar.
[12] C. Koch and S. Ullman, “Shifts in Selective Visual Attention: Towards the Underlying Neural Circuitry,” in Matters of Intelligence, Dordrecht: Springer Netherlands, 1987, pp. 115–141, doi: 10.1007/978-94-009-3833-5_5.
[13] L. Itti, C. Koch, and E. Niebur, “A model of saliency-based visual attention for rapid scene analysis,” IEEE Trans. Pattern Anal. Mach. Intell., vol. 20, no. 11, pp. 1254–1259, 1998, doi: 10.1109/34.730558.
[14] E. Aminoff, “Physiology – From Retina to V1 to High-Level Areas,” available at:
http://graphics.cs.cmu.edu/courses/16-899A/2014_spring/thevisualworld/3.pdf (accessed Jul. 14, 2019). [15] S. Frintrop, “Background on Visual Attention,” Springer, Berlin, Heidelberg, 2006, pp. 7–31, available at:
Google Scholar.
[16] S. E. Palmer, Vision science: Photons to phenomenology. MIT press, 1999, available at: Google Scholar. [17] L. Lombardi and M. Porta, “Log-Map Analysis,” in Visual Attention Mechanisms, Boston, MA: Springer
US, 2002, pp. 41–51, doi: 10.1007/978-1-4615-0111-4_4.
[18] U. Schiefer and W. Hart, “Functional Anatomy of the Human Visual Pathway,” in Clinical Neuro-Ophthalmology, Berlin, Heidelberg: Springer Berlin Heidelberg, 2007, pp. 19–28, doi: 10.1007/978-3-540-32708-0_3.
[19] C. A. Marzi, “Visual Attention And the Parallel Visual Pathways,” in Visual Attention Mechanisms, Boston, MA: Springer US, 2002, pp. 1–6, doi: 10.1007/978-1-4615-0111-4_1.
[20] M. D. Binder, N. Hirokawa, and U. Windhorst, Encyclopedia of neuroscience. Springer, 2009, avilable at:
Google Scholar.
[21] Z. Li, “A saliency map in primary visual cortex,” Trends Cogn. Sci., vol. 6, no. 1, pp. 9–16, Jan. 2002, doi:
10.1016/S1364-6613(00)01817-9.
[22] D. J. Simons, “Attentional capture and inattentional blindness,” Trends Cogn. Sci., vol. 4, no. 4, pp. 147– 155, Apr. 2000, doi: 10.1016/S1364-6613(00)01455-8.
[23] D. J. Simons and R. A. Rensink, “Change blindness: past, present, and future,” Trends Cogn. Sci., vol. 9, no. 1, pp. 16–20, Jan. 2005, doi: 10.1016/J.TICS.2004.11.006.
[24] M. Mancas, “What Is Attention?,” in From Human Attention to Computational Attention, Springer, New York, NY, 2016, pp. 9–20, available at: Google Scholar.
[25] A. M. Treisman, “Strategies and models of selective attention,” Psychol. Rev., vol. 76, no. 3, pp. 282–299, 1969, doi: 10.1037/h0027242.
[26] E. Pessa, “Bottom-Up and Top-Down Mechanisms,” in Visual Attention Mechanisms, Boston, MA: Springer US, 2002, pp. 61–68, doi: 10.1007/978-1-4615-0111-4_6.
[27] C. E. Connor, H. E. Egeth, and S. Yantis, “Visual Attention: Bottom-Up Versus Top-Down,” Curr. Biol., vol. 14, no. 19, pp. R850–R852, Oct. 2004, doi: 10.1016/J.CUB.2004.09.041.
[28] M. I. Posner, “Orienting of attention,” Q. J. Exp. Psychol., vol. 32, no. 1, pp. 3–25, Feb. 1980, doi:
10.1080/00335558008248231.
[29] M. Carrasco, “Visual attention: The past 25 years,” Vision Res., vol. 51, no. 13, pp. 1484–1525, Jul. 2011, doi: 10.1016/J.VISRES.2011.04.012.
[30] J. E. Hoffman, “A two-stage model of visual search,” Percept. Psychophys., vol. 25, no. 4, pp. 319–327, Jul. 1979, doi: 10.3758/BF03198811.
[31] J. M. Wolfe, “Guided Search 2.0 A revised model of visual search,” Psychon. Bull. Rev., vol. 1, no. 2, pp. 202–238, Jun. 1994, doi: 10.3758/BF03200774.
[32] A. Borji and L. Itti, “State-of-the-Art in Visual Attention Modeling,” IEEE Trans. Pattern Anal. Mach. Intell., vol. 35, no. 1, pp. 185–207, Jan. 2013, doi: 10.1109/TPAMI.2012.89.
[33] A. Borji, M.-M. Cheng, H. Jiang, and J. Li, “Salient Object Detection: A Benchmark,” IEEE Trans. Image Process., vol. 24, no. 12, pp. 5706–5722, Dec. 2015, doi: 10.1109/TIP.2015.2487833.
[34] A. Borji, M.-M. Cheng, Q. Hou, H. Jiang, and J. Li, “Salient object detection: A survey,” Comput. Vis. Media, vol. 5, no. 2, pp. 117–150, Jun. 2019, doi: 10.1007/s41095-019-0149-9.
[35] N. Riche and M. Mancas, “Bottom-Up Saliency Models for Still Images: A Practical Review,” in From Human Attention to Computational Attention, Springer, New York, NY, 2016, pp. 141–175, doi: 10.1007/978-1-4939-3435-5_9.
[36] T. Judd, K. Ehinger, F. Durand, and A. Torralba, “Learning to predict where humans look,” in 2009 IEEE
12th International Conference on Computer Vision, Sep. 2009, pp. 2106–2113, doi:
10.1109/ICCV.2009.5459462.
[37] N. D. B. Bruce and J. K. Tsotsos, “Saliency, attention, and visual search: An information theoretic approach,” J. Vis., vol. 9, no. 3, pp. 5–5, Mar. 2009, doi: 10.1167/9.3.5.
[38] G. Kootstra, A. Nederveen, and B. De Boer, “Paying attention to symmetry,” in British Machine Vision Conference (BMVC2008), 2008, pp. 1115–1125, available at: Google Scholar.
[39] Tie Liu et al., “Learning to Detect a Salient Object,” IEEE Trans. Pattern Anal. Mach. Intell., vol. 33, no. 2, pp. 353–367, Feb. 2011, doi: 10.1109/TPAMI.2010.70.
[40] C. Yang, L. Zhang, H. Lu, X. Ruan, and M.-H. Yang, “Saliency Detection via Graph-Based Manifold Ranking,” in 2013 IEEE Conference on Computer Vision and Pattern Recognition, Jun. 2013, pp. 3166–3173, doi: 10.1109/CVPR.2013.407.
[41] J. Li, M. D. Levine, X. An, X. Xu, and H. He, “Visual Saliency Based on Scale-Space Analysis in the Frequency Domain,” IEEE Trans. Pattern Anal. Mach. Intell., vol. 35, no. 4, pp. 996–1010, Apr. 2013, doi:
10.1109/TPAMI.2012.147.
[42] Q. Yan, L. Xu, J. Shi, and J. Jia, “Hierarchical Saliency Detection,” in 2013 IEEE Conference on Computer Vision and Pattern Recognition, Jun. 2013, pp. 1155–1162, doi: 10.1109/CVPR.2013.153.
[43] N. Bruce and J. Tsotsos, “Saliency based on information maximization,” in Advances in neural information processing systems, 2006, pp. 155–162, available at: Google Scholar.
[44] A. Torralba, A. Oliva, M. S. Castelhano, and J. M. Henderson, “Contextual guidance of eye movements and attention in real-world scenes: The role of global features in object search.,” Psychol. Rev., vol. 113, no. 4, pp. 766–786, Oct. 2006, doi: 10.1037/0033-295X.113.4.766.
[45] J. Harel, C. Koch, and P. Perona, “Graph-based visual saliency,” in Advances in neural information processing systems, 2007, pp. 545–552, available at: Google Scholar.
[46] X. Hou and L. Zhang, “Saliency Detection: A Spectral Residual Approach,” in 2007 IEEE Conference on Computer Vision and Pattern Recognition, Jun. 2007, pp. 1–8, doi: 10.1109/CVPR.2007.383267.
[47] D. Gao, V. Mahadevan, and N. Vasconcelos, “On the plausibility of the discriminant center-surround hypothesis for visual saliency,” J. Vis., vol. 8, no. 7, p. 13, Jun. 2008, doi: 10.1167/8.7.13.
[48] L. Zhang, M. H. Tong, T. K. Marks, H. Shan, and G. W. Cottrell, “SUN: A Bayesian framework for saliency using natural statistics,” J. Vis., vol. 8, no. 7, p. 32, Dec. 2008, doi: 10.1167/8.7.32.
[49] X. Hou and L. Zhang, “Dynamic visual attention: searching for coding length increments,” in Neural Information Processing Systems 2008 (NIPS 2008), 2009, pp. 681–688, Accessed: Jul. 29, 2019. [Online]. Available: Google Scholar.
[50] W. Kienzle, M. O. Franz, B. Scholkopf, and F. A. Wichmann, “Center-surround patterns emerge as optimal predictors for human saccade targets,” J. Vis., vol. 9, no. 5, pp. 7–7, May 2009, doi: 10.1167/9.5.7.
[51] R. Achanta, S. Hemami, F. Estrada, and S. Susstrunk, “Frequency-tuned salient region detection,” in 2009 IEEE Conference on Computer Vision and Pattern Recognition, Jun. 2009, pp. 1597–1604, doi: 10.1109/CVPR.2009.5206596.
[52] X. Li, H. Lu, L. Zhang, X. Ruan, and M.-H. Yang, “Saliency Detection via Dense and Sparse Reconstruction,” in 2013 IEEE International Conference on Computer Vision, Dec. 2013, pp. 2976–2983, doi:
10.1109/ICCV.2013.370.
[53] W. Zhu, S. Liang, Y. Wei, and J. Sun, “Saliency Optimization from Robust Background Detection,” in 2014 IEEE Conference on Computer Vision and Pattern Recognition, Jun. 2014, pp. 2814–2821, doi: 10.1109/CVPR.2014.360.
[54] Zhi Liu, Wenbin Zou, and O. Le Meur, “Saliency Tree: A Novel Saliency Detection Framework,” IEEE Trans. Image Process., vol. 23, no. 5, pp. 1937–1952, May 2014, doi: 10.1109/TIP.2014.2307434.
[55] C. Aytekin, S. Kiranyaz, and M. Gabbouj, “Automatic Object Segmentation by Quantum Cuts,” in 2014 22nd International Conference on Pattern Recognition, Aug. 2014, pp. 112–117, doi: 10.1109/ICPR.2014.29. [56] Yao Qin, Huchuan Lu, Yiqun Xu, and He Wang, “Saliency detection via Cellular Automata,” in 2015 IEEE Conference on Computer Vision and Pattern Recognition (CVPR), Jun. 2015, pp. 110–119, doi: 10.1109/CVPR.2015.7298606.
[57] V. Mnih, N. Heess, A. Graves, and others, “Recurrent models of visual attention,” in Advances in neural information processing systems, 2014, pp. 2204–2212, available at: Google Scholar.
[58] S. He, R. W. H. Lau, W. Liu, Z. Huang, and Q. Yang, “SuperCNN: A Superpixelwise Convolutional Neural Network for Salient Object Detection,” Int. J. Comput. Vis., vol. 115, no. 3, pp. 330–344, Dec. 2015, doi:
10.1007/s11263-015-0822-0.
[59] Guanbin Li and Y. Yu, “Visual saliency based on multiscale deep features,” in 2015 IEEE Conference on
Computer Vision and Pattern Recognition (CVPR), Jun. 2015, pp. 5455–5463, doi:
[60] J. Pan et al., “SalGAN: Visual Saliency Prediction with Generative Adversarial Networks,” Jan. 2017, Accessed: Jul. 26, 2019. [Online]. Available: http://arxiv.org/abs/1701.01081.
[61] Q. Hou, M.-M. Cheng, X. Hu, A. Borji, Z. Tu, and P. Torr, “Deeply Supervised Salient Object Detection with Short Connections,” in 2017 IEEE Conference on Computer Vision and Pattern Recognition (CVPR), Jul. 2017, pp. 5300–5309, doi: 10.1109/CVPR.2017.563.
[62] M. Li, S. S. Ge, and T. H. Lee, “Glance and Glimpse Network: A Stochastic Attention Model Driven by Class Saliency,” Springer, Cham, 2017, pp. 572–587, doi: 10.1007/978-3-319-54526-4_42.
[63] A. Ablavatski, S. Lu, and J. Cai, “Enriched Deep Recurrent Visual Attention Model for Multiple Object Recognition,” in 2017 IEEE Winter Conference on Applications of Computer Vision (WACV), Mar. 2017, pp. 971–978, doi: 10.1109/WACV.2017.113.
[64] W. Wang and J. Shen, “Deep Visual Attention Prediction,” IEEE Trans. Image Process., vol. 27, no. 5, pp. 2368–2378, May 2018, doi: 10.1109/TIP.2017.2787612.
[65] S. F. Dodge and L. J. Karam, “Visual Saliency Prediction Using a Mixture of Deep Neural Networks,” IEEE Trans. Image Process., vol. 27, no. 8, pp. 4080–4090, Aug. 2018, doi: 10.1109/TIP.2018.2834826.
[66] A. G. Leventhal, The Neural basis of visual function. CRC Press, 1991, available at: Google Scholar.
[67] E. L. Kaufman, M. W. Lord, T. W. Reese, and J. Volkmann, “The Discrimination of Visual Number,” Am. J. Psychol., vol. 62, no. 4, p. 498, Oct. 1949, doi: 10.2307/1418556.
[68] R. Cong, J. Lei, H. Fu, M.-M. Cheng, W. Lin, and Q. Huang, “Review of Visual Saliency Detection with Comprehensive Information,” IEEE Trans. Circuits Syst. Video Technol., pp. 1–1, 2018, doi:
10.1109/TCSVT.2018.2870832.
[69] M. Kummerer, T. S. A. Wallis, L. A. Gatys, and M. Bethge, “Understanding Low- and High-Level Contributions to Fixation Prediction,” in 2017 IEEE International Conference on Computer Vision (ICCV), Oct. 2017, pp. 4799–4808, doi: 10.1109/ICCV.2017.513.
[70] J. M. Wolfe and T. S. Horowitz, “What attributes guide the deployment of visual attention and how do they do it?,” Nat. Rev. Neurosci., vol. 5, no. 6, pp. 495–501, Jun. 2004, doi: 10.1038/nrn1411.
[71] D. E. Berlyne, “A Theory of Human Curiosity,” Br. J. Psychol. Gen. Sect., vol. 45, no. 3, pp. 180–191, Aug. 1954, doi: 10.1111/j.2044-8295.1954.tb01243.x.
[72] J. Gottlieb, P.-Y. Oudeyer, M. Lopes, and A. Baranes, “Information-seeking, curiosity, and attention: computational and neural mechanisms,” Trends Cogn. Sci., vol. 17, no. 11, pp. 585–593, Nov. 2013, doi:
10.1016/J.TICS.2013.09.001.
[73] Q. Wu and C. Miao, “Curiosity,” ACM Comput. Surv., vol. 46, no. 2, pp. 1–26, Nov. 2013, doi:
10.1145/2543581.2543585.
[74] J. Gottlieb, M. Lopes, and P.-Y. Oudeyer, “Motivated Cognition: Neural and Computational Mechanisms of Curiosity, Attention, and Intrinsic Motivation,” Emerald Group Publishing Limited, 2016, pp. 149–172, available at: Google Scholar.
[75] L. Itti and P. Baldi, “Bayesian surprise attracts human attention,” Vision Res., vol. 49, no. 10, pp. 1295– 1306, Jun. 2009, doi: 10.1016/J.VISRES.2008.09.007.
[76] A. White, J. Modayil, and R. S. Sutton, “Surprise and Curiosity for Big Data Robotics,” Work. Twenty-Eighth AAAI Conf. Artif. Intell., Jun. 2014, Accessed: Aug. 14, 2019. [Online]. Available: Google Scholar. [77] K. E. Twomey and G. Westermann, “Curiosity-based learning in infants: a neurocomputational approach,”
Dev. Sci., vol. 21, no. 4, p. e12629, Jul. 2018, doi: 10.1111/desc.12629.
[78] C. Xia, F. Qi, and G. Shi, “Bottom–Up Visual Saliency Estimation With Deep Autoencoder-Based Sparse Reconstruction,” IEEE Trans. Neural Networks Learn. Syst., vol. 27, no. 6, pp. 1227–1240, Jun. 2016, doi: