Contents lists available at ScienceDirect
Medical
Image
Analysis
journal homepage: www.elsevier.com/locate/media
ISLES
2015
-
A
public
evaluation
benchmark
for
ischemic
stroke
lesion
segmentation
from
multispectral
MRI
Oskar Maier
a,b,1,2,∗, Bjoern H. Menze
h,1,2, Janina von der Gablentz
c,1, Levin Häni
f,1, Mattias P. Heinrich
a,1,
Matthias Liebrand
c,1, Stefan Winzeck
h,1, Abdul Basit
p, Paul Bentley
k, Liang Chen
j,k, Daan Christiaens
t,u,v,
Francis Dutil
z, Karl Egger
m, Chaolu Feng
n, Ben Glocker
j, Michael Götz
s, Tom Haeck
t,u,v,
Hanna-Leena Halme
q,r, Mohammad Havaei
z, Khan M. Iftekharuddin
w, Pierre-Marc Jodoin
z,
Konstantinos Kamnitsas
j, Elias Kellner
l, Antti Korvenoja
q, Hugo Larochelle
z, Christian Ledig
j,
Jia-Hong Lee
y, Frederik Maes
t,u,v, Qaiser Mahmood
o,p, Klaus H. Maier-Hein
s, Richard McKinley
g,
John Muschelli
x, Chris Pal
A, Linmin Pei
w, Janaki Raman Rangarajan
t,u,v, Syed M.S. Reza
w,
David Robben
t,u,v, Daniel Rueckert
j, Eero Salli
q, Paul Suetens
t,u,v, Ching-Wei Wang
y, Matthias Wilms
a,
Jan S. Kirschke
i,1, Ulrike M. Krämer
c,d,1, Thomas F. Münte
c,1, Peter Schramm
e,1, Roland Wiest
g,1,
Heinz Handels
a,1,3, Mauricio Reyes
f,1,3aInstitute of Medical Informatics, University of Lübeck, Lübeck, Germany
bGraduate School for Computing in Medicine and Live Science, University of Lübeck, Germany cDepartment of Neurology, University of Lübeck, Germany
dInstitute of Psychology II, University of Lübeck, Germany
eInstitute of Neuroradiology, University Medical Center Lübeck, Germany
fInstitute for Surgical Technology and Biomechanics, University of Bern, Bern, Switzerland gDepartment of Diagnostic and Interventional Neuroradiology, Inselspital Bern, Switzerland
hInstitute for Advanced Study and Department of Computer Science, Technische Universität München, Munich, Germany iDepartment of Neuroradiology, Klinikum rechts der Isar, Technische Universität München, Munich, Germany jBiomedical Image Analysis Group, Department of Computing, Imperial College London, UK
kDivision of Brain Sciences, Department of Medicine, Imperial College London, UK lDepartment of Radiology, Medical Physics, University Medical Center Freiburg, Germany mDepartment of Neuroradiology, University Medical Center Freiburg, Germany
nCollege of Information Science and Engineering, Northeastern University, Shenyang, Liaoning, China oSignals and Systems, Chalmers University of Technology, Gothenburg, Sweden
pPakistan Institute of Nuclear Science and Technology, Islamabad, Pakistan
qHUS Medical Imaging Center, Radiology, University of Helsinki and Helsinki University Hospital, Helsinki, Finland rDepartment of Neuroscience and Biomedical Engineering NBE, Aalto University School of Science, Aalto, Finland sJunior Group Medical Image Computing, German Cancer Research Center, Heidelberg, Germany
tESAT/PSI, Department of Electrical Engineering, KU Leuven, Belgium uiMinds, Medical IT Department, KU Leuven, Belgium
vMedical Imaging Research Center, UZ Leuven, Belgium
wVision Lab, Department of Electrical and Computer Engineering, Old Dominion University, Norfolk, VA, USA xDepartment of Biostatistics, Johns Hopkins Bloomberg School of Public Health, Baltimore, MD, USA
yGraduate Institute of Biomedical Engineering, National Taiwan University of Science and Technology, Taipei City, Taiwan zUniversité de Sherbrooke, Sherbrooke, Qc, Canada
AEcole Polytechnique de Montréal, Canada
∗ Correspondingauthor.
E-mail address: [email protected](O.Maier).
1 Theseauthorsco-organizedthebenchmark.Allotherscontributedresults of
theiralgorithmsasindicatedintheappendix.
2 Theseauthorscontributedequally. 3 Theseauthorscontributedequally. http://dx.doi.org/10.1016/j.media.2016.07.009
a
r
t
i
c
l
e
i
n
f
o
Article history:Received24February2016 Revised30May2016 Accepted20July2016 Availableonline21July2016
Keywords: Ischemicstroke Segmentation MRI Challenge Benchmark Comparison
a
b
s
t
r
a
c
t
Ischemicstrokeisthemostcommoncerebrovasculardisease,anditsdiagnosis,treatment,andstudy re-liesonnon-invasiveimaging.Algorithmsforstrokelesionsegmentationfrommagneticresonanceimaging (MRI)volumesareintenselyresearched,butthereportedresultsarelargelyincomparableduetodifferent datasetsandevaluationschemes.WeapproachedthisurgentproblemofcomparabilitywiththeIschemic StrokeLesionSegmentation(ISLES)challengeorganizedinconjunctionwiththeMICCAI2015conference. Inthispaperweproposeacommonevaluationframework,describethepubliclyavailabledatasets,and presenttheresultsofthetwosub-challenges:Sub-AcuteStroke LesionSegmentation(SISS)and Stroke PerfusionEstimation (SPES).A totalof16 researchgroupsparticipatedwith awiderangeof state-of-the-artautomaticsegmentationalgorithms.Athoroughanalysis oftheobtaineddataenablesacritical evaluationofthecurrentstate-of-the-art,recommendationsforfurtherdevelopments,andthe identifica-tionofremainingchallenges.ThesegmentationofacuteperfusionlesionsaddressedinSPESwasfound tobefeasible.However,algorithmsappliedtosub-acutelesionsegmentationinSISSstilllackaccuracy. Overall,noalgorithmiccharacteristicofanymethodwasfoundtoperformsuperiortotheothers.Instead, thecharacteristicsofstrokelesionappearances,theirevolution,andtheobservedchallengesshouldbe studiedindetail.TheannotatedISLESimagedatasetscontinuetobepubliclyavailablethroughanonline evaluationsystemtoserveasanongoingbenchmarkingresource(www.isles-challenge.org).
© 2016ElsevierB.V.Allrightsreserved.
1. Introduction
Ischemic stroke is the most common cerebrovascular disease andoneofthemostcommoncausesofdeathanddisability world-wide (WHO,2012).Inischemic strokean obstructionofthe cere-bral blood supplycausestissue hypoxia (underperfusion)and ad-vancing tissue death over the next hours. The affected area of thebrain,thestrokelesion,undergoesanumberofdiseasestages that can be subdivided into acute (0-24h), sub-acute (24h-2w), andchronic (>2w) accordingtothe time passedsince stroke on-set (González et al., 2011). Magnetic resonance imaging(MRI) of the brainis oftenused to assessthe presence ofa stroke lesion, it’slocation,extent,age,andotherfactorsasthismodalityishighly sensitiveformanyofthecriticaltissuechangesobservedinstroke. Timeisbrainisthewatchwordofstrokeunitsworldwide. Pos-sibletreatmentoptionsarelargelyrestrictedtoreperfusion thera-pies(thrombolysis,thrombectomy),whichhavetobeadministered not laterthan fourto sixhoursaftertheonset ofsymptoms. Un-fortunately, theseinterventionsare associated withan increasing risk ofbleedingthelongerthelesionhasbeenunderperfused.To thisend, considerableefforthasgoneintofindingimage descrip-tors thatpredictstrokeoutcome (Wheeleretal.,2013),treatment response(Albersetal.,2006;Lansbergetal.,2012),orthepatients thatwouldbenefitfromatreatmentevenbeyondtheregular treat-mentwindow(Kemmlingetal.,2015).
At present, only a qualitative lesion assessment is incorpo-rated in the clinical workflow. Stroke research studies, which require quantitative evaluation, depend on manually delineated lesions. But the manual segmentation of the lesion remains a tedious and time consuming task, taking up to 15 min-utes per case (Martel et al., 1999), with low inter-rater agree-ment(Neumannetal.,2009).Developingautomatedmethodsthat locate, segment, and quantify the stroke lesion area from MRI scansremains an open challenge.Suitable imageprocessing algo-rithmscanbeexpectedtohaveabroadimpactbysupportingthe clinicians’decisionsandrendertheir predictionsmorerobust and reproducible.
Inthetreatmentdecisioncontext,anautomatic methodwould providethemedicalpractitionerswithareliableand,aboveall, re-produciblepenumbraestimation,basedonwhichquantitative de-cision procedurescanbe developedtoweightthetreatmentrisks against the potential gain. For medical trials, the results would become more reliable andreproducible, hence strengthening the finding and reducing the required amount of subjects for
credi-bleresults.Anotherbeneficiarywouldbecognitiveneuroscientists, who oftenperform studies wherecerebral injuries are correlated withcognitive function and forwhom lesion segmentation is an importantprerequisiteforstatisticalanalysis.
Still,segmentingstroke lesionsfromMRI imagesposesa chal-lengingproblem.First,thestrokelesions’appearancevaries signif-icantly over time, not only between buteven within theclinical phasesof stroke development. This holds especially true for the sub-acute phase, which is studied in the SISS sub-challenge: At the beginning of this interval, the lesion usually shows strongly hyperintense in the diffusion weighted imaging (DWI) sequence andmoderatelyhyperintenseinfluid attenuationinversion recov-ery (FLAIR).Towards the second week, the hyperintensity in the FLAIRsequenceincreaseswhiletheDWIappearanceconverges to-wards isointensity (González et al., 2011). Additionally, a ring of edemacan build upanddisappear again.In theacutephase, the DWIdenotestheinfarctedregionashyperintensity.Themagnitude of the actual underperfusion shows up on perfusion maps. The mismatchbetween these two is often considered the potentially salvageable tissue, termed penumbra(González et al., 2011). Sec-ond,strokelesionscanappearatanylocationinthebrainandtake on anyshape. They mayor may not be aligned withthe vascu-larsupplyterritoriesandmultiplelesionscanappearatthesame time (e.g.causedby an embolicshower).Some lesions mayhave radiioffewmillimeterswhileothersencompassalmostacomplete hemisphere. Third, lesion structures may not appear as homoge-neousregions;instead,theirintensitycanvarysignificantlywithin thelesionterritory.Inaddition,automaticstrokelesion segmenta-tioniscomplicatedbythepossiblepresenceofotherstroke-similar pathologies,suchaschronicstrokelesionsorwhitematter hyper-intensities(WMHs).Thelatteris especiallyprevalentinolder pa-tientswhichconstitutethehighestriskgroupforstroke.Finally,a goodsegmentationapproachmustcomplywiththeclinical work-flow. That means working with routinely acquired MRI scans of clinicalquality,copingwithmovement artifacts,imagingartifacts, theeffectsofvaryingscanningparametersandmachines,and pro-ducingresultswithintheavailabletimewindow.
1.1. Currentmethods
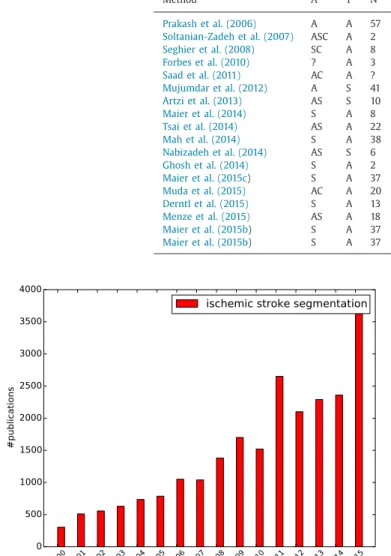
Thequantificationofstrokelesionshasgainedincreasing inter-est duringthe past years (Fig. 1). Nevertheless, only few groups havestartedtodevelopautomaticimage segmentationtechniques for this task in recent years despite the urgency of this prob-lem. A recent review of non-chronic stroke lesion
segmenta-Table1
Listingofpublicationsdescribingnon-chronicstrokelesionsegmentationinMRIwithevaluationon hu-manimagedatasinceRekiketal.(2012).ColumnAdenotesthelesionphase,i.e.,(A)cute,(S)ub-acute or(C)hronic.Column Tdenotesthemethod type,i.e.,(A)utomaticor(S)emi-automatic. ColumnN de-notesthe numberoftestingcases(mostlyleave-one-outevaluationscheme isemployed).Column Se-quencesdenotestheusedMRIsequences.ColumnDCdenotesthereportedDice’scoefficientscoreif avail-able.ColumnMetricsdenotesthemetricsusedintheevaluation.Abbreviationsare:V=visualevaluation, VE=volumeerror,PPV=positivepredictionvalue,+=othermetrics,m=medianreported.Notethatthe
lesionphaseswereadaptedtoourdefinitionifsufficientinformationwasavailable.
Method A T N Sequences DC Metrics
Prakashetal.(2006) A A 57 DWI 0.72 DC,+
Soltanian-Zadehetal.(2007) ASC A 2 T1,T2,DWI,PD +
Seghieretal.(2008) SC A 8 T1 0.64 DC
Forbesetal.(2010) ? A 3 T2,FLAIR,DWI 0.63 DC
Saadetal.(2011) AC A ? DWI V
Mujumdaretal.(2012) A S 41 DWI,ADC 0.81 DC
Artzietal.(2013) AS S 10 FLAIR,DWI ASSD,HD,VE
Maieretal.(2014) S A 8 T1,T2,FLAIR,DWI,ADC 0.74 DC,ASSD,HD
Tsaietal.(2014) AS A 22 DWI,ADC 0.9 DC,PPV
Mahetal.(2014) S A 38 T2,DWI 0.73 DCm,+
Nabizadehetal.(2014) AS S 6 DWI 0.80 DC,+
Ghoshetal.(2014) S A 2 ADC VE
Maieretal.(2015c) S A 37 T1,T2,FLAIR,DWI,ADC 0.63 DC,ASSD,HD
Mudaetal.(2015) AC A 20 DWI 0.73 DC
Derntletal.(2015) S A 13 T1,T1c,T2,FLAIR 0.42 DC
Menzeetal.(2015) AS A 18 T1,T1c,T2,FLAIR,DWI 0.78 DC
Maieretal.(2015b) S A 37 FLAIR 0.44-0.67 DC,ASSD,HD
Maieretal.(2015b) S A 37 T1,T2,FLAIR,DWI,ADC 0.54-0.73 DC,ASSD,HD
Fig.1. IncreasingcountofpublicationsovertheyearsasreturnedbyGooglescholar forthesearchterms ischemic stroke segmentation on2016-05-17.
tion(Rekiketal.,2012)summarizesthemostimportantworks un-til2008,reportingasfewasfiveautomatedstrokelesion segmen-tationalgorithms.A collectionofmore recentapproachesnot in-cludedinRekiketal.(2012)arelistedinTable1.Whilean increas-ingnumberofautomatic solutionsarepresented,therearealsoa numberofsemi-automaticmethodsindicatingthedifficultyofthe task.Amongtheautomaticalgorithms, onlyafewemploypattern classificationtechniquestolearnasegmentationfunction(Prakash etal.,2006;Maieretal., 2014;2015c)ordesignprobabilistic gen-erativemodelsofthelesionformation(Derntletal.,2015;Menze etal., 2015; Forbes et al., 2010; Kabir et al., 2007; Martel etal., 1999).
While all approaches make an effort to quantify segmenta-tion accuracies, most lack detailed descriptions of the employed dataset,whichis acritical matteras strokelesionshape and ap-pearancechanges rapidlyduringthefirst hours anddays, signifi-cantlyalteringthedifficultyofthesegmentationtask.Information
about the stroke evolution phase is sometimes omitted (Seghier et al., 2008; Forbes et al., 2010) or, if mentioned, not clearly defined (Saad et al., 2011; Muda et al., 2015). Where provided, the definition of acute stroke often mixes with the sub-acute phase(Ghoshetal.,2014;Mahetal.,2014;Tsaietal.,2014).Onlya fewstudiesgivedetailsonpathologicalinclusionandexclusion cri-teriaofthedata(Jamesetal.,2006;Maieretal.,2015c),although these are important characteristics: Results obtained on right-hemisphericstrokeonly(Dastidaretal.,2000)arenotcomparable toonesomittingsmalllesions(Mahetal., 2014)nortothose ob-tainedfromtwocentralaxialslicesofeachvolume(Lietal.,2004). Comparabilityisfurtherimpededbyawiderangeofdatasetsizes (N∈[2,57]),employedMRIsequencesandquantitativeevaluation measures.Allthisrenderstheinterpretationoftheresultsdifficult andexplainsthe wide rangeofsegmentation accuraciesreported overtheyears.Averyrecentwork (Maieretal.,2015b)compares a number of classification algorithms on a common dataset,but thesedonot fullyrepresentthe state-of-the-artnorare they im-plementedbytheirrespectiveauthors.
Inthepresentbenchmarkstudy,weapproachtheurgent prob-lemofcomparability.Tothisend,weplanned,organized,and pur-sued the Ischemic Stroke LEsion Segmentation (ISLES) challenge: A direct, fair, and independently controlled comparison of auto-matic methods on a carefullyselected public dataset. ISLES2015 wasorganizedasa satelliteeventoftheInternationalConference onMedicalImageComputingandComputerAssistedIntervention (MICCAI)2015,heldinMunich,Germany.ISLEScombinedtwo sub-challengesdealingwithdifferentphasesofthestroke lesion evo-lution:First,theStrokePerfusionEStimation(SPES)challenge deal-ing with the image interpretation of the acute phase of stroke; second, the Sub-acuteIschemicStrokelesion Segmentation (SISS) challenge dealing with the later stroke image patterns. In both taskswe aimatanswering a numberofopen questions:What is thecurrentstate-of-the-artperformanceofautomaticmethodsfor ischemicstrokelesionsegmentation?Whichtypeorclassof algo-rithmsismostsuitedforthetask?Whichdifficultiesareovercome andwhichchallengesremain?Andwhataretherecommendations wecan givetoresearchersinthefield aftertheextensive evalua-tionconducted?
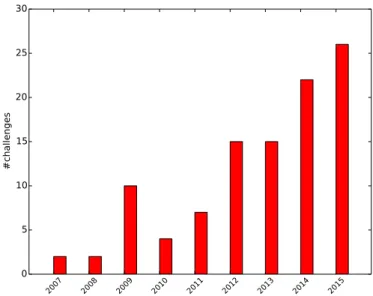
Fig. 2. Increasing count of challenges over the years as collected on http:// grand-challenge.orgon2016-05-17.
2. SetupofISLES
Imagesegmentationchallengesaimatanindependentandfair comparisonofvarioussegmentation methodsforagiven segmen-tationtask.Inthesede-factobenchmarksparticipantsarefirst pro-vided with representative training data with associated ground truth, on which they can adjust their algorithms. Later, a testing dataset without ground truth is distributed and the participants submittheirresultstotheorganizers,whoscoreandrankthe sub-missions.
Previouschallengesinthemedicalimageprocessing communi-ties dealt with the segmentation of tumors (Menze et al., 2015) or multiple sclerosis lesions (Styner et al., 2008) in MRI brain data; complete lungs (Murphy, 2011) or their vessels (Rudyanto et al., 2014) in computed tomography scans; 4D ventricle ex-traction (Petitjean et al., 2015) as well as myocardial tracking and deformation (Tobon-Gomez et al., 2013); prostate segmen-tation from MRI (Litjens et al., 2014); and brain extraction in adults(Shattucketal.,2009)andneonatals(Išgumetal.,2015).
The number of challenges has been steadily increasing over the past years (Fig. 2) as visible fromthe eventslisted on http: //grand-challenge.org. Many of these have become the de-facto evaluation standard for new algorithms, in particular when ad-hering tosome standardslisted on thesame web resource: Both training and testing dataset are representative for the task, well described, andlarge enough todraw significant conclusionsfrom theresults; theassociatedgroundtruthiscreatedby experts fol-lowingaclearlydefinedsetofrules;theevaluationmetricschosen captureallaspectsrelevantforthetask;and,ideally,challenges re-mainopen forfuturecontestantsandserveasanongoing bench-markforalgorithmsinthefield.
WithISLES 2015,we introduce forthefirst timea benchmark forthegrowingbutinaccessiblecollectionofstrokelesion segmen-tation algorithms. The challenge was launched in February 2015 andpotentialparticipantswerecontacteddirectlyfollowingan ex-tensive literature review on stroke segmentation or via suitable mailinglists.ThetrainingdatasetsforSISSandSPESwerereleased in April 2015 using the SICAS Medical Image Repository (SMIR) platform4(Kistleretal.,2013).Theparticipantswereableto down-loadthetestingdatasetsfromSeptember14,2015,andhadto
sub-4www.smir.ch
mittheir resultswithina week.Thegroundtruth forthissecond setiskeptprivatewiththeorganizers.Repeatedsubmissionswere allowed, butonly thelast one counted.The organizersevaluated thesubmittedresultsandpresentedthemduringafinalworkshop atthe internationalMICCAIconference 2015inMunich,Germany. Allconclusionspresentedinthispaperaredrawnfromthese test-ingresults.
We refrained from an on-site evaluation as previous at-tempts (Murphyet al., 2011; Menze et al., 2015; Petitjean etal., 2015) have shownthat such endeavors maybe prone to compli-cations unrelatedto theactual algorithms’ performances.Instead, theresults obtainedon the evaluationset were hiddenfrom the participantstoavoidtuningonthetestingdataset.
TheISLESbenchmarkisopen post-challengeforresearchers to continueevaluating segmentation performance through the SMIR evaluationplatform.The resultsandrankings oftheinitial partic-ipantsremainasafrozentableonthechallengewebpage5 while the SMIRplatform supplies an automatically generated listing of theseandallfutureresults.
Interestedresearch teams could register for one or both sub-challenges.Allsubmittedalgorithms wererequiredtobefully au-tomatic;no other restrictionswere imposed. Untilthe dayofthe challenge, the SMIRplatform listed over 120 registered users for the ISLES 2015 challenge anda similar count of training dataset downloads.Ofthese,14teamsprovidedtestingdatasetresultsfor SISSand 7 algorithms participated in SPES.Their affiliations and methodscanbefoundinTable2.Foradetaileddescriptionofthe algorithmspleaserefertoAppendixA.
3. Dataandmethods
3.1. SISSimagedataandgroundtruth
Wegathered64 sub-acuteischemic strokecasesforthe train-ingandtestingsetsoftheSISSchallenge.Atotalof56caseswere supplied by the University Medical Center Schleswig-Holstein in Lübeck,Germany. They were acquired indiagnostic routine with varyingresolutions,views,andimagingartifactload.Anothereight cases were scanned atthe Departmentof Neuroradiology at the Klinikum rechts der Isar in Munich, Germany. Both centers are equippedwith3TPhillipssystems.Thelocalethicscommittee ap-proved their release under Az.14-256A. Full data anonymization wasensuredbyremovingallpatientinformationfromthefilesand thefacialbonestructurefromtheimages.
Consideredforinclusionwere all caseswitha diagnosisof is-chemicstrokeforwhichatleastthe setofT1-weighted (T1), T2-weighted(T2),DWI(b=1000)andFLAIRMRIsequenceshadbeen acquired.Additional pathological deformation, such as, e.g., non-strokeWMHs,haemorrhages, orprevious strokes, didnot lead to the exclusion of a case. Scans performed outside the sub-acute strokedevelopmentphasewererejected.Astheexacttimepassed sincestrokeonsetisnot knowninmostcases,lesions were visu-allyclassifiedassub-acuteinfarctifapathologicsignalwasfound concomitantly in FLAIR and DWI images (presence of vasogenic andcytotoxic edema with evidence ofswelling due to increased watercontent).
In order to focus the analysis on the participating algo-rithms rather than assessing the preprocessing techniques em-ployed by each team, all cases were consistently preprocessed by the organizers: The MRI sequences are skull-stripped using BET2(Jenkinsonetal.,2005)withamanualcorrectionstepwhere required,b-spline-resampledtoanisotropicspacingof1mm3,and
Table2
ListofallparticipantsintheISLESchallenge.Allteamsarecolorcodedforeasier ref-erence inall further listings. The ML column denotes whether the submitted algo-rithmisbasedonmachinelearning.RefertotheSISSandSPEScolumnsfor the sub-challengeseachteamparticipatedin.Additionally,averyshortsummaryofeachmethod is provided.For adetaileddescription ofeach algorithmand used abbreviationssee
AppendixA.
Team FN SN ML SISS SPES
– UK-Imp1 Liang Chen Y Y
RegionalRFs(dorsal,medial,ventral)
– DE-Dkfz Michael Goetz Y Y
ImageselectorRF+onlinelesionET
– FI-Hus Hanna Halme Y Y
RF(deviationfromglobalaverage)+ContextualClustering(CC)
– CA-McGill Andrew Jesson Y Y
Localclassifiers(554GMM)+regionalRF
– UK-Imp2 Konstantinos Kamnitsas Y Y
2-path3DCNN+CRF
– US-Jhu John Muschelli Y Y
RF(e.g.SD,skew,kurtosis)
– SE-Cth Qaiser Mahmood Y Y
RF(e.g.gradient,entropy)
– US-Odu Syed Reza Y Y
RF(manyfeatures,e.g.,texture)
– TW-Ntust Ching-Wei Wang Y Y
RF(manyfeatures,e.g.,edge)
– CN-Neu Chaolu Feng N Y Y
Bias-correctingFuzzyC-Means+LevelSet
– BE-Kul1 Tom Haeck N Y Y
Tissuepriors+EM-optMRF+LevelSetonsequencesubset
– CA-USher Francis Dutil Y Y Y
2-path2DCNN
– DE-UzL Oskar Maier Y Y Y
RF(anatomicallyandappearancemotivatedfeatures)
– BE-Kul2 David Robben Y Y Y
CascadedETs
– DE-Ukf Elias Kellner N Y
Rule-basedhemisphere-comparingapproach
– CH-Insel Richard McKinley Y Y
RF(casebootstrappedforestofforests)
rigidlyco-registeredtotheFLAIR sequenceswiththeelastix tool-box(Kleinetal.,2010).
Acquired in a routine diagnostic setting andrepresenting the clinicalreality,thesedatasetsare afflictedby secondary patholo-gies, such as stroke similar deformations and chronic stroke le-sions,aswellasimagingartifacts,varyingacquisitionorientations, differingresolutions,ormovementartifacts.
In addition to the wide rangeof acquisition and clinically re-lated variety, the sub-acute lesions themselves display a wide range of variability (Table 3). Great care has been taken to pre-servethediversityofthestrokecaseswhensplittingthedatainto testingandtrainingdatasets: bothcontainsingle- andmulti-focal cases,smallandlarge lesions,and were dividedby further crite-ria(Table3).Themaindifferencebetweenthesetsistheaddition oftheeightcasesfromMunichtothetestingdatasetonly;hence, thissecondcenterdatawasnotavailableduringthetrainingphase (Table4).
All expert segmentations used inISLES were prepared by ex-periencedraters.ForSISS,twogroundtruthsets(GT01andGT02) werecreatedandthesegmentationswereperformedontheFLAIR sequence,whichis knownto exhibit lowerinter-rater differences
as,e.g.,T2(Neumannetal.,2009).Theguidelinesforexpertraters wereasfollows:
1. ThesegmentationisperformedontheFLAIRsequence 2. Othersequencesprovideadditionalinformation 3. Onlysub-acuteischemicstrokelesionsaresegmented 4. Partiallysurroundedsulci/fissuresarenotincluded
5. Very thin/small or largely surrounded sulci/fissures are in-cluded
6. Surroundedhaemorrhagictransformationsareincluded 7. Thesegmentationcontainsnoholes
8. Thesegmentation is exact butspatially consistent (no sudden spikesornotches)
Acute infarctlesions (DWIsignal forcytotoxic edemaonly, no FLAIRsignal forvasogenicedema)orresidualinfarctlesionswith gliosis and scarring after infarction (no DWI signal for cytotoxic edema,noevidenceofswelling)werenot included.Forthe train-ing, only GT01was madeavailable to the participants,while the testingdataevaluationtookplaceoverbothsets.
Table3
Strokelesioncharacteristicsofthe64SISScases.Thestrongdiversityis represen-tativeforstrokelesionsandemphasizesthedifficultyofthetask.μdenotesthe meanvalue,[min, max ]theintervaland n thetotalcount.Abbreviationsare: an-teriorcerebralartery(ACA),middlecerebralartery(MCA),posteriorcerebralartery (PCA)andbasilarartery(BA).
Lesioncount μ=2.46 [1,14] Lesionvolume μ=17.59ml [1.00,346.06] Haemorrhagepresent n 1=12 0=no,1=yes Non-strokeWMHload μ=1.34
0=none,1=small,2=medium,3=large Lesionlocalization(lobes) n 1=11,n 2=24,n 3=42,n 4=17,n 5=2,n 6=6
1=frontal,2=temporal,3=parietal,4=occipital, 5=midbrain,6=cerebellum
Lesionlocalization n 1=36,n 2=49
1=cortical,2=subcortical
Affectedartery n 1=6,n 2=45,n 3=11,n 4=5,n 5=0
1=ACA,2=MCA,3=PCA,4=BA,5=other Midlineshift n 0=51,n 1=5,n 2=0
0=none,1=slight,2=strong Ventricularenhancement n 0=38,n 1=15,n 2=3
0=none,1=slight,2=strong Laterality n 1=18,n 2=35,n 3=3
1=left,2=right,3=both
Table4
DetailsoftheSISSdata.
numberofcases 28trainingand36testing numberofmedicalcentres 1(train),2(test) numberofexpertsegmentationsforeachcase 1(train),2(test)
MRIsequences FLAIR,T2TSE,T1TFE/TSE,DWI
3.2. SPESimagedataandgroundtruth
AllpatientsincludedintheSPESdatasetweretreatedforacute ischemic stroke at theUniversity Hospital ofBern between2005 and2013. Patients included inthe datasetreceived the diagnosis of ischemic stroke by MRI withan identifiablelesion on DWI as wellasonperfusionweightedimaging(PWI),withaproximal oc-clusion ofthemiddle cerebralartery (MCA)(M1orM2 segment) documentedondigitalsubtractionangiography.Anattemptat en-dovasculartherapywasundertaken,eitherbyintra-arterial throm-bolysis(before2010)orbymechanicalthrombectomy(since2010). The patientshada minimumageof18 andtheimageswere not subjecttomotionartifacts.
ThestrokeMRIwasperformedoneithera1.5T(Siemens Mag-netom Avanto)or 3TMRI system(Siemens Magnetom Trio). The strokeprotocolencompassedwholebrainDWI(24slices,thickness 5mm,repetitiontime3200ms,echotime87ms,numberof aver-ages2,matrix256×256)yieldingisotropicb1000images.ForPWI the standard dynamic-susceptibility contrast enhanced perfusion MRI(gradient-echoecho-planarimagingsequence,repetition time 1410ms,echotime30ms,fieldofview230×230mm,voxelsize: 1.8 × 1.8× 5.0mm, slice thickness 5 mm,19 slices,80 acquisi-tions)wasacquired.PWIscanswererecordedduringthefirstpass of a standard bolus of 0.1 mmol/kg gadobutrol (Gadovist, Bayer Healthcare). Contrast medium was injected at a rate of 5 ml/s followed by a 20 ml bolus of saline at a rate of 5 ml/s. Perfu-sion mapswere obtainedby block-circularsingularvalue decom-positionusingthePerfusionMismatchAnalyzer (PMA,fromAcute StrokeImagingStandardizationGroupASIST)Ver.3.4.0.6.The arte-rial input function isautomatically determinedby PMA basedon histograms ofpeak concentration, time-to-peakand meantransit time.
Sequencesandderivedmapsmadeavailabletotheparticipants areT1contrastenhanced(T1c),T2,DWI,cerebralbloodflow(CBF),
Table5
DetailsoftheSPESdata.
Numberofcases 30trainingand20testing Numberofmedicalcentres 1
Numberofexpertsegmentationsfor eachcase
1
MRIsequences T1c,T2,DWI,CBF,CBV,TTP,Tmax
Table6
Strokelesioncharacteristicsofthe50SPEScases.Thecasesarerestricted toMCAstrokeeligiblefor cerebrovasculartreatment.μdenotesthemean value,[min, max ]theintervaland n thetotalcount.
Lesioncount μ=1
Notalwaysconnected,butsingleocclusionassource. Lesionvolume μ=133.21ml
[45.62,252.20] Affectedartery allMCA
Laterality n 1=22,n 2=28,n 3=0
1=left,2=right,3=both
cerebralbloodvolume(CBV),time-to-peak(TTP),andtime-to-max (Tmax)(Table5).
Forpreprocessing,all imageswererigidlyregisteredtotheT1c withconstantresolutionof2×2×2mmandautomatically skull-stripped(Baueretal.,2013). Thisresolutionwaschoseninregard tothelow1.8.8×5.0mmresolutionofthePWIimages.Together withtheremovalofallpatientdatafromthefiles,full anonymiza-tionwasachieved.
Todeterminetheeligibilityofapatient fortreatmentorto as-sess a treatment response in clinical trials, the pretreatment es-timation ofthe potentially salvageable penumbral area is crucial. A 6 second threshold applied to the Tmax map has been sug-gested(Strakaetal.,2010)andsuccessfullyappliedinlarge multi-centertrials (Lansberg et al., 2012) to determine the area of hy-poperfusion(i.e.penumbra+core).Butthisapproachrequiresthe manualsettingofaregionofinterestaswellasconsiderable man-ual postprocessing. For SPES, we are interested in whether ad-vancedsegmentation algorithms could replace manual correction ofthresholdedperfusionmaps,yieldingfasterandreproducible es-timationoftissueatriskvolume.
The hypoperfused tissue was segmented semi-manually with Slicer 3D Version 4.3.1 by a medical doctor with a preadjusted thresholdforTmaxof6seconds appliedto regionsof interestas described in Straka et al. (2010) andLansberg et al. (2012), fol-lowed by a manual correction step consisting in removing sulci, non-strokepathologiesandpreviousinfarctsbytakingintoaccount theotherperfusionmapsandanatomicalimages.Thelabel repre-sentsthe stroke-affectedregions withrestricted perfusion, which is the first requirement to determine the penumbral area via a perfusion-diffusionmismatchapproach.
The collected data therefore includes a variety of acute MCA cases(Table 6) that were split into trainingandtesting cases by anexperiencedneuroradiologistusingascriteriathecomplexityin visuallydefiningtheextentofthepenumbralarea.
The trainingdatasetis additionally equippedwitha manually created DWI segmentation ground truth set, which roughly de-notesthestroke’scorearea.Thesearenot consideredinthe chal-lenge.
3.3.Evaluationmetrics
As measures we employ(1) Dice’s coefficient (DC), which de-scribesthevolumeoverlapbetweentwosegmentationsandis sen-sitive to the lesion size; (2) the average symmetric surface dis-tance(ASSD),whichdenotestheaveragesurfacedistancebetween twosegmentations;and(3)theHausdorff distance(HD),whichis
Table7
SISSchallengeleaderboardafterevaluatingthe14participatingmethodsonthetesting dataset.The rank isthefinalmeasurefororderingthealgorithms’performancesrelative toeachother.The cases column denotesthe numberofsuccessfully(i.e.,allDC> 0) segmentedcases.Allevaluationmeasuresaregiveninmean±STD.Pleasenotethatthe ASSDandHDvalueswerecomputedexcludingthefailedcases(theydo,however,incur thelowestvacantrankforthesecases).Thethreenext-to-lastrowsdisplaytheresults obtainedwithdifferentfusionapproaches.Thelastrowshowstheinter-observerresults forcomparison.
Rank Method Cases ASSD(mm) DC[0,1] HD(mm)
3.25 – UK-Imp2 34/36 05.96±09.38 0.59±0.31 37.88±30.06 3.82 – CN-Neu 32/36 03.27±03.62 0.55±0.30 19.78±15.65 5.63 – FI-Hus 31/36 08.05±09.57 0.47±0.32 40.23±33.17 6.40 – US-Odu 33/36 06.24±05.21 0.43±0.27 41.76±25.11 6.67 – BE-Kul2 33/36 11.27±10.17 0.43±0.30 60.79±31.14 6.70 – DE-UzL 31/36 10.21±09.44 0.42±0.33 49.17±29.6 7.07 – US-Jhu 33/36 11.54±11.14 0.42±0.32 62.43±28.64 7.54 – UK-Imp1 34/36 11.71±10.12 0.44±0.30 70.61±24.59 7.66 – CA-USher 27/36 09.25±09.79 0.35±0.32 44.91±32.53 7.92 – BE-Kul1 30/36 12.24±13.49 0.37±0.33 58.65±29.99 7.97 – CA-McGill 31/36 11.04±13.68 0.32±0.26 40.42±26.98 9.18 – SE-Cth 30/36 10.00±06.61 0.38±0.28 72.16±17.32 9.21 – DE-Dkfz 35/36 14.20±10.41 0.33±0.28 77.95±22.13 10.99 – TW-Ntust 15/36 07.59±06.24 0.16±0.26 38.54±20.36 majorityvote 34/36 11.47±19.89 0.51±0.30 38.11±30.45 STAPLE 36/36 12.90±10.64 0.44±0.32 71.08±25.03 SIMPLE 34/36 07.83±14.97 0.57±0.29 29.40±28.11 inter-observer 36/36 02.02±02.17 0.70±0.20 15.46±13.56
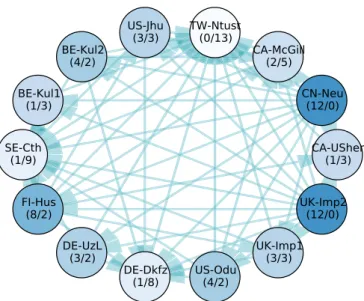
Fig.3. Significantdifferencesbetweenthe14participatingmethods’caseranks ac-cordingtoatwo-sidedWilcoxonsigned-ranktest(p <0.025).Eachnoderepresents ateam,eachedgeasignificantdifferenceofthetailsideteamovertheheadside team.Therefore,thelessoutgoingandthemoreincomingedgesateamhas (de-notedbynumbersinbrackets(#out/#in )foreasierinterpretation),theweakerits methodcomparedtothe others.Thesaturationofthe nodecolors indicatesthe strengthofamethod,wherebettermethodsarehighlightedwithmoresaturated colors.Notethatallteamswiththesamenumberofincomingandoutgoingedges perform,statisticallyspoken,equallywell.Ahigherimportanceofincomingover outgoingedgesorvice-versacannotbereadilyestablished.(Forinterpretationof thereferencestocolourinthisfigurelegend,thereaderisreferredtotheweb ver-sionofthisarticle.)
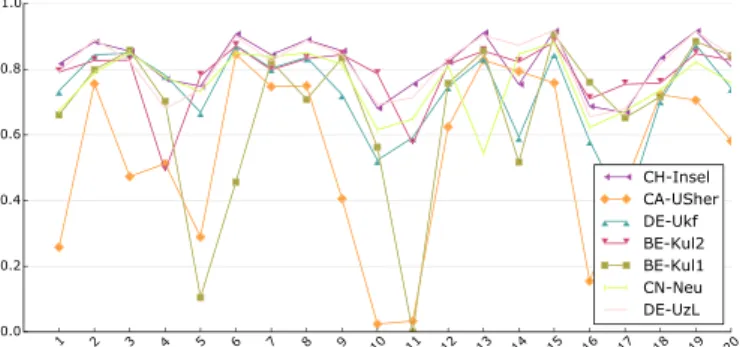
Fig.4. Adaptationtothedatafromthesecondmedicalcenter.Thegraphshows eachmethod’saverageDCscoresonthe28casesfromthefirstandtheeightcases fromthesecondmedicalcenter.Themethodsarecolorcoded.(Forinterpretation ofthereferencestocolourinthisfigurelegend,thereaderisreferredtotheweb versionofthisarticle.)
Fig.5. Differencesinperformanceonthetwogroundtruthsets.Thegraphshows eachmethodsaverageDCscoresonthe36testingdatasetcasesbrokendownby groundtruthset.A star(∗)beforea team’snamedenotesstatisticalsignificant
differenceaccordingtoapairedStudent’s t -testwith p <0.05.Themethodsare colorcoded.(Forinterpretationofthereferencestocolourinthisfigurelegend,the readerisreferredtothewebversionofthisarticle.)
Fig.6. Boxplotsofthe14teams’DCresultsonalltestingdatasetcases,i.e.,the firstboxwascomputedfromallteams’resultsonthefirstcase.Thebandinthe boxdenotesthe median,theupperandlowerlimitsthefirstandthirdquartile. Outliersareplottedasdiamonds.
ameasure ofthemaximumsurfacedistanceandhenceespecially sensitivetooutliers.
TheDCisdefinedas DC= 2
|
A∩B|
|
A|
+|
B|
(1)with A andB denoting the set ofall voxels ofground truth and segmentationrespectively.TocomputetheASSDwefirstdefinethe averagesurfacedistance(ASD),adirectedmeasure,as
ASD
(
AS,BS)
=
a∈ASminb∈BSd
(
a,b)
|
AS|
(2) andthenaverageoverbothdirectionstoobtaintheASSD
ASSD
(
AS,BS)
=ASD
(
AS,BS)
+ASD(
BS,AS)
2 (3)
HereAS andBSdenotethesurfacevoxelsofgroundtruthand seg-mentationrespectively.Similar,theHDisdefinedasthemaximum ofallsurfacedistanceswith
HD
(
AS,BS)
=max{
max a∈AS min b∈BS d(
a,b)
,max b∈BS min a∈AS d(
b,a)
}
(4)The distance measure d( · ) employed in both cases is the Eu-clideandistance,computedtakingthevoxelsizeintoaccount. 3.4. Ranking
Afterselectingsuitableevaluationmetrics,wefacetheproblem ofestablishingameaningfulrankingforthecompetingalgorithms asthedifferentmeasuresareneitherinthesamerangenor direc-tion.
Inthesimplestcase,metricsareevaluatedindividuallyand dif-ferent rankings are offered (Menze et al., 2015). But this would meanneglecting the aspectsrevealed bythe remaining measures andishenceabadchoiceformostchallenges.
A second approach taken by some challenges (Styner et al., 2008)istocomparetwoexpertsegmentationsagainsteach other. The resulting evaluationvaluesare then assumed toindicate the upperlimitandhencedenotethe100percentmarkofeach mea-sure. Newsegmentationsare thenevaluated andthe values com-paredtotheirrespective100percentmarks,resultingina percent-ageratingforeachmeasure.Drawbackisthatformeasurewithan infiniterange,suchastheASSD,onehastodefineanarbitraryzero percentmark.
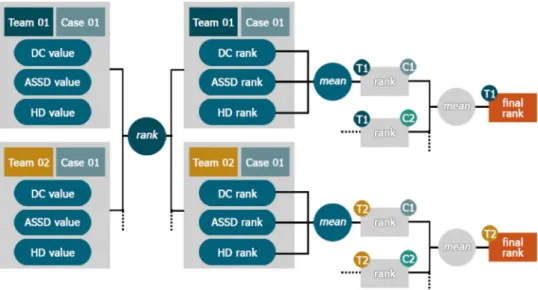
We chose a third approach based on the ideas ofMurphyetal.(2011)thatbuildson theconceptthat aranking reveals only the direction of a relationship between two items (i.e. higher, lower, equal) but not its magnitude. Basically, each participant’s resultsare rankedper caseaccordingto each ofthe three metrics and then the obtained ranks are averaged. For a moredetailedaccountseeAppendixB.
3.5.Labelfusion
The specific designof each automatic segmentation algorithm willresultincertainstrengthsandweaknessesforparticular chal-lenges in the present image data. Multiple strategies have been proposedinthepasttoautomaticallydeterminethequalityof sev-eral ratersor segmentation algorithms (Xu et al., 1992; Warfield et al., 2004; Langerak et al., 2010). These algorithms enable a suitable selection and/or fusion to best combine complementary segmentation approaches.Tostudyandcompensate thepotential varyingsegmentationaccuracyofallmethodsforindividualcases, we apply the following three popular label fusion algorithms to theirtestresults(seeTab7,bottom):First,majorityvote(Xuetal., 1992),which simplycountsthenumber offoregroundvotes over all classification results for each voxel separately and assigns a foregroundlabelifthisnumberisgreaterthanhalfthenumberof algorithms. Second, the STAPLE algorithm (Warfield et al., 2004), which performs a simultaneous truth and performance level es-timation, that calculates a global weight for each rater and at-tempts to remove thenegative influenceof pooralgorithms dur-ing majorityvoting. Third, theSIMPLE algorithm(Langeraketal., 2010), whichemploysa selectiveanditerativemethodfor perfor-mance level estimation by successively removing the algorithms with poorest accuracy as judged by their respective Dice score against a weighted majority vote, where the weights are deter-minedbythepreviouslyestimatedperformances.
4. Results:SISS
4.1. Inter-observervariance
Comparing the two ground truths of SISS against each other provides (1) the baseline above which an automatic methodcan be considered to produce results superior to a human rater and (2)a measureof thetask’sdifficulty (Table7, last row).The two expertsegmentationsoverlapatleastpartiallyforall cases. Com-paredtosimilartasks,such as,e.g.,braintumorsegmentation,for whichinter-observer DCvaluesof0.74± 0.13to 0.85± 0.08are reported(Menzeetal., 2015), theischemic strokelesion segmen-tationsproblemcanbe considereddifficultwithameanDCscore of0.70±0.20.
4.2.Leaderboard
The main result of the SISS challenge is a leaderboard for state-of-the-artmethods insub-acute ischemic stroke lesion seg-mentation (Table 7). The evaluation measures and ranking sys-tem employed are described in the method part of this article (Section3.4).Noparticipatingmethodsucceededinsegmentingall 36testingcasessuccessfully(DC>0)andthebestscoresarestill substantially below the human rater performance. Note that for all following experiments, we will focus on DC averages only as theASSDandHDvaluescannotbereadilycomputedforthefailed casesandarethusnotsuitableforadirectcomparisonofmethods withdifferingnumbersoffailurecases.
4.3.Statisticalanalysis
We performed a statistical analysis of the results to rule out random influences on the leaderboard ranking. Each pair of methods is compared with the two-sided Wilcoxon signed-rank test (Wilcoxon, 1945), a nonparametric test of the null hypothe-sis that two samples comefrom the samepopulation against an alternativehypothesis(Fig.3).
Thetwohighestrankingmethods,UK-Imp2andCN-Neu,show no statistically significant differences with a confidence of 95%
Fig.7. Visualresultsforselecteddifficult(10,17,23),easy(2,5,13),andsecondcenter(29,32)casesfromtheSISStestingdataset.Thefirstrowshowsthedistributionof all14submittedresultsonasliceoftheFLAIRvolume.Thesecondrowshowsthesameimagewiththegroundtruth(GT01)outlinedinred.Andthethirdrowshowsthe correspondingDWIsequence.Pleaserefertotheonlineversionforcolors.
(i.e. p < 0.025). No other algorithm performs better than them, andtheybothare betterthanthe12remainingones. Nextcomes a group of four methods (FI-Hus, BE-Kul2, US-Odu, De-UzL) to which only the two winners prove superior. But among these, FI-Hus takesthe highest positionas it is statisticallybetter than eightother methods,whiletheother threeonlyprovesuperiorto atmost fourcompetitors. The established leaderboard ranking is largelyconfirmedbythestatisticalanalysis.
4.4.Impactofmulti-centerdata
Casesacquiredatdifferentmedicalcenterscandiffergreatlyin appearance.Agoodautomaticstrokelesionsegmentationmethod shouldbeabletocopewiththesevariations.Webrokedowneach method’s results by medical center (Fig. 4) to test whether this holdstruefortheparticipatingalgorithms.
Since the trainingdataset contained only cases fromthe first center,the difference inperformance should reveal themethods’ generalization abilities. We observed that not a single algorithm reachedsecondcenterscorescomparabletoitsfirstcenterscores. Thisisastronghinttowardsadifficultadaptationproblem. 4.5.Combiningtheparticipants’resultsbylabelfusion
Applying the three label fusion algorithms presented in Section3.5leadtotheresultspresentedinTable7atthebottom. WefoundthattheSIMPLEalgorithmperformedbestandcould re-duceoutliersasevidentbyalowerHausdorff distance.Whenusing majorityvotingorSTAPLE,thenegativeinfluenceofmultiplefailed segmentationsthatarecorrelatedyieldedaloweraccuracythanat leastthetwotoprankedalgorithms.
4.6.Dependencyonobservervariations
Agoodsegmentation methoddoesnot onlyadaptwellto sec-ond center data but equally to another observer’s ground truth.
OnlytheGT01groundtruthsetwasmadeavailabletothe partici-patingteamsduringthetraining/tuningphase.Hence,particularly machinelearningsolutionscould beexpectedtoshow deficitson the second rater groundtruth GT02. To test howwell the meth-odsgeneralize,wecomparedtheirperformanceonthetestingsets GT01groundtruthagainst theirperformance ontheformerly un-seenGT02set(Fig.5).
The average DC scores of each method differed only slightly overthegroundtruthsets.Onlyinasinglecase,UK-Imp2,the dif-ferencewassignificant(pairedStudent’st-testwithp<0.05),but the higher results were obtainedfor the, formerly unseen, GT02 set. We can hence conclude that all algorithms generalizedwell withrespecttoexpertsegmentationsofdifferentraters.An addi-tionaldataanalysisshowedthattheranking ofthemethodsdoes notchangeifonlyoneortheotherofthegroundtruthsetsis em-ployedforevaluation.
4.7. Outliercases
Abenchmarkisonlyasgoodasitsdata.Theaveragescores ob-tainedonthedifferentcasesofthetestingdatasetdifferedwidely andsomeprovedespeciallydifficultoreasytosegment(Fig.6).
Forcases29to36,thisvariationcanbeexplainedthroughthe differentacquisitionparametersatthesecondmedicalcenter.But the weak performance of mostmethods on cases such as 10,17 and23 must haveother reasons.We compared these visually to the overall most successful cases 2, 5 and 13 to detect possible commonalities(Fig.7).
The threecases thatwere successfullyprocessed by nearly all algorithms show large, clearly outlined lesions with a strongly hyperintense FLAIR signal. In two of these cases, the DWI sig-nal is relatively weak, in some areas nearly isointense. Still, for thesecases thealgorithms displayed thehighestconfidence. One ofthemostdifficultcases(17)containsonly asinglesmalllesion withmarginalFLAIRandstrongDWIhyperintensities.Anothercase
Table8
CorrelationbetweentheSISScasecharacteristicsand theaverageDCvaluesoverallteams.Aρ denotes aSpearmancorrelation,a t aStudent’s t -test.All p-valuesaretwotailed(p 2).Significantresults
accord-ingtoa95%confidenceintervalaredenotedbya
∗.Secondarytestsappearinginthetablewere
per-formedagainstthelesionvolumeratherthanthe av-erageDCvalues. Characteristic Test p 2 Lesioncount ρ=−0.21 0.23 Lesionvolume ρ=+0.76 0.00∗ Haemorrhagepresent t =+2.29 0.03∗ vs. lesion volume t =+4.33 0.00∗ Non-strokeWMHload ρ=−0.01 0.97 Midlineshift t =+0.51 0.62 Ventricularenhancement t =+1.56 0.13 Laterality t =+2.66 0.01∗ vs. lesion volume t =+2.12 0.03∗ Movementartifacts ρ=−0.30 0.08 Imagingartifacts ρ=+0.24 0.15
(10),equallyshowingasmalllesion,hasastrongerFLAIRsupport, but also displayslarge periventricular WMHs that seem to con-fuse most algorithms despite missing DWI hyperintensities. This behavior was also visible for the third of the failed cases (17): Here, the actual lesion is correctly segmented by most methods as it isclearly outlined withstrong FLAIR andDWI support.But manyalgorithmsadditionallydelineatedpartsofthe periventricu-larWMHs,whichagainonlyshowupintheFLAIRsequence.
4.8. Correlationwithlesioncharacteristics
Thepropertiesofthecasesmighthaveaninfluenceonthe seg-mentationqualityassomeareclearlyeasiertosegmentthan oth-ers.Tofindsuchcorrelations,werelatedvariouslesion characteris-ticstotheaverageDCscoresobtainedoverallteamsusingsuitable statistics(Table8).
Significantmoderatecorrelation wasfound betweenthelesion volume and the average DC values. A statisticallysignificant dif-ference ofmeanswasfoundwhencomparingcaseswith haemor-rhage present and cases without, as well as betweenleft hemi-spheric and right hemispheric lesions. Since the characteristics cannot beassumedtobe independent,we furthermoretestedthe lasttwogroupingsforsignificantdifferencesinlesionvolumes be-tweenthegroups.Thiswasfoundinbothcases(seesecondarytest foreachofthesetwocharacteristics).Wecouldnotreliably estab-lishasignificantinfluenceontheresultsforanysingleparameter. Eventheinfluenceoflesionvolumeisnotcertainaswewilldetail inthediscussion.
5. Results:SPES
5.1. Leaderboard
To establish an overall leaderboard for state-of-the-art meth-ods in automatic acute ischemic stroke lesion segmentation, all submitted results were ranked relatively as described in Section3.4(Table9).
We optednot to calculate the HD forSPES asit doesnot re-flecttheclinicalinterestofprovidingvolumetricinformationofthe penumbraregion.Inaddition,sincesomelesionsinSPEScontained holes, the HD wasnot a useful metric forgauging segmentation quality.Thisrankingistheoutcomeofthechallengeeventandwas used todeterminethe competitionwinners.No completelyfailed segmentation (DC < 0) was submitted for anyof the algorithms
Fig.8. Visualizationofsignificantdifferencesbetweenthe7participatingmethods’ caseranks.Eachnoderepresentsateam,eachedgeasignificantdifferenceofthe tailsideteamovertheheadsideteamaccordingtoatwo-sidedWilcoxon signed-ranktest(p <0.025).Therefore,thelessoutgoingandthemoreincomingedges ateamhas(denotedbynumbersinbrackets(#out/#in )foreasierinterpretation), theweakeritsmethodcomparedtotheothers.Thesaturationofthenodecolors roughlydenotesthestrengthofamethod,wherebettermethodsaredepictedwith strongercolors.Notethatallteamswiththesamenumberofincomingand outgo-ingedgesperform,statisticallyspoken,equallywell.
Fig.9. DCscoreresultofall7SPESteamsforeachofthetestingdatasetcases. Mostmethodsshowasimilarpattern.Pleaserefertotheonlineversionforcolor.
andtheevaluationresults ofthe highestrankingteams denotea highsegmentationaccuracy.
5.2.Statisticalanalysis
Astrict ranking issuited todetermine the winnersofa com-petition, butaverage performance scores are ignoring the spread ofthe results. To thisend, we pursued a statistical analysisthat takesintoaccount thedispersion in thedistributionof case-wise results,andwecompareeachpairofmethodswiththetwo-sided Wilcoxonsigned-ranktest(Fig.8).
Inthistest,we donot observesignificantdifferencesbetween the two first ranked methods nor between the third and fourth place.Hence, SPES has two firstranked, two second ranked, and onethirdrankedmethodaccordingtothestatisticalanalysis. 5.3.Resultspercaseandmethod
Asimilarityinperformance basedonstatisticaltestsand aver-agescoresbetweenthefirsttwoandsecondtwomethodswas al-readyestablished.Totestwhetherthesepairsbehavesimilarlyfor all ofthetestingdataset cases,we plottedtheDC scoresofeach teamagainstthecases(Fig.9).
Theperformancelinesofthehighestrankedmethods,CH-Insel andDE-UzL, display a very similar patternand, except forsome
Table9
SPESchallenge leaderboardafterevaluating the 7participatingmethodsonthe testing dataset.The rank isthefinalmeasurefororderingthe algorithms’performancesrelative toeachother.The cases columndenotesthenumberofsuccessfully(i.e.,allDC>0) seg-mentedcases.Allevaluationmeasuresaregiveninmean±STD.Sincenomethodfailed completelyonasinglecase,thereportedASSDvaluesaresuitableforadirectcomparison betweenmethods.Thethreenext-to-lastrowsdisplaytheresultsobtainedwithdifferent fusionapproaches. Thelasttworowsdenotethresholdingmethodsemployedinclinical studies.
rank method cases ASSD(mm) DC[0,1]
2.02 – CH-Insel 20/20 1.65±1.40 0.82±0.08 2.20 – DE-UzL 20/20 1.36±0.74 0.81±0.09 3.92 – BE-Kul2 20/20 2.77±3.27 0.78±0.09 4.05 – CN-Neu 20/20 2.29±1.76 0.76±0.09 4.60 – DE-Ukf 20/20 2.44±1.93 0.73±0.13 5.15 – BE-Kul1 20/20 4.00±3.39 0.67±0.24 6.05 – CA-USher 20/20 5.53±7.59 0.54±0.26 majorityvote 20/20 1.75±0.39 0.82±0.08 STAPLE 20/20 2.40±1.22 0.82±0.06 SIMPLE 20/20 1.69±0.50 0.83±0.07 Tmax>6s (Christensenetal.,2010) 20/20 13.02±4.15 0.27±0.10 Tmax>6s &size>3ml(Strakaetal.,2010) 20/20 7.04±4.99 0.32±0.13
smallvariation,reachmostlyverysimilarDCvalues.Itseemslike bothmethods are doing roughlythe same.This observationdoes nothold trueforthe two runner-ups, BE-Kul2andCN-Neu. Both methodsdisplay outlierstowards thelower endandtheir perfor-mancesforthetestingdatasetcasesarenotasneartoeachother asobservedforthefirsttwomethods,i.e.,whilesimilarinaverage performance,the methods seemto representdifferent segmenta-tionfunctions.Thelowestranked methodsmainlydifferfromthe othersinthe sense that they failto cope withthemore difficult cases.
Overall,mostalgorithmsexhibitthesametendencies,i.e., imag-ingand/orpathologicaldifferencesbetweenthecasesseemto in-fluenceallmethodsinasimilarfashion.Inotherwords,the meth-odsagree largely on whatcould be considered difficult andeasy cases.
Theoutcomeofcombiningallparticipants’resultsbymeansof labelfusion(c.f.Section3.5)yieldedthehighestDicescoreswhen usingtheSIMPLEalgorithm,but(fortheSPESdata)applying STA-PLEandmajorityvoteproduceasimilaroutcome(seeTable9, bot-tom)
5.4.Outliercases
Wetook acloselookattwocaseswithoveralllowaverageDC scores,cases05and11, to establisharationale behindthelower performance of the algorithms (Fig. 10). For case 05,we can be observedtwoprevious embolismsthatcauseacompensatory per-fusionchange, depictedastwo hyperintensity regions within the lesionareainthediffusionimageandashypoperfusedareasinthe Tmaxmap.The difficultiesassociatedtothesegmentationofcase 11arerelatedtoanacuteinfarctpresentingamismatchwitha in-tensitypatternsimilarontheTmaxandintheborderlineintensity rangeof6seconds.Insummary,themaindifficultiesfacedbythe algorithms are related to physiological aspects, such ascollateral flow,previousinfarcts,etc.
6. Discussion:SISS
With the SISSchallenge, we provided a public dataset witha fair and independent automatic evaluation system to serve as a generalbenchmarkforautomatic sub-acuteischemic strokelesion
segmentation methods.Asmain resultofthe challengeevent, we areabletoassessthecurrentstateoftheartperformancein auto-matic sub-acute ischemic stroke lesion segmentation and togive well-founded recommendations for future developments. In this section,we review theresultsoftheexperimentsconducted, dis-cusstheir potentialimplications, andtrytoanswer thequestions posedintheintroduction.
Foremost,we aimed toestablishifthe taskcan be considered solved:The answerisa clearno.Eventhe bestmethods are still farfromhumanraterperformanceassetbytheinter-raterresults. And while theobservers agreed at leastpartially inall cases,no automatic method segmented all cases successfully. Many issues remainandatarget-orientedcommunityeffortisrequiredto im-provethesituation.
ThebestaccuracyreachedisanaverageDCof0.6withanASSD of4mm.ThehighaverageHDofatleast20mmrevealsmany out-liersand/or missedlesions.AnSTD of0.3DCdenoteshigh varia-tions;indeed,we observemanycompletelyorlargelyfailedcases foreachmethod.
PreviouslypublishedDCresultsonsub-acutedata(Table1)are all slightly to considerably better. This underlines the need for a public dataset for stroke segmentation evaluation that encom-passes the entire complexity of the task as private datasets are oftentooselectiveandthereportedresultsdiffer greatlywithout providing the informationrequired to identify the causesbehind thesevariations.
The low scores obtained by all participating algorithms show that sub-acute ischemic stroke lesionsegmentation is a very dif-ficult task. This is furthermore supported by the high inter-rater variations obtained, an observation that has been made before: Neumann et al. (2009) report median inter-rater agreement of DC=0.78 and HD=23.4 mm over 14 subjectsand 9 raters and Fiezetal.(2000)volumedifferencesof18±16%.
6.1. Themostsuitablealgorithmandtheremainingchallenges The benchmark results were reviewed to identify the type of algorithm mostsuitable forsub-acuteischemic stroke lesion seg-mentation, but no definite winner could be determined. While there are clear methodological differences between the submit-ted methods, the same methodological approach (used in
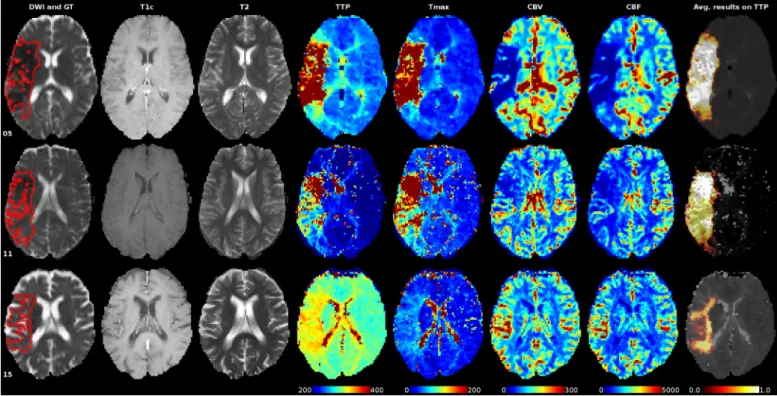
differ-Fig.10.Sequencesofsomecaseswithalow(05and11)andhigh(15)averageDCscoreoverall7teamsparticipatinginSPES.Thegroundtruthispaintedredintothe DWIsequenceslicesinthefirstcolumn.Thelastcolumnshowsthedistributionoftheresultingsegmentationsonthegray-scaleversionoftheTTP.Allperfusionmapsare windowedequallyfordirectcomparison.Pleaserefertotheonlineversionforcolors.
ent algorithms) may lead to substantially different performance. We were not even able to determine clear performance differ-ences betweentypes of approaches:The two statisticallyequally well performing winnersincludeone machine learningalgorithm basedondeeplearning(UK-Imp2withaconvolutionalneural net-work (CNN)) and one non-machine learning approach (CN-Neu withfuzzyC-means). Wehavetoconcludethat manyofthe par-ticipating algorithms are equally suited and that the devil is in the detail. This finding is supported by the wide spread of per-formancesforrandomforest(RF)methods,includingthethirdand thenexttolastpositionintheranking.Adaptationtothetaskand tuningofthehyperparametersisthekeytogoodresults.An obser-vationmadeisthatthethreewinnersalluseacombinationoftwo algorithms,possiblycompensatingtheweakpointsofonewiththe other.
All participatingmethods showedgood generalization abilities regardingthesecondrater.Sincetheinter-ratervariabilityishigh, wecanassumethateventhemachinelearningalgorithmsdidnot suffer from overfittingor, in other words, managedto avoid the inter-rater idiosyncrasies. Another explanation could be that the differences between the two raters fall into regions where little imageinformationsupportsthepresenceoflesions.
Quitecontrary,notasinglealgorithmadaptedwell tothe sec-ondmedicalcenterdata.DifferencesinMRIacquisitionparameters andmachine dependent intensityvariationsare knownto posea challenge forallautomatic image processingmethods (Han etal., 2006).Seemingly,thecenter-dependentdifferencesaredifficultto learn ormodel.Regrettably, wedidnot haveenoughsecond cen-ter datainthetestingdatasettodrawaconclusivepictureasthe observed highvariations mightequally be caused by the consid-erably smaller lesion sizesin the second centerdataset or other factors not attributable to multi-center variations(Jovicichet al., 2009). Specialattentionshould bepaidto thispoint when devel-opingapplications.
Casesforwhichallmethodsobtainedgoodresultsshowmostly large and well delineated lesions with a strong FLAIR signal while smalllesions withonly a slightly hyperintense FLAIR sup-portposed difficulties.Surprisingly,quitea numberofalgorithms havetroubledifferentiating betweensub-acutestroke lesionsand periventricular WMHs despite the fact that the latter shows an isointense DWI signal. This might be attributable to the strongly hyperintense DWI artifacts and often inhomogeneous lesion ap-pearance,reducing the methods’confidence inthe DWI signal.It ishardtojudgewhetherthesefindingsholdtrueforother state-of-the-artmethodsbecausemostpublicationsprovideonlylimited informationanddiscussionsonthe particularitiesof their perfor-manceorfailurescenarios.
Noneofourcollectedlesioncharacteristicswasfoundtoexhibit asignificantinfluenceontheresults(Table8):The lesionvolume correlates significantly with the scores, but the DC is known to reachhighervaluesforlargervolumes. Theapparentperformance differencesinthepresence ofhaemorrhagesandthe dependency onlaterality couldbothbeexplainedbydifferencesinthe respec-tivegroup’s lesionsizes.Toinvestigatecombinationsof character-istics with, e.g., multifactorial ANOVAs, a larger number of cases wouldberequired.
Theconclusionsdrawnherearemeantto begeneralandvalid formostofthe participatingmethods. A method-wisediscussion isoutofthescopeofthisarticle.Anyinterestedreaderisinvited todownloadtheparticipants’trainingdatasetresultsandperform her/hisownanalysistotestwhetherthesefindingsholdtruefora particularalgorithm.
6.2.Recommendationsandlimitations
Whendevelopingnewmethods,noparticularalgorithmshould be excluded a-priori. Instead, the characteristics of stroke lesion appearances, their evolution, andthe observed challengesshould bestudiedindetail.Basedonthisinformation,newsolutions tar-getingthespecificproblemscanbedeveloped.Aspecificalgorithm
can then be selected dependingon how well the envisioned so-lutions can be integrated. Where possible, the strength of differ-entapproachesshouldbecombinedtocounterbalancetheir weak-nesses.
Evaluation should never be solely conducted on a private datasetasthevariationbetweenthecasesistoolargeforasmall settocompensateforallofthemand,hence,rendersanyfair com-parisonimpossible.Webelieve thatwithSISSwe supplieda test-ingdatasetwhichsuitablyreflectsthehighvariation instroke le-sionscharacteristics andencompassedthecomplexityofthe seg-mentationtask.
Special attention should be put on the adaptation to second center data, which proved to be especially difficult. One could either concentrate on single-center solutions, try to develop a method that can encompass the large inter-center variations, or aimfor an approach that can be specifically adapted. The whole subjectrequires further investigation and should not be handled lightly.
Considering that multiplecomplete failures were exhibited,it would be interesting to develop solutions that allow automatic segmentation algorithms to signal a warning when they assume tohavefailedonasegmentation.Thisproblemisrelatedto multi-classifier competence,which few publications havedealt withto date(WoloszynskiandKurzynski,2011;Galaretal.,2013).
Label fusion (see Section 3.5) and automatic quality rating may be a potential avenue to compensate for different short-comings of multiple algorithms that have been applied to the same data. We found that up to some degree the SIMPLE algo-rithm (Langeraket al., 2010) wasable to improveover the aver-ageparticipants’resultsbyautomaticallyassigningahigherweight totherespectivealgorithmthatperformedbestforagivenimage. Theweights obtainedwiththeSIMPLEalgorithmforeachmethod maybeusedasanaprioriselectionofeffectivealgorithmsinthe absence ofmanual segmentations. There is, however, a risk of a negativeinfluence of multiple failed segmentations that are cor-relatedasevident by thegenerallylower accuracy ofthe STAPLE fusion(Tables7and9).
Physiciansandclinicalresearchersshouldnotexpectafully au-tomatic,reliable,andprecise solutioninthenearfuture;thetask issimplytoocomplexandvariableforcurrentalgorithmstosolve. Instead,the findings ofthisinvestigation can help them to iden-tifysuitable solutions that canserve assupport tools:In particu-larclearlyoutlined,largelesionsarealreadysegmentedwithgood results,which areusually tediousto outlineby hand.Forsmaller andlesspronounced lesions the manual approach is still recom-mended.Furthermore,theyshouldbeawarethat individual adap-tationstoeachdatasourcearemostlikelyrequired-eitherby tun-ingthehyperparametersorthroughmachinelearning.
7.Discussion:SPES
AllthebestrankingmethodsshowhighaverageDC,lowASSD andonlyminimalSTD,denotingaccurateandrobustresults.A lin-earregressionanalysisfurthermorerevealedagoodvolumefitfor the best methods (CH-Insel: r=0.87 andDE-UzL: r=0.93). We cansay that reliableandrobust perfusion lesionestimation from acutestroke MRI is in reach. For a final answer, a thorough in-vestigationofthe inter-andintra-raterscoreswouldbe required, whichliesoutofthescopeofthiswork.
In clinical context a Tmax thresholding at > 6s was estab-lished to correlate best with other cerebral blood flow mea-sures (Takasawa et al., 2008; Olivot et al., 2009b) and final le-sionoutcome (Olivotetal., 2009a; Christensenetal., 2010; Fork-ertetal.,2013).Itisalreadyusedinlargestudies(Lansbergetal., 2012). We started out with thesame method when creating the groundtruthforSPES,butfollowedbyconsiderablehuman
correc-tion.Thecomparisonagainstthesimplethresholding(Table9, sec-ondto lastrow)hencegivesan ideaoftheintervention in creat-ingthegroundtruth.Comparedagainsttheparticipatingmethods, itbecomesclearthat thesemanagedtocapturethephysicians in-tentionwhensegmentingtheperfusionlesionquitewellandthat simplethresholdingmightnotsuffice.
An improved version proposed by Straka et al. (2010), where binaryobjects smaller than 3ml are additionallyremoved, leads to better results(Table9, last row)than simple thresholdingbut stillfarfromSPES’algorithms.Thresholdingisclearlynotasuitable approachforpenumbraestimation.
The discrepancy between the relatively good results re-ported by Olivot et al. (2009a), Christensen et al. (2010) and Straka et al. (2010) and the poor performance observed in this studycan be partially explainedby thedifferent end-points (ex-pertsegmentationonPWI-MRIvs. follow-upFLAIR/T2),the differ-entevaluationmeasures(DC/ASSD vs. volumesimilarity),andthe different data. This only serves to highlight the need for a pub-licevaluationdataset.Fromanimageprocessingpointofview,the volumecorrelation isnota suitablemeasure toevaluate segmen-tations as it can lead to good results despite completely missed lesions.
7.1. Themostsuitablealgorithmandtheremainingchallenges Both ofthe winningmethods are based on machine learning (RFs)andbothadditionallyemployexpertknowledge(e.g.a prior thresholdingoftheTmaxmap).Theirresultsaresignificantly bet-ter than those ofall other teams. Theother methodsin orderof decreasing rankare: another RF method,a modeling approach, a rulebasedapproach,anothermodelingapproach,andaCNN.
Althoughthe numberofparticipatingmethods istoo smallto drawageneralconclusion,theresultssuggestthatRFsintheir var-ious configurations are highlysuitable algorithms for the taskof stroke penumbra estimation.Furthermore, they are known to be robustandallowforacomputationaleffectiveapplication,bothof whicharestrongrequirementsinclinicalcontext.
An automated methodhas to fulfill thestrict requirementsof clinical routine. Since time is brain when treating stroke, it has to fit tightly into the stroke protocol, i.e., is restricted to a few minutes of runtime(Straka et al.(2010) state ± 5min asan up-perlimit).With6min(CH-Insel)and20sec(DE-UzL), includingall pre- andpost-processing steps, the two winningmethods fit the requirements,DE-UzLevenleavingroomforoverhead.
7.2. Recommendationsandlimitations
New approaches for perfusion estimation should move away fromsimple methods (e.g.rule-based orthresholding). These are easy to apply, but our results indicate that they cannot capture thewholecomplexityoftheproblem.Machinelearning,especially RFs,seemtobe moresuitable forthe task:Theycan model non-linearfunctionalrelationshipbetweendataanddesiredresultsthat a simpler approach cannot. Domain knowledge is likely required to achieve state-of-the-art results asthe Tmaxmap thresholding of the two winning methods indicates. Evaluation should in any casebeperformedviaacombinationofsuitable,quantitative mea-sures. Simple volume difference or qualitative evaluation are of limitedexpressivenessandrenderthepresentedresults incompa-rable.Wherepossible,theevaluationandtrainingdatashould be publicly released.Finally,it hasto be kept inmind thatthe seg-mentationtaskisatime-criticalone andapplicationtimesare al-waystobereportedalongsidethequantitativeresults.
Thepresentedalgorithmsareclosetoclinicaluse.However, in-tensive work is further needed to increase their robustness for the variety of confounding factors appearing in clinical practice.