Article
Double Weight-Based SAR and Infrared Sensor
Fusion for Automatic Ground Target Recognition
with Deep Learning
Sungho Kim1,* ID, Woo-Jin Song2and So-Hyun Kim3
1 Department of Electronic Engineering, Yeungnam University, 280 Daehak-Ro, Gyeongsan, Gyeongbuk 38541, Korea
2 Department of Electrical Engineering, Pohang University of Science and Technology, Pohang, Gyeongbuk 37673, Korea; [email protected]
3 Agency for Defense Development, 111 Sunam-dong, Daejeon 34186, Korea; [email protected]
* Correspondence: [email protected]; Tel.: +82-53-810-3530
Received: 14 November 2017; Accepted: 3 January 2018; Published: 11 January 2018
Abstract: This paper presents a novel double weight-based synthetic aperture radar (SAR) and infrared (IR) sensor fusion method (DW-SIF) for automatic ground target recognition (ATR). IR-based ATR can provide accurate recognition because of its high image resolution but it is affected by the weather conditions. On the other hand, SAR-based ATR shows a low recognition rate due to the noisy low resolution but can provide consistent performance regardless of the weather conditions. The fusion of an active sensor (SAR) and a passive sensor (IR) can lead to upgraded performance. This paper proposes a doubly weighted neural network fusion scheme at the decision level. The first
weight (α) can measure the offline sensor confidence per target category based on the classification
rate for an evaluation set. The second weight (β) can measure the online sensor reliability based on
the score distribution for a test target image. The LeNet architecture-based deep convolution network (14 layers) is used as an individual classifier. Doubly weighted sensor scores are fused by two types
of fusion schemes, such as the sum-based linear fusion scheme (αβ-sum) and neural network-based
nonlinear fusion scheme (αβ-NN). The experimental results confirmed the proposed linear fusion
method (αβ-sum) to have the best performance among the linear fusion schemes available (SAR-CNN,
IR-CNN, α-sum, β-sum, αβ-sum, and Bayesian fusion). In addition, the proposed nonlinear
fusion method (αβ-NN) showed superior target recognition performance to linear fusion on the
OKTAL-SE-based synthetic database.
Keywords:SAR; IR; fusion; double weights; linear; nonlinear; deep learning; OKTAL-SE
1. Introduction
Automatic target surveillance and recognition is important for protecting borders and countries.
Among several sensors available, infrared (IR) cameras, particularly mid-wave infrared band (3–5µm),
are used frequently in military applications because of the day and night operation capability [1,2].
The research scope of this paper focuses only on ground target recognition assuming that the target regions or locations are detected by IR only [3–5], synthetic aperture radar (SAR) only [6–8], and
fused sensor [9–11]. Many military applications prefer to use IR-based target recognition because
IR sensors have a passive nature and high image resolution. On the other hand, IR images are sensitive to weather and imaging conditions; IR-based automatic target recognition (ATR) methods have been attempted to overcome these limitations. Since the 1980s, model-based approaches have become popular and targets have been recognized by the alignment method, such as geometric
hashing [12]. Moreover, various image learning-based target recognition methods have been proposed
by considering both feature extractors and classifiers to cope with IR variations. The Markov tree feature [13], IR wavelet feature [14], scale invariant feature transform (SIFT) [15], histogram of oriented
gradients (HOG) [16], and moment features [17,18] are recently proposed infrared features that show
promising recognition results on their own applications. Simple machine learning-based classification methods, such as the nearest neighbor classifier [15], Bayesian classifier, conventional neural network,
Adaboost [19], and support vector machine (SVM) [16] are used frequently to discriminate the target
features for classification.
SAR can measure the electromagnetic scattering property of targets under any weather and
light conditions [20]. This method is used frequently to recognize a range of targets because it
provides a strong radar cross section (RCS) and shape information of non-stealth targets. On the
other hand, it produces many false recognitions due to speckle noise [21]. Various SAR features, such
as polarimetry and transformations (log-polar, Fourier, and wavelet), are used to discriminate SAR
targets [20,22–24]. The standard deviation, fractal dimension, and weighted-rank fill ratio are the
basic SAR features proposed in the Lincoln laboratory [22]. A genetic algorithm-based SAR feature
selection method has been used to select the optimal features for target recognition [25]. Targets can be recognized by classifying features. Template matching is popular in military applications because of
its simplicity [26]. The joint sparse representation-based method was used to tackle to the 3D problem
in template matching using multiple views [27]. A model-based approach using a scattering center
model was proposed to reduce the database size [28].
The fusion of SAR and IR imagery enables a combination of complementary information, such as the thermal signatures in the IR case and RCS signatures in the SAR case. Both sensors have day and night capabilities, whereas the SAR sensor has weather-independence. Therefore, it is reasonable to
use both SAR and IR sensors to recognize the targets stably by sensor fusion [29]. There are almost no
published works of SAR-IR fusion-based ATR except [30,31] due to security reasons. This method uses
a hypothesis fusion coming from both SAR feature and IR features. IR target scores provide hints of possible target models. If the corresponding SAR target features are correlated with model features, the hypothesized target model is boosted. In SAR-IR fusion-based ATR research, there are three issues: preparation of the database (DB), fusion level, and fusion architecture. Based on these issues, the contributions of this paper can be summarized as follows. The first contribution is the preparation
of a new SAR-IR database of 16 ground targets using an OKTAL-SE simulator [32–34]. OKTAL-SE is
the only simulator that can synthesize SAR and IR for the same background and targets. The second contribution is the proposition of a novel SAR-IR fusion architecture based on the double weight-based linear sum scheme at the decision level. The third contribution is the adoption of a state-of-the-art classifier, deep convolutional neural network, which consists of 14 layers.
The remainder of this paper is organized as follows: Section2introduces the background of
SAR-IR fusion levels and fusion methods. Section3explains the overall structure of the paper, including
the SAR-IR database construction method, deep convolutional neural network-based basic classifier,
and double weight-based SAR and IR sensor fusion for ground target recognition. Section4explains
the composition of the DB and classifiers and Section5evaluates the target recognition performance of
the proposed method by comparing it with the Bayesian fusion. The paper is concluded in Section6.
2. Background of SAR-IR Fusion Level and Fusion Method
Ground targets can be recognized by SAR and IR sensor fusion. The recognition of targets from
multisensor data can be described at the level at which the data are combined [35]. According to sensor
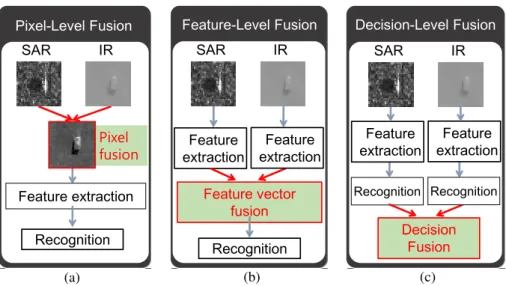
fusion strategy, there are three types of fusion schemes in SAR and IR fusion-based recognition, as shown in Figure1[36,37].
Pixel-Level Fusion Feature-Level Fusion Decision-Level Fusion IR SAR Feature extraction Feature extraction Feature vector fusion Recognition Decision Fusion Feature extraction Recognition Recognition Recognition Feature extraction Feature extraction (a) (b) (c) Pixel fusion IR SAR SAR IR
Figure 1. SAR and IR sensor fusion-based target recognition schemes: (a) pixel-level fusion; (b) feature-level fusion; and (c) decision-level fusion.
The pixel-level fusion scheme is used frequently in homogeneous sensors governed by the same underlying physical mechanisms, such as CCD and IR, or in visualization for human
understanding [38]. In pixel-level fusion, the data is combined, and the features are then extracted.
Li et al. conducted the first trial of SAR-IR fusion at the pixel-level in 1996 [39]. The HNC (the
name of the software company) algorithm was proposed to fuse the SAR and IR images based on
the stereo human visual system to enhance the image contrast [40]. In 1997, Novak et al. in the
Lincoln Laboratory proposed a super-resolution by the pixel-level fusion of SAR and IR images,
which showed the upgraded performance of target classification [41]. In satellite-based applications,
Wavelet transformation-based fusion showed upgraded earth surface classification [42,43]. Recently,
a compressed sensing-based SAR-IR fusion method was presented by a discrete cosine transformation
(DCT) and sparse coefficient fusion, which showed better image contrast [38].
In contrast, in feature-level fusion, feature extraction is performed individually on the data of each sensor; these feature vectors are then combined. The classifiers use the concatenated feature vector of
SAR and IR [44]. The first SAR-IR fusion in the feature-level was presented using the DCT feature and
distance measure in 1996 [35]. Lei et al. fused the shape information of the electro-optical (EO) sensor
and fractal dimension of SAR sensor and classified targets by fuzzy C-means in 2005 [45]. Lehureau et
al. fused the Gabor features for EO and log-cumulants for SAR in feature level [44]. SVM conducted
the classification of the fused vector for the target classifications of buildings, roads, and forests [46]. Recently, a multiple kernel learning (MKL)-based recognition method was proposed by selecting the features automatically for the earth surface classification of Lansat images [47].
Individual classifier decisions can be fused at the decision-level. The initial work of decision-level
SAR-IR fusion was conducted in 1999 by sequential fusion [30]. The multi-frame IR sensor provides
a hypothetical target model and the SAR sensor recognizes the final targets [31]. Radar and IR
fusion in the decision level provides upgraded target recognition and tracking accuracy [48]. In 2002,
evidence reasoning (Dempster-Shafer theory, DST) was extended to target recognition by fusing the
SAR and EO images at the decision level [49]. DST was used to fuse the multi-sensors for target
detection by generalizing the Bayesian fusion. The Bayesian sensor fusion method was used for target
recognition [50]. In 2007, Waske et al. proposed a fused SVM classifier that combines SVM result per
sensor and builds a new SVM classifier [51]. Recently, majority voting (MV)-based approaches were
proposed and showed promising results in SAR-EO-based target recognition. Each target feature is assigned to each classifier, which votes the recognized target identity (ID). Targets with the maximal
votes are finally recognized [52–54]. Logical AND/OR operation after Bayesian classification was
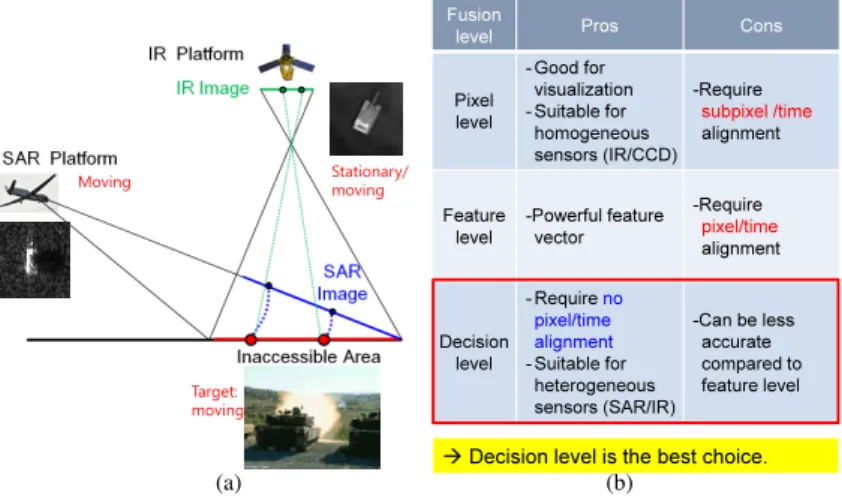
The first issue is how to select the optimal fusion level for SAR-IR-based target recognition. Understanding the SAR and IR image acquisition scenario is very important for enhancing the
recognition performance, as shown in Figure2a, which shows the scenario of target detection and
recognition in an inaccessible area using a multitude of sensor types, such as IR and SAR. A SAR sensor mounted on an airplane can image an inaccessible area by the small depression angle and the IR sensor mounted on a satellite or unmanned aerial vehicle (UAV) can image the same region in a top-down view. The SAR sensor should move to image the region, which requires some processing time. On the other hand, the IR sensor can record the targets in a real-time video. In addition, it is assumed that the targets (e.g., T72, AMX10) to be recognized can be stationary or moving. Therefore,
the imaged SAR and IR targets are not aligned in the spatial and time domains. As shown in Figure2b,
pixel-level fusion is suitable for visualizing homogeneous sensors but requires strict subpixel and time alignment. Although feature-level fusion can provide a powerful feature vector that can upgrade the target classification rate, it also requires pixel and time alignment. On the other hand, the decision-level fusion is suitable for heterogeneous sensor fusion, such as SAR-IR, and does not require pixel/time alignment because each sensor is processed independently. Therefore, this study uses the decision-level SAR and IR fusion for ground target recognition. In this paper, it was assumed that the detected SAR and IR target regions were registered correctly using a manual selection or automatic registration
method [9] to focus on fusion-based target recognition.
Stationary/ moving Moving Target: moving Fusion
level Pros Cons
Pixel level - Good for visualization - Suitable for homogeneous sensors (IR/CCD) -Require subpixel /time alignment Feature level -Powerful feature vector -Require pixel/time alignment Decision level - Require no pixel/time alignment - Suitable for heterogeneous sensors (SAR/IR) -Can be less accurate compared to feature level
Decision level is the best choice.
(a) (b)
Figure 2.Necessity for decision-level SAR and IR sensor fusion: (a) operational concept of automatic target recognition; (b) pros and cons for each fusion level.
The second issue is what type of fusion framework should be adopted at the decision level. This paper proposes two kinds fusion schemes: linear sum and nonlinear neural network. Linear sum-based classifier fusion is used frequently because of its simplicity and good performance. There are strategies in linear sum-based classifier fusion: hard classification-based fusion and soft classification-based fusion [54]. MV belongs to a hard classification, where each classifier provides 1 for the recognized label and 0 for the others. The final classification decision is made by selecting the class label that receives the maximal vote. The weight vote (WV) is a modified version of MV by changing 1 to a weighted vote using the classifier reliability [56]. Bayesian fusion, Dempster-Shafer theory-based fusion, and Adaboost belong to the soft classification-based fusion, where the weighted output of each
classifier is summed up to make the final decision [57]. The linear sum fusion based on probability can
provide a class confidence between 0 and 1, which is more reasonable than that based on a vote of 0 or 1. Therefore, this paper adopted the linear sum fusion approach using the classifier reliability as a baseline fusion scheme. Another nonlinear fusion scheme, such as the multi-layer neural network, is adopted because it can adjust the weights dramatically according to the current statistics among the SAR and infrared data.
3. Proposed Double Weight-Based SAR-IR Fusion for ATR
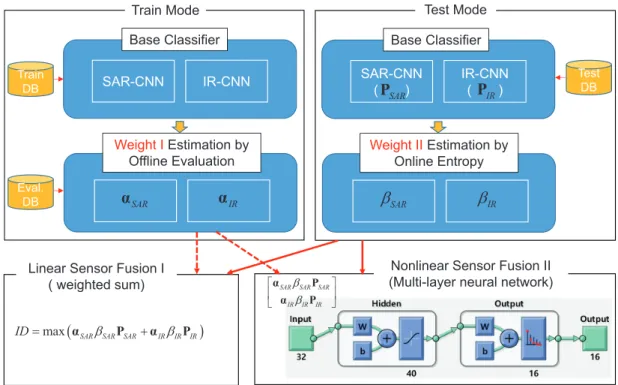
In linear/nonlinear sensor fusion, an estimation of the sensor reliability is important for the success of target recognition in non-cooperative environments. This paper proposes a novel Double
Weight-based SAR-IR Fusion (DW-SIF) framework, as shown in Figure3. The first weight vector
SAR sensor (αSAR) and IR sensor (αIR) can be obtained by applying the evaluation DB to the trained
classifiers (SAR-CNN and IR-CNN). The first weight vector can measure the reliability of the classifier for each target label based on the classification accuracy offline. In the test mode, each trained classifier
produces the target probability vector (PSAR,PIR) for each test image. The second weight (scalar,
βSAR,βIR) measures the confidence of the individual sensor based on the entropy calculated from the
target probability distribution. Multi-sensor information is fused using the proposed linear sensor fusion I (double weighted linear sum of the SAR and IR sensor) and nonlinear sensor fusion II (double weighted multi-layer neural network). A target is finally recognized by applying the maximum operation to the fused vector. The following subsections provide details of database preparation method, deep learning-based individual classification method, and sensor fusion method.
1RQOLQHDU6HQVRU)XVLRQ,, 0XOWLOD\HUQHXUDOQHWZRUN 7UDLQ0RGH %DVH&ODVVLILHU 6$5&11 ,5&11 :HLJKW,(VWLPDWLRQE\ 2IIOLQH(YDOXDWLRQ SAR
Į
Į
IR 7UDLQ '% (YDO '% %DVH&ODVVLILHU 6$5&11 ,5&11 :HLJKW,,(VWLPDWLRQE\ 2QOLQH(QWURS\ SARE
E
IR 7HVW '% 7HVW0RGH /LQHDU6HQVRU)XVLRQ, ZHLJKWHGVXP SAR3
3
IRPD[ SAR SAR SAR IR IR IR
ID Į E 3 Į E 3
SAR SAR SAR IR IR IR E E ª º « » ¬ ¼ Į 3 Į 3
Figure 3.Proposed DW-SIF system for ground target recognition. 3.1. SAR-IR Database Construction
The proposed DW-SIF system requires three types of SAR-IR databases for training, evaluating, and testing. In SAR and IR fusion-based target recognition, the most difficult part is how to prepare the SAR and IR DB for the same target and background environments to validate a range of recognition algorithms. According this survey, there are no public SAR/IR databases due to security reasons. Four types of DB preparation methods can be considered. The first database acquisition strategy is to use a real IR camera and SAR sensor mounted on an airplane. This is the most accurate and useful method but it is also the most expensive due to the expensive sensors and acquisition platform. The second strategy is to use satellites, such as TerraSAR-X for SAR and KOMPSAT-3A for IR. On the other hand, identifying the various military target images for both SAR and IR sensors is also very difficult and expensive. The third method is to develop a SAR and IR simulator for DB generation, which is out of the current research scope and will require considerable time for development. The final
strategy is to purchase commercially available software that can synthesize both SAR and IR images for the same scenario. Several simulators that can work on a specific spectrum are available: DIRSIG and SensorVision for IR and Xpatch for radar. The OKTAL-SE, which is a proven synthesizing tool,
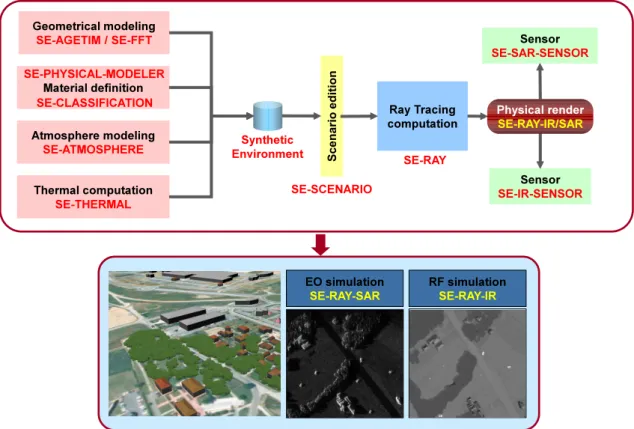
is the only simulator that can generate both SAR and IR images [32,34]. As shown in Figure 4,
the user parameter and atmospheric file are inserted into the SE-SCENARIO program, which can manipulate the SAR/IR sensor platform and locate the targets in a specific background. The SAR and IR images are generated simultaneously for the same scenario using SE-RAY-IR and SE-RAY-SAR software. The synthesized raw data can be modified further by reflecting the sensor noise in the SE-SIGNAL-VIEWER module. In particular, SE-AGETIM/SE-FFT deals with a 3D representation and the production of terrain and target models. SE-PHYSICAL-MODELER defines the material properties for EM and IR rendering. The surface temperature and RCS can be modified depending on the target types and spectral bands. SE-ATMOSPHERE generates an atmospheric transmission graph from parameters, such as weather conditions, time of day, wavelength, altitude, star irradiance, sky radiance, ground radiance, and seasons. SE-THERMAL generates a thermal database from a material database and atmospheric files. SE-SCENARIO is the main simulator that can modify the background, targets, and scenarios. SAR and IR sensors can be mounted on an airplane and moved to specific trajectories. Through the SE-RAY-SAR (SE-RAY-NBSAR) and SE-RAY-IR, synthetic SAR and IR images
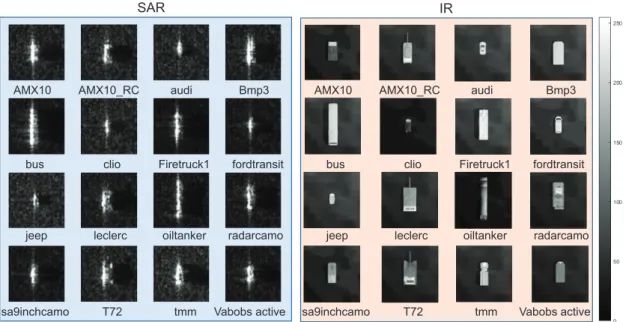
are synthesized. Figure5provides partial examples of a SAR and IR image generation for 16 targets.
In SAR image generation, the center frequency is set to 34.25 GHz with a band width of 500 MHz
in horizontal polarization. In IR image generation, mid-wave band (3–5µm) is used for the same
scenario file. The generated SAR image shows very strong speckle noise and the IR image shows a bright intensity around the engine location.
EO simulation SE-RAY-SAR RF simulation SE-RAY-IR Global architecture Synthetic Environment Material definition Geometrical modeling SE-AGETIM / SE-FFT Thermal computation SE-THERMAL Atmosphere modeling SE-ATMOSPHERE Sensor SE-IR-SENSOR Ray Tracing computation SE-CLASSIFICATION SE-SCENARIO Physical render SE-RAY-IR/SAR SE-RAY SE-PHYSICAL-MODELER Sensor SE-SAR-SENSOR
Figure 4.Simultaneous SAR and IR image generation flow using the OKTAL simulation environment (OKTAL-SE).
$0; $0;B5& DXGL %PS
EXV FOLR )LUHWUXFN IRUGWUDQVLW
MHHS OHFOHUF RLOWDQNHU UDGDUFDPR
7 WPP 9DEREV DFWLYH
VDLQFKFDPR
$0; $0;B5& DXGL %PS
EXV FOLR )LUHWUXFN IRUGWUDQVLW
MHHS OHFOHUF RLOWDQNHU UDGDUFDPR
7 WPP 9DEREV DFWLYH
VDLQFKFDPR
6$5 ,5
Figure 5.Examples of SAR and IR target generation using OKTAL-SE. 3.2. 14 Layered-Deep Convolutional Neural Network Classifier
Many hand-crafted features (e.g., SIFT, HOG, ACF, etc.) and classifiers (SVM, Adaboost, Bayesian, random forest, etc.) are available, as discussed in the introduction. Recently, deep learning-based algorithms, which learn features and classifiers simultaneously, have been proposed
and showed outperformance in RGB-based object classification on ImageNet [58] and the CIFAR image
database [59]. CNN-based approaches show better performance on visual object recognition than
the stacked autoencoder [60,61]. The stacked autoencoder (SAE) is comprised of several individual
autoencoders, which are optimized to reduce the dimension for 1D data (speech). A convolutional neural network (CNN) is comprised of spatial convolution layers and fully connected layers. The main advantage of this layer is the establishment of local connectivity through the correlation of neighboring pixels, which is optimized to the 2D data (image). According to the experimental comparisons, CNN
outperforms SAE [61]. Therefore, this paper adopts deep learning approaches as a base classifier to
recognize the individual SAR and IR target recognition. Among the several deep learning architectures,
the LeNet-based deep convolutional neural network architecture [62] is used by changing the input size
and number of layers for 16 IR target recognition, as shown in Figure6.The deep learning architecture
used in [63] consists of full convolutional layers without fully connected layers. The MatConvNet
toolbox [64] is used for training and learning because this study focused on the SAR-IR fusion for
target recognition.
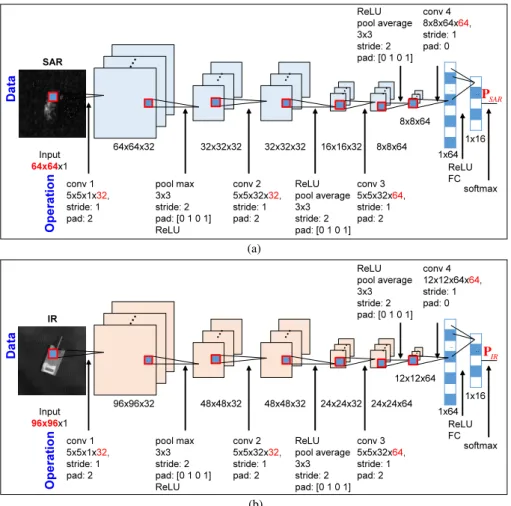
The architectures, SAR-CNN and IR-CNN, are the same except for the input image size and
related data size, as shown in Figure6. Domain specific SAR-CNN methods can be adopted depending
on the outliers [65] and terrain classification [66]. The architecture consists of 14 layers: 1 input layer, 4 convolutional layers, 3 pooling layers, 4 Rectified Linear Unit (ReLU) layers, 1 fully connected (FC) layer, and 1 output layer. The SAR-CNN architecture can be explained in terms of data flow and
operational flow. An input layer receives an IR image, 64×64 in size. The first convolution operation
using 32 kernels with a 5×5 support region, stride 1, and padding 2 produces 32 feature data with
a 64×64 resolution, as shown in Figure6a. Sub-sampled feature images are obtained through max
pooling with the 3×3 support region, stride 2, padding ([top bottom left right] = [0 1 0 1]), and ReLU.
Two additional convolutions, ReLUs and average pooling operations, produce 64 feature data with
an 8×8 resolution. The fourth convolution with 64 kernels, 8×8×64 in size, stride 1, padding
function is used to calculate the probability distribution (PSAR) of 16 targets. The IR-CNN architecture has the same network structure and operation as the SAR-CNN except for the input image size and
data size in the network, as shown in Figure6b. The IR-CNN provides a probability distribution (PIR)
for a test IR image.
Input 96x96x1 conv 1 5x5x1x32, stride: 1 pad: 2 96x96x32 pool max 3x3 stride: 2 pad: [0 1 0 1] ReLU 48x48x32 48x48x32 conv 2 5x5x32x32, stride: 1 pad: 2 ReLU pool average 3x3 stride: 2 pad: [0 1 0 1] 24x24x32 conv 3 5x5x32x64, stride: 1 pad: 2 24x24x64 ReLU pool average 3x3 stride: 2 pad: [0 1 0 1] 12x12x64 conv 4 12x12x64x64, stride: 1 pad: 0 … … ReLU FC softmax 1x64 1x16 D a ta O p e ra ti o n Input 64x64x1 conv 1 5x5x1x32, stride: 1 pad: 2 64x64x32 pool max 3x3 stride: 2 pad: [0 1 0 1] ReLU 32x32x32 32x32x32 conv 2 5x5x32x32, stride: 1 pad: 2 ReLU pool average 3x3 stride: 2 pad: [0 1 0 1] 16x16x32 conv 3 5x5x32x64, stride: 1 pad: 2 8x8x64 ReLU pool average 3x3 stride: 2 pad: [0 1 0 1] 8x8x64 conv 4 8x8x64x64, stride: 1 pad: 0 … … ReLU FC softmax 1x64 1x16 D a ta O p e ra ti o n (a) (b) SAR P IR P SAR IR
Figure 6. Details of 14-layered deep convolutional network: (a) 14 layered SAR-CNN; (b) 14 layered IR-CNN.
3.3. Proposed Double Weight-Based SAR-IR Fusion Method
As explained in Figure3, the first sensor weights represent the sensor reliability for each target
label evaluated offline. Given a trained SAR-CNN, the base classifier provides the accuracy (αiSAR) of i-th target label as defined in Equation (1) wheremiSARdenotes the total number of test samples of the
i-th target andni
SARdenotes the total number of correct recognitions.
αiSAR = n i SAR mi SAR (1) If the number of target labels is assumed to beN, the first weight vector (αSAR) for the SAR sensor
is defined as Equation (2), which represents the reliability of the SAR sensor for each target label.
The classifier can be regarded as reliable ifαiSAR ≈1 or there is high recognition accuracy, .
αSAR =
h
α1SARα2SAR· · · αNSAR
i
Similarly, given a trained IR-CNN, the base classifier provides the accuracy (αiIR) of thei-th target
label, as defined in Equation (3), wheremiIRdenotes the total number of test samples of thei-th target andniIRdenotes the total number of correct recognitions.
αiIR = n
i IR
miIR (3)
The first weight vector (αIR) for the IR sensor is defined in Equation (4), which represents the
reliability of the IR sensor for each target label. The classifier can be regarded as reliable ifαiIR ≈1 or
has high recognition accuracy.
αIR=
h
α1IRα2IR· · · αNIR
i
(4)
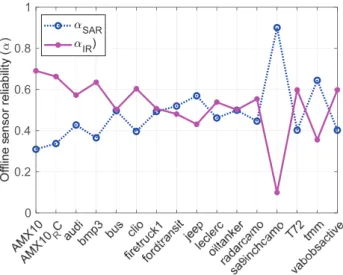
Figure7shows the estimated alpha vectors for the SAR and IR sensor by applying the trained
SAR-CNN and IR-CNN to the evaluation DB, which are explained in the experimental section. According to the offline evaluation, the IR sensor is more reliable (higherα) than the SAR sensor except
the jeep, sa9ichcamo, and tmm targets onto which IR sensor shows poor recognition performance due to the similar visual shapes compared to the SAR sensor.
5 6$5 ,5
Figure 7.Estimated SAR/IR sensor offline weights.
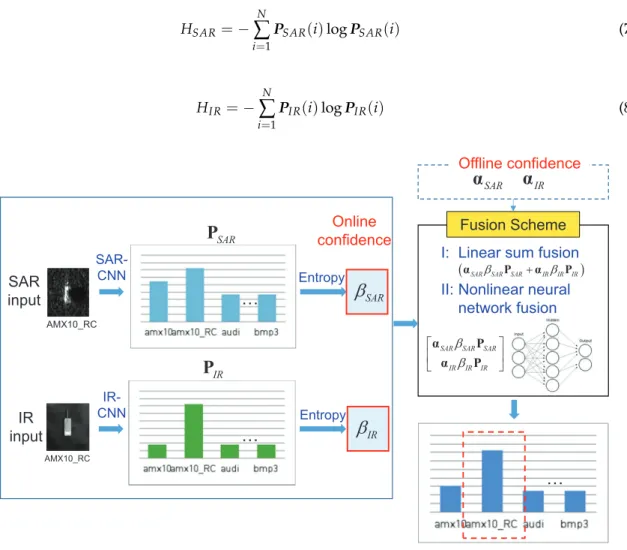
After estimating the offline sensor reliability, the next step is to measure the online sensor confidence (the second weight) for a test image. Although the probability value provides the level of target confidence, the additional information of sensor confidence is useful in SAR-IR fusion-based target recognition because the recognition capability changes dynamically according to the target input. This paper proposes an online confidence estimation based on the entropy of each sensor. If the
distribution of a probability is uniform or ambiguous, the entropy is high, as shown in Figure8left.
Similarly, the entropy is low if the distribution of a probability shows peak at a specific target label.
Based on this property, the novel confidence measures (βSAR,βIR) for the SAR and IR sensors are
defined in Equations (5) and (6), respectively.
βSAR = HIR HSAR+HIR (5) βIR = HSAR HSAR+HIR (6)
where HSAR and HIR represent the SAR and IR sensor entropies defined in Equations (7) and (8), respectively. The SAR and IR recognition probabilities (PSAR,PIR) for a test pair can be obtained by normalizing the scores produced by SAR-CNN and IR-CNN.
HSAR=− N
∑
i=1
PSAR(i)logPSAR(i) (7)
HIR=− N
∑
i=1 PIR(i)logPIR(i) (8) ձZHLJKWԻ ীଡ 6$5 LQSXW ,5 LQSXW $0;B5& $0;B5&«
«
«
SAR3
IR3
SARE
IRE
2QOLQH FRQILGHQFH )XVLRQ6FKHPH 6$5 &11 ,5 &11 (QWURS\ (QWURS\ 2IIOLQHFRQILGHQFH SARĮ
Į
IR ,/LQHDU VXP IXVLRQ ,,1RQOLQHDUQHXUDO QHWZRUNIXVLRQSAR SAR SAR
IR IR IR E E ª º « » ¬ ¼ Į 3 Į 3
ĮSARESAR3SARĮIREIR3IR
Figure 8.Offline confidence and online confidence-based SAR and IR fusion flow.
The finally recognized target identity information (ID) is obtained using either the proposed
linear fusion method defined in Equation (9) or the multi-layer neural network-based nonlinear fusion
method. The offline sensor reliability vectors (αSAR,αIR) and online sensor confidence scalars (βSAR,
βIR) are multiplied by the base classifier probabilities (PSAR,PSAR) and summed in the linear fusion scheme. The target recognition is completed by the max operation to the fused vector, as shown in Figure8right.
ID=max(αSARβSARPSAR+αIRβIRPIR) (9) In the multi-layer neural network fusion scheme, input data is prepared by concatenating the double weighted SAR vector (αSARβSARPSAR) and IR vector (αIRβIRPIR), as shown in Equation (10). In this fusion scheme, the multi-layer neural network consists of an input layer (node size 32), hidden layer (node size 40), and output layer (node size 16) because the number of targets to recognize is 16
(see Figure3). The same double weights are used in this scheme.
InputNN =
"
αSARβSARPSAR αIRβIRPIR
#
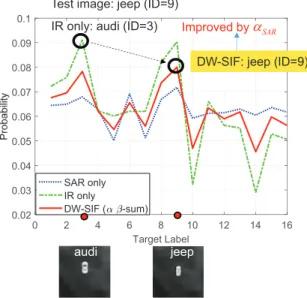
The effects of the offline weights (αSAR,αIR) can be visualized, as shown in Figure9, where the x-axis represents the target labels and the y-axis represents the probability of target recognition. Each curve represents the target recognition probability depending on the recognition methods, such as
the SAR sensor only, IR sensor only, and the proposed linear DW-SIF (αβ-sum). According to the
IR-CNN probability distribution, the test input (ID=9, jeep) is recognized asID=3 (audi), which
has a similar shape to each other in the IR domain. On the other hand, the SAR-CNN can provide a
correct answer. The proposed linear DW-SIF (αβ-sum) can correct the IR sensor information using the
CNN-SAR information and offline weight of SAR (αSAR), as indicated in Figure7, where the weight
of the SAR (0.5692) is higher than that of the IR (0.4308). Table1provides the details of the double
weight-based SAR-IR fusion flow. In this case, the incorrect recognition using only the IR sensor is corrected by the linear fusion scheme.
7DUJHW/DEHO 6$5RQO\ ,5RQO\ ':6,) VXP DXGL MHHS ,5RQO\DXGL ,' ':6,)MHHS,' ,PSURYHGE\DSAR 7HVWLPDJHMHHS,'
Figure 9.Effect of the offline weights (αSAR,αIR) in SAR-IR sensor fusion.
Table 1.Details of the recognition improvement by the offline weights.
ID 1 2 3 4 5 6 7 8 9 10 11 12 13 14 15 16 αSAR 0.3094 0.3372 0.4274 0.3650 0.4974 0.3962 0.4929 0.5194 0.5692 0.4615 0.4991 0.4461 0.9006 0.4022 0.6446 0.4021 αIR 0.6906 0.6628 0.5726 0.6350 0.5026 0.6038 0.5071 0.4806 0.4308 0.5385 0.5009 0.5539 0.0994 0.5978 0.3554 0.5979 PSAR 0.0645 0.0649 0.0679 0.0629 0.0501 0.0692 0.0512 0.0669 0.0718 0.0592 0.0612 0.0615 0.0629 0.0605 0.0636 0.0617 PIR 0.0722 0.0758 0.0911 0.0622 0.0602 0.0620 0.0620 0.0819 0.0903 0.0322 0.0661 0.0563 0.0553 0.0289 0.0528 0.0506 HSAR 2.7686 HIR 2.7335 βSAR 0.4968 βIR 0.5032 Fusion 0.0675 0.0696 0.0783 0.0621 0.0546 0.0655 0.0560 0.0736 0.0801 0.0470 0.0634 0.0590 0.0618 0.0456 0.0598 0.0562
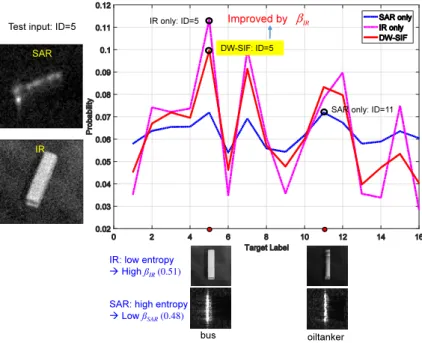
The effect of the online weights (βSAR,βIR) can be visualized, as shown in Figure10, where each curve represents the target recognition probability curve depending on the sensor type. Given a test
input (ID=5,bus), the IR-CNN provided a correct answer, while the SAR-CNN failed to recognize it
because the SAR signatures of the bus (ID=5) and oil tanker (ID=11) were similar. The entropies
of SAR and IR were estimated to be 2.7685 and 2.6877, respectively, from the SAR and IR probability
distributions using Equations (7) and (8). The corresponding online weights of the SAR and IR sensor
were calculated using Equations (5) and (6). The SAR sensor shows higher entropy than the IR sensor
because the probability distribution of the SAR sensor is flatter (equally probable) than that of the IR sensor. The online weights (βSAR,βIR) were finally estimated using Equations (5) and (6). The online
could correct the SAR-CNN information. Note that the offline weights of the SAR and IR sensors for
ID=5 were similar, as shown in Figure7.
IR only: ID=5
DW-SIF: ID=5
SAR only: ID=11 Improved by βIR
bus oiltanker
Test input: ID=5
IR SAR
SAR: high entropy
Low ßSAR(0.48) IR: low entropy
High ßIR(0.51)
Figure 10.Effect of the online weights (βSAR,βIR) in SAR-IR sensor fusion (linear fusion scheme). 4. Preparation of DB and Classifiers
4.1. Composition SAR-IR Target Database
OKTAL-SE can generate a range of SAR-IR target images by varying the SAR, IR sensor setting (spectral band, detector size, field of view, depression angle, and height), atmospheric setting, and target pose (aspect angle). The simulation scenario was assumed to be ground surveillance on an
unmanned aerial vehicle. OKTAL-SE SAR simulator can generate target images with a 30 cm×30 cm
resolution per pixel. The spectral band was basically a mid-wave IR (MWIR) and the other camera
parameters were set to produce a 5 cm×5 cm resolution per pixel.
Table2lists the composition of the target DB for training and testing for the DW-SIF. The total
number of targets was 16; among them, 10 targets were military targets (BMP3, T72, AMX10, AMX10RC, Leclerc, Jeep, TMM, Rada Camo, SA9 Inch Camo, and VAB OBS) and 6 targets were non-military targets (Audi, Bus, Clio, Firetruck, Oil tanker, and Ford transit). In the case of the train DB, the SAR
target templates had a 64×64 image resolution with a depression angle of 10, 15, 20, and 25◦and an
aspect angle of 5◦. The total number of the SAR training DB was 4608 (16 targets×72 aspect angles×4
depression angles). Similarly, the IR target templates had a 96×96 image resolution with a depression
angle of 65, 70, 75, and 80◦and aspect angle of 5◦. The total number of IR training DB was 4608, which
is the same number as the SAR templates. Figure11a shows the 16 SAR targets (top) and 72 aspect
views for T72 at a depression angle of 20◦(bottom). Figure11b presents the corresponding IR target
templates of T72 at a depression angle of 75◦.
An evaluation DB is required to measure the classification reliability of the SAR and IR sensors,
which are used to estimate the offline weights. As explained in the third row of Table2, 4608 composite
images were used in each sensor by setting the specific parameters, such as PSNR, blurring level (σ),
rotation jitter, and translation jitter.
In the case of the test DB, four types of DB were prepared by adding noise, blur, rotation jitter, and translation jitter to determine the effects of the image variations on the fusion-based target recognition.
The number of test DB per test condition was 4608, which is the same number of target templates for an individual sensor.
Depression angle: 75°
AMX10_RC audi Bmp3
bus clio Firetruck1 fordtransit
jeep leclerc oiltanker radarcamo
T72 tmm Vabobsactive sa9inchcamo
AMX10 AMX10_RC audi Bmp3
bus clio Firetruck1 fordtransit
jeep leclerc oiltanker radarcamo
T72 tmm Vabobs active sa9inchcamo
AMX10
Depression angle: 20°
(a) (b)
Figure 11.Composition of the SAR-IR target database: (a) 16 SAR targets (top) and 72 aspect views of T72 at the depression angle 20◦(bottom); (b) corresponding 16 IR targets (top) and 72 aspect views of T72 at the depression angle 75◦(bottom).
Table 2.Composition of the train, evaluation, and test SAR-IR DB.
Mode Type SAR IR
Train Depression angle 10,15,20,25 ◦ 65,70,75,80◦ Aspect angle 5◦ 5◦ Image size 64×64 96×96 Total no. of DB 4608 4608 Evaluation Composite 4608 @ PSNR = 34.2 dB, σ= 1, Rot. jitter: ±1◦, Tran. jitter:±1 pixel
4608 @ PSNR = 17.3 dB, σ= 1, Rot. jitter: ±2◦, Tran. jitter:±2 pixel
Test
Noise PSNR = 14∼18.5 dB PSNR: 14∼18.5 dB
Blur σ= 1.0∼3.4 σ= 1.0∼3.4
Rotation jitter uniform:±1∼±5◦ uniform:±1∼±5◦
Translation jitter uniform:±0∼±3 pixel uniform:±0∼±3 pixel 4.2. Comparison of Base Classifiers
A comparison of the base classifiers should be conducted before a fusion-based ATR evaluation. Three types of base classifiers were selected considering the recognition framework. The first base
classifier was the IR-CNN presented in this paper based on the LeNet architecture [62]. The IR-CNN can learn the feature extractor and classifier simultaneously in a network. The second base classifier is
Transfer learning using the AlexNet and SVM [67,68]. The feature was extracted from the pre-trained
AlexNet and the classification was conducted by SVM. This method can be useful when the size of the training DB is small. The last base classifier is the HOG-SVM, which is popular in object detection and classification [16]. HOG is a hand-crafted orientational feature based on the SIFT. The IR-CNN is a fully automatic classifier and the HOG-SVM is a classical classifier. Transfer learning is a hybrid framework by compromising both sides. Three base classifiers were trained using the training DB (4608), as shown
in Table2. Test images (4608) were prepared by adding Gaussian noise only, as shown in Figure12
(bottom). According to the evaluation, the HOG-SVM showed the worst performance followed by
Transfer learning, as shown in Figure12. The proposed IR-CNN showed noise resistive performance
due to the stochastic gradient descent and dropout method during deep learning. The HOG-SVM is based on gradient information to estimate the orientation, which leads to poor performance to noise. In the case of Transfer learning, the feature extractor, AlexNet, is learned from millions of RGB images not IR images, which results in poor recognition performance in a low SNR. Therefore, this study used the IR-CNN-based base classifier for IR ATR and the SAR-CNN for SAR ATR in the performance evaluation of fusion-based target recognition.
68.1dB 48.1dB
34.2dB 24.6dB
PSNR
Figure 12. Performance comparison between IR-CNN, transfer learning, and HOG-SVM on the IR database.
4.3. Analysis of CNN Training
The parameter analysis related to CNN training is important for successful target recognition. In this subsection, the effects of the database size on the recognition rate and training time were
evaluated because the total number of weight parameters of IR-CNN is huge (668,656). Figure13a
shows the training effect according to the number of DB sizes. In this evaluation, IR-CNN is trained using the batch size of 150 and an epoch of 40 with a DB size interval of 450. A noisy test set (4608) is applied to check the training level. If the number of training image is larger than 4000, IR-CNN shows
a 99% correct recognition rate. Figure13b shows the required training time according to the number
of training images. The process took 156.8 s to learn 4608 images on a deep learning platform (GPU: NVIDIA GTX1080ti, CPU: i7-5820K, RAM: 128 GB). In the testing phase, approximately 5 ms were
%DWFKVL]HHSRFKLQWHUYDOWHVWQRLVH 7HVWWLPH PV[19,',$*7;WL*%L. D E 7UDLQLQJ'%VL]H 7UDLQLQJ'%VL]H $&)&1135BSDUDBGE6L]HBWHVWBP\'%BP
Figure 13.Training parameter analysis: (a) recognition rate vs. training DB size; (b) training time vs. training DB size.
5. Experimental Results
The SAR-CNN and IR-CNN were trained using the 4608 SAR images and 4608 IR images.
Figure14presents the training curves in terms of the objective function, top 1 error, and top 5 error.
Although the IR-CNN showed a 0 top 1 error after 20 epochs, the SAR-CNN showed some residual error (0.3) after 80 epochs, which originated from the low signal-to-noise ratio due to the SAR speckle noise.
(a) (b)
Figure 14.Training results: (a) SAR-CNN; (b) IR-CNN.
In the performance evaluation, the two baseline classifiers (SAR-CNN only (SC), IR-CNN only
(IC)), and six fusion frameworks (Fusion using alpha only (α-sum), Fusion using beta only (β-sum),
Fusion using alpha+beta (αβ-sum, proposed linear fusion scheme I), Bayesian fusion (BF) [57], Fusion
using neural network (NN), and Fusion using alpha+beta neural network (αβ-NN, proposed nonlinear
fusion scheme II)) were compared. In the implementation of the Bayesian fusion, the prior is assumed to be uniform and the SAR and IR sensors are independent, which makes Bayesian fusion possible by the product of two output probability distributions. In the case of the neural network, the weights
in the layers are learned using the evaluation set, as shown in Table2. Four types of test sets, such
as Noise, Blur, Rotation jitter, and Translation jitter, were prepared, as indicated in Table2(bottom
row). These image variations occur frequently in outdoor ATR applications because of the sensor noise, imaging platform, and weather conditions. The default control parameters for the SAR and IR test DB
were set as follows: Peak Signal-to-Noise Ratio (PSNR) = 22 dB,σ(Gaussian blur) = 1, Rotation jitter
The first evaluation was conducted by varying the SAR/IR image noise. Speckle noise and
thermal noise exist in the SAR and IR images, respectively. Figure15compares the noise distribution
of the real SAR image (MSTAR) and synthesized SAR image (SE-RAY-SAR). Note that the synthesized SAR images already have K-distribution and it is a second best choice to add Gaussian noise for the simplicity of experiments.
067$5 6(5$<6$5
D E
Figure 15. Analysis of SAR noise: (a) K-distribution of a MSTAR SAR image; (b) K-distribution of synthesized SAR image.
The PSNR changed from 14.3 [dB] to 18.5 [dB] and 4608 images per specific PSNR were generated
by adding Gaussian noise to the training DB, as shown in Figure16b. Figure16a presents the results of
the performance comparison. The SC method showed the worst target recognition results followed by
IC. In the fusion methods, the proposed linear fusion scheme (αβ-sum) showed the best performance
among the linear fusion schemes. Interestingly,α-sum fusion (offline) was better than theβ-sum fusion
when PSNR was below 17.2 [dB]. On the other hand, the situation is reversed when the PSNR is higher than 17.2 [dB], as shown in Figure16a. In a noisy environment, alpha (offline sensor reliability) plays a crucial role in SAR-IR fusion. The BF (Bayesian Fusion) showed similar performances to
theα-sum fusion. Althoughαβ-sum fusion showed good performance compared to the other linear
fusion schemes, nonlinear fusion using a neural network (NN) outperformed it. If double weights are
used in the neural network input (αβ-NN), the recognition performance is upgraded by 1.13% points,
on average, at PSNR 16.3 dB. The confusion matrices of the eight ATR methods can be compared,
as shown in Figure17, which were obtained at PSNR = 16.3 [dB]. The recognition accuracy of each
target can be compared for each method. Note that the proposed linear fusion scheme I (αβ-sum) can
upgrade the recognition performance for all the labels among the linear fusion schemes. For example, the recognition accuracy of the leclerc target changes to 34.4%, 71.9%, 79.9%, 78.8%, 87.8%, and 83.0%,
for SC, IC,α-sum,β-fusion,αβ-sum, and BF, respectively. In addition, the proposed nonlinear fusion
scheme II (αβ-NN) showed the best performance. This is even better than theαβ-sum fusion by 8.94%
points, on average. 3615>G%@ 6$5RQO\ ,5RQO\ )XVLRQ VXP )XVLRQ VXP )XVLRQ VXP )XVLRQ%D\HVLDQ )XVLRQ11 )XVLRQ 11 E D G% G% G% ,5 6$5
Figure 16.Performance evaluation results for noise variations: (a) recognition rate vs signal-to-noise rate [PSNR]; (b) test examples of the SAR and IR images at different PSNRs.
6$5&11RQO\ ,5&11RQO\ )XVLRQE\ĮVXP
)XVLRQE\ĮȕVXP
)XVLRQE\ȕVXP
)XVLRQE\%D\HV )XVLRQE\11 )XVLRQE\Įȕ11
D E F G
H I J K
Figure 17. Confusion matrices at PSNR 16.3 dB: (a) SC; (b) IC; (c)α-sum; (d)β-sum; (e)αβ-sum (proposed linear fusion scheme I); (f) BF [57]; (g) NN; and (h)αβ-NN (proposed nonlinear fusion scheme II).
The second evaluation was conducted by varying the SAR/IR image blur. The SAR image can be blurred by target motion and the IR image can be blurred by sensor motion, lens, and atmospheric
conditions in the real world. The image blurring is performed by the Gaussian filter by changing theσ
parameter, as shown in Figure18b. The blur parameter (σ) changes from 1.0 to 3.4 and 4608 images per
specific parameter were generated by applying Gaussian filtering to the training DB. Figure18a shows
the results of the performance comparison. The SC method showed the worst target recognition results
followed in order by IC,α-sum, andβ-sum. The proposed linear fusion scheme (αβ-sum) showed
the best performance among the linear fusion schemes, as shown in Figure18a. Althoughαβ-sum
fusion showed good performance compared to the other linear fusion schemes, nonlinear fusion using neural network (NN) outperformed them all. If double weights are used in the neural network
input (αβ-NN), the recognition performance was upgraded by 1.04% points, on average, atσ=2.7.
The confusion matrices of the eight ATR methods can be compared, as shown in Figure19, which was
obtained atσ= 2.7. The recognition accuracy of each target was compared for each method. Note that
the proposed linear fusion scheme I,αβ-sum, upgraded the recognition performance for most labels
among linear fusion schemes. For example, the recognition accuracy of the leclerc target changed to
74.7%, 63.9%, 80.2%, 85.1%, 89.2%, and 85.1% for SC, IC,α-sum,β-sum,αβ-sum, and BF, respectively.
In addition, the proposed nonlinear fusion scheme II (αβ-NN) showed the best performance. This was
even better than theαβ-sum fusion, by 3.86% points, on average.
%OXUOHYHO 6$5RQO\ ,5RQO\ )XVLRQ VXP )XVLRQ VXP )XVLRQ VXP )XVLRQ%D\HVLDQ )XVLRQ11 )XVLRQ 11 E D V V V ,5 6$5
Figure 18.Performance evaluation results for blur variation: (a) recognition rate vs blurring level [σ]; (b) test examples of SAR and IR images at different blur levels.
6$5&11RQO\ ,5&11RQO\ )XVLRQE\ĮVXP
)XVLRQE\ĮȕVXP
)XVLRQE\ȕVXP
)XVLRQE\%D\HV )XVLRQE\11 )XVLRQE\Įȕ11
D E F G
H I J K
Figure 19.Confusion matrices at a blur levelσ=2.7: (a) SC; (b) IC; (c)α-sum; (d)β-sum; (e)αβ-sum (the proposed linear fusion scheme I); (f) BF [57]; (g) NN; and (h)αβ-NN (the proposed nonlinear fusion scheme II).
The third evaluation was conducted by varying the SAR/IR image rotation (θ). Ground targets can
move and rotate. Therefore, performance analysis on the rotational variations is required. The training
DB consists of 360◦views with an interval of 5◦. Therefore, the rotated SAR-IR DB can be generated
by adding uniform rotation noise between−kand+k, whose maximum value is 5 (θ∼U(−k,+k)).
Figure20b provides partial examples of rotated SAR and IR images. The rotation parameter (k) changes
from 0 to 5 and 4608 images per specific parameters were generated by an image transformation with a
bilinear interpolation assuming a fixed PSNR (17.0 dB). Figure20a shows the results of the performance
comparison. The SC method showed the worst target recognition results followed by IC,β-sum, BF,
andα-sum. The proposed linear fusion scheme I ((αβ-sum) showed the best performance in all the
test images among the linear fusion schemes, regardless of the rotation parameterk, which originated
from the composition of training DB. Althoughαβ-sum fusion showed good performance compared
to other linear fusion schemes, nonlinear fusion using neural network (NN) outperformed them all.
When double weights were used in the neural network input (αβ-NN), the recognition performance
was upgraded by 0.19% points, on average, at a rotation jitter of 3.5◦. The confusion matrices of
the eight ATR methods were compared, as shown in Figure 21, which was obtained atk = 3.5.
The recognition accuracy of each target was compared for each method. The proposed nonlinear
fusion scheme II (αβ-NN) showed the best performance in rotational variation followed in order by
αβ-sum,α-sum and BF. For example, the recognition accuracy of the tmm target changed to 36.1%,
11.1%, 25.3%, 25.3%, 66.3%, 25.3%, 86.1%, and 92.0% for SC, IC,α-sum, β-sum,αβ-sum (proposed
linear fusion scheme I), BF, NN, andαβ-NN (proposed nonlinear fusion scheme II), respectively.
5RWDWLRQDQJOH>@ 6$5RQO\ ,5RQO\ )XVLRQ VXP )XVLRQ VXP )XVLRQ VXP )XVLRQ%D\HVLDQ )XVLRQ11 )XVLRQ 11 E D ,5 6$5
Figure 20.Performance evaluation results for the rotational variation: (a) recognition rate vs. rotation angle [◦]; (b) test examples of SAR and IR images at different rotation levels.
6$5&11RQO\ ,5&11RQO\ )XVLRQE\ĮVXP
)XVLRQE\ĮȕVXP
)XVLRQE\ȕVXP
)XVLRQE\%D\HV )XVLRQE\11 )XVLRQE\Įȕ11
D E F G
H I J K
Figure 21. Confusion matrices at the rotation anglek = 3.5◦: (a) SC; (b) IC; (c)α-sum; (d)β-sum; (e)αβ-sum (proposed linear fusion scheme I); (f) BF [57]; (g) NN; and (h)αβ-NN (proposed nonlinear fusion scheme II).
The final evaluation was conducted by varying the SAR/IR image translation (tx,ty). SAR and IR
target images can be translated by an inaccurate automatic target detection (ATD) system. Therefore, the effect of image translation on target recognition should be analyzed. The synthetic image translation was performed by applying an image transformation with a bilinear interpolation. The x-axis
translational parameter (tx) and y-axis translational parameter followed a uniform distribution
between−l and+l ((tx,ty) ∼ U(−l,+l)). Figure22b shows the synthesized SAR and IR images atl=2, 3 [pixel]. The translational parameter (l) changed from 0.2 to 3.0 and 4608 images per specific
parameter were generated assuming a fixed PSNR (17 dB). Figure22a presents the results of the
performance comparison. The SC method showed the worst target recognition results followed by
IC,β-sum,α-sum, BF, andαβ-sum fusion (proposed linear fusion scheme I), as shown in Figure22a.
Althoughαβ-sum fusion showed good performance compared to other linear fusion schemes; nonlinear
fusion using neural network (NN) outperformed the other methods. When double weights were used
in the neural network input (αβ-NN), the recognition performance was upgraded by 0.18% points,
on average, at a translation jitter 1.5 pixels. The confusion matrices of the eight ATR methods were
compared, as shown in Figure23, which were obtained atl=1.5. The recognition accuracy of each
target can be compared for each method. Note that the proposedαβ-NN can improve the recognition
performance for most labels. For example, the recognition accuracy of the tmm target changed to
33.0%, 8.0%, 25.0%, 25.3%, 71.9%, 25.3%, 86.5%, and 92.7% for SC, IC,α-sum,β-sum,αβ-sum (proposed
linear fusion scheme I), BF, NN, andαβ-NN (proposed nonlinear fusion scheme II), respectively.
7UDQVODWLRQ>SL[HO@ 6$5RQO\ ,5RQO\ )XVLRQ VXP )XVLRQ VXP )XVLRQ VXP )XVLRQ%D\HVLDQ )XVLRQ11 )XVLRQ 11 SL[HO SL[HO E D ,5 6$5
Figure 22.Performance evaluation results for the translational variation: (a) recognition rate vs. the translation level [pixel]; (b) test examples of SAR and IR images at different translation levels.
6$5&11RQO\ ,5&11RQO\ )XVLRQE\ĮVXP
)XVLRQE\ĮȕVXP
)XVLRQE\ȕVXP
)XVLRQE\%D\HV )XVLRQE\11 )XVLRQE\Įȕ11
D E F G
H I J K
Figure 23.Confusion matrices at the translation level of 1.5 pixels: (a) SC; (b) IC; (c)α-sum; (d)β-sum; (e)αβ-sum (proposed linear fusion scheme I); (f) BF [57]; (g) NN; and (h)αβ-NN (proposed nonlinear fusion scheme II).
Table3compares the performance in terms of the average recognition accuracy extracted from the
confusion matrices shown in Figures17,19,21, and23. Fusion byαcan improve the accuracy using
the offline classifier reliability and Fusion byβcan increase the SAR-CNN and IR-CNN also based
on the online classifier confidence. The proposed linear fusion scheme I (α+β-sum) showed the best
target recognition performance among linear fusion schemes for the four types of image variations.
The proposed nonlinear fusion scheme II (α+β-NN) showed upgraded performance compared to the
linear fusion schemes.
Table 3.Performance comparison of the ATR methods in terms of the average accuracy for the four types of image variations.
Method Noise Test [%] Blur Test [%] Rot. Test [%] Trans. Test [%]
Linear SAR-CNN (SC) 57.81 51.43 67.14 61.32 IR-CNN (IC) 75.15 69.11 73.41 74.95 Fusion:α-sum 82.20 78.52 85.13 84.22 Fusion:β-sum 79.43 78.67 84.04 83.76 Fusion:αβ-sum 88.89 89.49 91.08 91.36 Bayesian fusion (BF) [57] 81.92 78.71 84.07 83.76 Nonlinear Fusion: NN 96.70 92.31 97.61 98.11 Fusion:αβ-NN 97.83 93.35 97.80 98.29 6. Conclusions
Recognizing the ground targets any-time and under any weather condition is important for homeland security and defense. This paper presented a novel SAR (active) and IR (passive) image information fusion method for automatic target recognition based on an offline classifier reliability and online classifier confidence in a weighted sum-based fusion framework, called the Double Weight-based SAR and IR Fusion (DW-SIF). A novel SAR and IR image database (4608 per sensor) was constructed using an OKTAL-SE simulator for 16 ground targets. A LeNet-based classifier architecture was presented; the optimized IR-CNN showed much better target classification performance than the
Transfer learning and HOG-SVM in the noise test. The offline weights (αSAR,αIR) were estimated by
applying SAR-CNN and IR-CNN to the evaluation DB. The online weights (βSAR,βIR) were estimated
by applying Entropy to the SAR/IR probability distributions. According to the performance evaluation results for the four types of image variation experiments (noise, blur, rotation jitter, and translation
jitter), the proposed linear fusion scheme I (αβ-sum) method showed the best target recognition
performance among the linear fusion schemes, such as the SAR-CNN only, IR-CNN only, Fusion by alpha, Fusion by beta, Fusion by alpha+beta, and Bayesian fusion. Furthermore, the proposed nonlinear
fusion scheme II (αβ-NN) showed much better performance than the linear fusion approaches.
Acknowledgments: This research was supported by Basic Science Research Program through the National Research Foundation of Korea(NRF) funded by the Ministry of Education (NRF-2016R1D1A1B03930076). The research was also supported by the STRL (Sensor Target Recognition Laboratory) program of Defense Acquisition Program Administration and Agency for Defense Development.
Author Contributions:The contributions were distributed between authors as follows: Sungho Kim wrote the text of the manuscript, programmed the target recognition and fusion methods. Woo-Jin Song and So-Hyun Kim provided the SAR/IR database, operational scenario, performed the in-depth discussion of the related literature, and confirmed the accuracy experiments that are exclusive to this paper.
Conflicts of Interest:The authors declare no conflict of interest. References
1. Bhanu, B. Automatic target recognition: State of the art survey. IEEE Trans. Aerosp. Electron. Syst.1986, 22, 364–379.
2. Ratches, J.A. Review of current aided/automatic target acquisition technology for military target acquisition tasks. Opt. Eng.2011,50, 072001.
3. Kim, S. High-speed incoming infrared target detection by fusion of spatial and temporal detectors.Sensors 2015,15, 7267–7293.
4. Yang, D.; Li, X.; Xiao, S. Ground targets detection and tracking based on integrated information in infrared images. In Proceedings of the IEEE 10th International Conference on Signal Processing (ICSP), Beijing, China, 24–28 October 2010; pp. 910–915.
5. Khan, J.F.; Alam, M.S. Target detection in cluttered forward-looking infrared imagery. Opt. Eng. 2005, 44, 076404.
6. Ye, W.; Paulson, C.; Wu, D. Target detection for very high-frequency synthetic aperture radar ground surveillance. IET Comput. Vis.2012,6, 101–110.
7. Kaplan, L. Improved SAR target detection via extended fractal feature. IEEE Trans. Aerosp. Electron. Syst. 2001,37, 436–451.
8. Cooke, T.; Redding, N.; Schroeder, J.; Zhang, J. Comparison of selected features for target detection in synthetic aperture radar imagery. Digit. Signal Process.2000,10, 286–296.
9. Kim, S.; Song, W.J.; Kim, S.H. Robust ground target detection by SAR and IR sensor fusion using adaboost-based feature selection.Sensors2016,16, 1117.
10. Wegner, J.D.; Inglada, J.; Tison, C. Automatic fusion of SAR and optical imagery based on line features. In Proceedings of the 7th European Conference on Synthetic Aperture Radar, Friedrichshafen, Germany, 2–5 June 2008; pp. 1–4.
11. Jaeger, U.; Maier-Herburger, H.; Stahl, C.; Heinze, N.; Willersinn, D. IR and SAR automatic target detection benchmarks. Proc. SPIE2004,5426, 400–408.
12. Lamdan, Y.; Wolfson, H.J. Geometric hashing: A general and efficient model-based recognition scheme. In Proceedings of the 2nd International Conference on Computer Vision, Tampa, FL, USA, 5–8 December 1988; pp. 238–249.
13. Bharadwaj, P.; Carin, L. Infrared-image classification using hidden Markov trees. IEEE Trans. Pattern Anal. Mach. Intell.2002,24, 1394–1398.
14. Quan, L.; Jianjun, Z. Wavelet-based feature extraction and recognition of infrared target. In Proceedings of the First International Conference on Innovative Computing, Information and Control, Beijing, China, 30 August–1 September 2006; pp. 1–4.
15. Gray, G.J.; Aouf, N.; Richardson, M.A.; Butters, B.; Walmsley, R.; Nicholls, E. Feature-based target recognition in infrared images for future unmanned aerial vehicles. J. Battle Field Technol.2011,14, 27–36.
16. Zhan, T.; Sang, N. Forward-looking infrared target recognition based on histograms of oriented gradients. Proc. SPIE2011,8003, 80030S.
17. Sadjadi, F.A.; Mahalanobis, A. Robust automatic target reconition in FLIR Imagery. Proc. SPIE2012, 8391, 839105.
18. Zhang, F.; Liu, S.; Wang, D.; Guan, W. Aircraft recognition in infrared image using wavelet moment invariants. Image Vis. Comput.2009,27, 313–318.
19. Li, L.; Ren, Y. Infrared target recognition based on combined feature and improved adaboost algorithm. Adv. Intell. Soft Comput.2011,105, 707–712.
20. Zhou, J.; Cheng, Z.S.X.; Fu, Q. Automatic target recognition of SAR images based on global scattering center model. IEEE Trans. Geosci. Remote Sens.2011,49, 3713–3729.
21. Freeman, A. The effects of noise on polarimetric SAR data. Geosci. Remote Sens. Symp. 1993, 799–802, doi:10.1109/IGARSS.1993.322215.
22. Kreithen, D.E.; Halversen, S.D.; Owirka, G.J. Discriminating targets from the clutter. Linc. Lab. J.1993, 6, 11–24.
23. Han, P.; Wu, J.; Wu, R. SAR Target feature extraction and recognition based on 2D-DLPP. Phys. Procedia 2012,24, 1431–1436.
24. Vasuki, P.; Mohamed, S.; Roomi, M. Automatic target recognition for SAR images by discrete wavelet features.Eur. J. Sci. Res.2012,80, 133–139.
25. Haddadi, A.; Sahebi, M.R.; Mansourian, A. Polarimetric SAR feature selection using a genetic algorithm using a genetic algorithm. Can. J. Remote Sens.2011,37, 27–36.
26. Verbout, S.M.; Irving, W.W.; Hanes, A.S. Improving a template-based classifier in a SAR automatic Target Recognition System by Using 3-D Target information. Linc. Lab. J.1993,5, 53–76.
27. Zhang, H.; Nasrabadi, N.M.; Zhang, Y.; Huang, T.S. Multi-view automatic target recognition using joint sparse representation. IEEE Trans. Aerosp. Electron. Syst.2012,48, 2481–2497.
28. Potter, L.C.; Moses, R.L. Attributed scattering centers for SAR ATR.IEEE Trans. Image Process.1997,6, 79–91. 29. Kahler, B.; Blasch, E. Predicted radar/optical feature fusion gains for target identification. In Proceedings of the IEEE 2010 National Aerospace and Electronics Conference (NAECON), Fairborn, OH, USA, 14–16 July 2010; pp. 405–412.
30. Stephan, L.; Childs, M.; Pujara, N. Portable, scalable architecture for model-based FLIR ATR and SAR/FLIR fusion.Proc. SPIE1999,3718, 79–87.
31. Childs, M.B.; Carlson, K.M.; Pujara, N. Transition from lab to flight demo for model-based FLIR ATR and SAR-FLIR fusion. Proc. SPIE2000,4050, 294–305.
32. Latger, J.; Cathala, T.; Douchin, N.; Goff, A.L. Simulation of active and passive infrared images using the SE-WORKBENCH.Proc. SPIE2007,6543, 654302.
33. Schwenger, F.; Grossmann, P.; Malaplate, A. Validation of the thermal code of RadTherm-IR, IR-Workbench, and F-TOM.Proc. SPIE2009,7300, 73000J.
34. Goff, A.L.; Cathala, T.; Latger, J. New impressive capabilities of SE-workbench for EO/IR real-time rendering of animated scenarios including flares. Proc. SPIE2015,9653, 965307.
35. Beaven, S.G.; Yu, X.; Hoff, L.E.; Chen, A.M.; Winter, E.M. Analysis of hyperspectral infrared and low frequency SAR data for target classification. Proc. SPIE1996,2759, 121–130.
36. Brooks, R.R.; Iyengar, S.S. Multi-Sensor Fusion: Fundamentals and Applications with Software; Prentice Hall: Upper Saddle River, NJ, USA, 1998.
37. Klein, L.A.Sensor and Data Fusion: A Tool for Information Assessment and Decision Making, 2nd ed.; SPIE Press: Bellingham, WA, USA, 1998.
38. Bai, Q.; Jin, C. Image Fusion and recognition based on Compressed Sensing Theory. Int. J. Smart Sens. Intell. Syst.2015,8, 159–180.
39. Li, H.; Zhou, Y.T.; Chellappa, R. SAR/IR sensor image fusion and real-time implementation. In Proceedings of the IEEE Proceedings of ASILOMAR-29, Pacific Grove, CA, USA, 30 October–1 November 1996; pp. 1121–1125.
40. Zhou, Y. Multi-sensor image fusion. In Proceedings of the International Conference on Image Processing, Austin, TX, USA, 13–16 November 1994; Volume I, pp. 193–197.
41. Novak, L.M.; Owirka, G.J.; Brower, W.S.; Weaver, A.L. The automatic target recognition system in SAIP. Linc. Lab. J.1997,10, 187–202.
42. Chul Kim, J.; Ran Lee, Y.; Hee Kwak, S. The Fusion of SAR images and Optical images, based on the use of Wavelet Transform: To Improve Classification Accuracy. Proc. SPIE 2005,5980, 59800K.
43. Amarsaikhana, D.; Blotevogel, H.H.; van Genderen, J.L.; Ganzorig, M.; Gantuya, R.; Nergui, B. Fusing high-resolution SAR and optical imagery for improved urban land cover study and classification. Int. J. Image Data Fusion2010,1, 83–97.
44. Lehureau, G.; Campedel, M.; Tupin, F.; Tison, C.; Oller, G. Combining SAR and optical features in a SVM classifier for man-made structures detection. In Proceedings of the IEEE Geoscience and Remote Sensing Symposium (IGARSS), Cape Town, South Africa, 12–17 July 2009; Volume III, pp. 873–876.
45. Lei, L.; Su, Y.; Jiang, Y. Feature-based classification fusion of vehicles in high-resolution SAR and optical imagery. Proc. SPIE2005,6043, 604323.
46. Yitayew, T.G.; Brekke, C.; Doulgeris, A.P. Multisensor data fusion and feature extraction for forestry applications. In Proceedings of the IEEE Geoscience and Remote Sensing Symposium (IGARSS), Munich, Germany, 22–27 July 2012; pp. 4982–4985.
47. Camps-Valls, G.; Matasci, G.; Kanevskie, M. Learning relevant image features with multiple-kernel classification.IEEE Trans. Geosci. Remote Sens.2010,48, 3780–3791.
48. Yang, J.; Lu, Z.G.; Guo, Y.K. Target recognition and tracking based on data fusion of radar and infrared image sensors. In Proceedings of the 2nd International Conference on Information Fusion (FUSION’99), Sunnyvale, CA, USA, 6–8 July 1999; pp. 1–6.
49. Foucher, S.; Germain, M.; Boucher, J.M.; Benie, G.B. Multisource classification using ICM and dempster-shafer theory.IEEE Trans. Instum. Meas.2002,51, 277–281.
50. Khoshelham, K.; Nedkov, S.; Nardinocchi, C. A comparison of bayesian and evidence-based fusion methods for automated building detection in aerial data. Int. Arch. Photogramm. Remote Sens. Spat. Inf. Sci.2009, 37, 1183–1188.
51. Waske, B.; Benediktsson, J.A. Fusion of support vector machines for classification of multisensor data. IEEE Trans. Geosci. Remote Sens.2007,45, 3858–3866.
52. Kasapoglu, N.G.; Eltoft, T. Decision fusion of classifiers for multifrequency PolSAR and optical data classification. In Proceedings of the 2013 6th International Conference on Recent Advances in Space Technologies (RAST), Istanbul, Turkey, 12–14 June 2013; pp. 411–416.
53. Fard, T.A.; Hasanlou, M.; Arefi, H. Classifier fusion of high-resolution optical and synthetic aperture radar (SAR) satellite imagery for classification in urban area. In Proceedings of the 1st ISPRS International Conference on Geospatial Information Research, Tehran, Iran, 15–17 November 2014; Volume XL-2/W3, pp. 25–29.
54. Ma, L.; Liu, X.; Song, L.; Zhou, C.; Zhao, X.; Zhao, Y. A new classifier fusion method based on historical and on-lineclassification reliability for recognizing common CT imaging signs oflung diseases Ling.Comput. Med. Imaging Graph.2015,40, 39–48.
55. Chureesampant, K.; Susaki, J. Multi-temporal SAR and optical data fusion with texture measures for land cover classification based on the Bayesian theory. ISPRS SC Newlett.2008,5, 1183–1188.
56. Soda, P.; Iannello, G. Aggregation of classifiers for staining pattern recogni-tion in antinuclear autoantibodies analysis. IEEE Trans. Inf. Technol. Biomed.2009,13, 322–329.
57. Gupta, L.; Chung, B.; Srinath, M.D.; Molfese, D.L.; Kook, H. Multichannel fusion models for the parametric classification of differential brain activity.IEEE Trans. Biomed. Eng.2005,52, 1869–1881.
58. Krizhevsky, A.; Sutskever, I.; Hinton, G.E. ImageNet classification with deep convolutional neural networkse. In Proceedings of the Advances in Neural Information Processing Systems, Lake Tahoe, Nevada, 3–6 December 2012; pp. 1–9.
59. Snoek, J.; Rippely, O.; Swerskyx, K.; Kirosx, R.; Satishz, N.; Sundaramz, N.; Patwaryz, M.M.A.; Prabhat, M.; Adams, R.P. Scalable bayesian optimization using deep neural networks. In Proceedings of the International Conference on Machine Learning, Lille, France, 7–9 July 2015; Volume 37.
60. Zhao, F.; Liu, Y.; Huo, K. Radar target recognition based on stacked denoising sparse autoencoder.J. Radars 2017,6, 149–156.
61. Gottimukkula, V.C.R. Object Classification Using Stacked Autoencoder and Convolutional Neural Network. Master’s Thesis, North Dakota State University, Fargo, ND, USA, 2016.
62. Wang, X. Deep learning in object recognition, detection, and segmentation. Found. Trends Signal Process. 2016,8, 217–382.
63. Chen, S.; Wang, H.; Xu, F.; Jin, Y.Q. Target classification using the deep convolutional networks for SAR images. IEEE Trans. Geosci. Remote Sens.2016,54, 4806–4817.
64. Vedaldi, A.; Lenc, K. MatConvNet: Convolutional neural networks for MATLAB. In Proceedings of the 23rd ACM International Conference on Multimedia, Brisbane, Australia, 26–30 October 2015; pp. 689–692. 65. Protopapadakis, E.; Voulodimos, A.; Doulamis, A.; Doulamis, N.; Dres, D.; Bimpas, M. Stacked
autoencoders for outlier detection in over-the-horizon radar signals. Comput. Intell. Neurosci. 2017, 2017, doi:10.1155/2017/5891417.
66. Feng, X.; Haipeng, W.; Yaqiu, J. Deep learning as applied in SAR target recognition and terrain classification. J. Radars2017,6, 136–148.
67. Akcay, S.; Kundegorski, M.E.; Devereux, M.; Breckon, T.P. Transfer learning using convolutional neural networks for object classification within X-ray baggage security imager. In Proceedings of the 2016 IEEE International Conference on Image Processing (ICIP), Phoenix, AZ, USA, 25–28 September 2016; pp. 1057–1061.
68. Huang, Z.; Pan, Z.; Lei, B. Transfer learning with deep convolutional neural network for SAR target classification with limited labeled data. Remote Sens.2017,9, 907.
© 2018 by the authors. Licensee MDPI, Basel, Switzerland. This article is an open access article distributed under the terms and conditions of the Creative Commons Attribution (CC BY) license (http://creativecommons.org/licenses/by/4.0/).