Data-Driven Business Models in Logistics: A Taxonomy of Optimization and
Visibility Services
Abstract
The nature of business conduct is changing due to emerging digital technologies and the ever-increasing role of data as a critical resource. Traditional industry branches such as logistics need to adapt accordingly to keep up with change through digitization and to design adequate business models using data. The present article focuses on investigating the anatomy of these data-driven business models in the logistics sector. In order to achieve this goal, the study develops a taxonomy of data-driven business models in logistics. Start-ups serve as the frame of reference, as they are particularly suitable for deriving explicitly novel and vital business models. The study focuses on two particular types of data-driven business models, namely those offering visibility or optimization services in logistics. The goal of the taxonomy is to uncover the structural composition of such business models and to make the results usable as a morphology for innovation.
1. Introduction
The continuously progressing penetration of all industry sectors with digital technology comes alongside new challenges that enterprises need to face [56]. The sheer unrestricted availability of data leads to the emergence of new data-based services and corresponding business models. In the literature, commonly, these business models are termed data-driven business models and designate those business models which explicitly use data as the central resource [15, 24]. Data, by nature, are disruptive, as they, contrary to physical assets, may be moved
around easily, which has substantial implications about their intercompany commercial use [59]. Data-driven or digital services are also independent of the specific shape of the device, as well as reproducible at almost zero marginal cost [32, 49, 54, 56].
Based on prior findings published by us in [36], in the context of the logistics sector, these data-driven business models usually instantiate through businesses focusing mainly on providing supply chain visibility through tracking services and optimization of resource deployment or routes. These are well-recognized as trend-setting both in academia [20, 36] and in the managerial context [43]. Visibility in this regards refers to the data-based creation of transparency through tracking of assets or events and the generation of information and insights from that process [58]. Optimization refers to the data-based solution of combinatorial problems in order to find the best possible solution, e.g., the best route for a moving object, depending on the objective [8].
The object of consideration are logistics start-ups, as these, even if not exclusively, are often at the forefront of innovation and, contrary to established businesses, often have clearly differentiable and identifiable business models [9, 15, 23]. The use of start-ups, however, severely limits the educational value concerning the commercial success of the business models [24], which is why the study does not claim to make a statement of that sort.
As of now, general taxonomies investigating the anatomy of data-driven business models decoupled from a specific industry exist [15, 23, 24]. However, even though there is high value in generating generic taxonomies, as that these favor transferability to different application scenarios, branch-specific taxonomies enjoy high popularity [27]. In fact, [27 p. Frederik Möller TU Dortmund University Fraunhofer ISST [email protected] [email protected] Maleen Stachon TU Dortmund University [email protected] Christina Hoffmann TU Dortmund University [email protected] Henrik Bauhaus TU Dortmund University [email protected] Boris Otto TU Dortmund University Fraunhofer ISST [email protected] [email protected]
6] argue that taxonomies tailored towards a specific branch provide “greater insights in these particular
sectors.” The design of taxonomies has merit for multiple reasons, as they enable the user to structure objects in a field of research and give means to establish relationships between them [19]. Also, taxonomies support the creation of a unifying nomenclature, as that it is imperative that objects are mapped based on a unified linguistic and definitory basis [26].
Regarding taxonomies thematizing logistics, there are only larger-scale descriptive systematizations [20] and high-level general taxonomies of logistics business models [35, 36]. To date, to the best of our knowledge, there is no specific taxonomy that explicitly deals with data-driven business models in logistics. Because of the reasoning above, the research question reads as follows:
Research Question: What are the characteristics of data-driven business models in the logistics domain, offering optimization and visibility services?
The paper is structured as follows. The next section introduces the conceptual foundations of (data-driven) business models and business model taxonomies. Following, Section 3 outlines the research approach chosen to achieve the goal of this paper. Section 4 presents a comprehensive taxonomy and details its dimensions and characteristics. Section 5 explicates the findings and shows the main emerging types. Lastly, the paper closes with a discussion of the findings and provides an overview of contributions, limitations, and an outlook for further work.
2. Theoretical Background
2.1 Data-Driven Business Models
While first mentioned in 1957 [7] the term
“business model” gained traction and was coined during the internet boom of the 1990s and has since enjoyed steadily growing academic attention [10]. Despite the numerous academic articles published on the subject, there yet exist vastly differing approaches to defining the term [37]. Due to the application of the concept in the respective delimited research areas of individual scholars, more or less severely diverging definitions emerged in “silos” [53]. Definitions diverge in length, derivation approach, and content [7], with some authors calling for abandoning the cause of searching for a unifying definition as it is not guaranteed that the effort justifies the potential merit [21]. However ambiguous the precise linguistic
formulation might be, for this paper, we follow the general definition of a business model as, firstly, the
“blueprint how a company does business” [39] and, secondly, as the conceptual tool for explaining how a company generates value for customers and revenue from it [1].
Prior work recognizes that there is a lack of shared understanding of what makes a business model “digital” [6]. However, multiple streams of literature emerge thematizing digital business models using different terminology, for example, data-driven business models [15, 24, 25, 29, 50, 57] or platform business models [2, 28, 51]. The lowest common denominator across terms is the use of digital technologies in the business logic and the extraction of value and revenue from data [24, 40, 51].
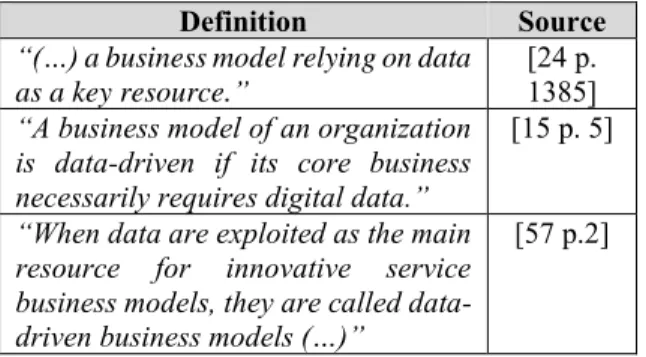
This paper focuses on data-driven business models as a particular type of digital business model [6]. Table 1 shows exemplary definitions from the literature. It is evident that contrarily to the business model concept itself, definitions are quite homogenous, as the characteristic feature of data-driven business models is the focus on data as the core resource [15, 23, 24, 29, 48]. However, there is no clear definition of when exactly a business model is “data-driven” because, today, every company uses data somehow [48]. That leads to the fact that the central element of differentiation lies in the term “key” or synonyms, to describe the position of data as a resource [29]. The transformative process may be seen as a fluid transition that opens up “traditional” enterprises to innovation trajectories in which data can be used in the business model [47, 48]. However, the exact transition from merely using data to using data as the key resource is not clearly defined and is subject to discussion [48].
Table 1. Exemplary definitions of data-driven business models from the literature.
Definition Source
“(…) a business model relying on data as a key resource.”
[24 p. 1385]
“A business model of an organization is data-driven if its core business necessarily requires digital data.”
[15 p. 5]
“When data are exploited as the main
resource for innovative service business models, they are called
data-driven business models (…)”
[57 p.2]
2.2 Business Model Taxonomies
The act of classifying objects to achieve organization and knowledge can be traced back to
ancient times [17]. Classification is the “general
process of grouping entities by similarity” [4 p. 4] and can be subdivided into taxonomies and typologies [3, 4, 30]. Typologies are conceptually derived using a top-down approach with predefined dimensions. Contrarily, taxonomies are derived bottom-up and empirically through induction and observation of a sample of real-world objects, and thus, categories are designed afterward [3, 16]. This distinction is mostly consensual, whereby differences exist in the manner of the development paths [31, 34]. Currently, the literature provides general taxonomies and archetypes of digital business models in logistics [36], general systematizations of start-ups [20], and general taxonomies of data-driven business models [23, 24].
Business models are abstract objects suitable for classifications, as they commonly have characteristics, which can be mapped according to dimensions to be specified [3]. Although data-driven business models are a very young field of research, first general taxonomies exist. For example, [24] and [15] both provide taxonomies analyzing the anatomic structure of data-driven business models.
3. Research Design
3.1 Taxonomy Design
The authors follow the well-accepted and widely disseminated method for taxonomy design of [38] to generate the taxonomy at hand. The method consists of seven steps outlining a rigorous approach to taxonomy design. First, the user must define the meta-characteristic that describes and delimits the ultimate objective of the taxonomy. Every following design activity must be a “logical consequence of the
meta-characteristic” [38 p. 343]. As the method prescribes an iterative design, the user must set end conditions. The present article follows the recommendations of [38] and employs eight objective ending conditions and five subjective endings conditions. In the next step, the method requires the user to take one of two possible paths. First, one can choose the conceptual-to-empirical approach, in which dimensions and characteristics are derived deductively from theory. Second, the user can choose the empirical-to-conceptual approach, which, contrary to the first approach, develops dimensions and characteristics inductively from a given sample of objects.
3.2. Data Collection and Data Selection
The approach to data collection draws from prior work developing taxonomies for business modelsbased on empirical analysis of real-world objects [23, 24, 41]. Therefore, the study relies on the start-up database AngelList as a starting point to extract potential samples and complements the results through findings of additional sources. The selection of suitable samples from AngelList was supported by already existing experiences in previous publications (see [36]). Due to the nature of start-ups, e.g., their possibly temporary nature, general boundary conditions apply with the goal in mind to consider only suitable specimen. The modus operandi of the searching structure is not random but explicitly aims to find suitable specimen, that enables purposeful work towards a theoretical saturation of an explanation of the phenomenon, taking into account the conceptual framework of optimization and visibility services in data-driven logistics [13].
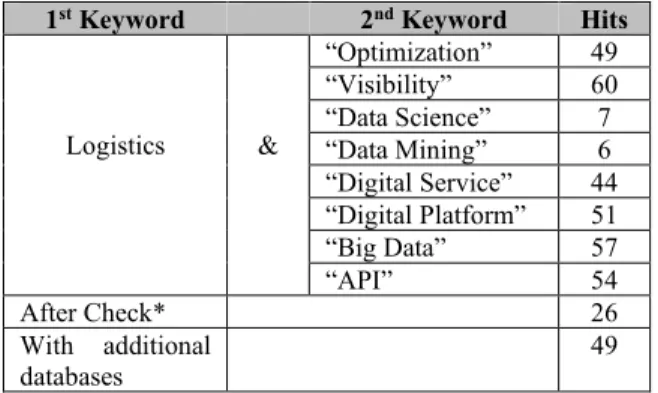
Firstly, the study considers structural boundary conditions as it must be possible to collect enough information about the sample, which is then also sufficiently available, significant, and transparent (no insurmountable language barrier) [12, 41]. The study only includes samples that are suitable insofar; they are still active and have not gone out of business. Secondly, every company must be classifiable as acting in the logistics domain and provide services which may be represented under the keywords listed in Table 2 [12, 51]. The keywords delimit the observation frame onto strictly data-driven business models. The initial sample gathered from AngelList
meeting the strict criteria was too low, which is why additional available data sources extend the original sample. The authors opted to include additional sources to identify related businesses, such as
CrunchBase, scientific literature [20], and online comparison portals, such as Capterra. Even using multiple databases, finding suitable specimen was not an easy task. The final samples consist of forty-nine enterprises, which have met the selection criteria.
The data were collected from publically available sources, i.e., from the respective websites, interviews, articles, blog entries, and visual data (e.g., the
YouTube-channel of the particular business) [5, 18]. This procedure is made possible by the fact that “gross
elements of business models are often quite transparent” [52 p.179]. The existing data, both textual and graphical, were coded and included in a system of tables (in Microsoft Excel) and iteratively generalized. A code, in that regard, means the
“construct that symbolizes and thus attributes interpreted meaning to each datum for later purposes of pattern detection, categorization, theory building, and other analytic processes” [46], which makes it a suitable tool for our purposes. As this way of research relies on publically available data, not every business
could be filled out according to each dimension. Characteristics such as unknown or unspecified have been omitted from Table 5.
Each business was discussed among the authors regarding its suitability against the selection criteria until a consensus was reached. Focusing on start-ups with a single or manageable number of business models allows distilling specific business model patterns as free as possible from external influences [23, 45]. Furthermore, the focus lies on the data-driven services (optimization and visibility), and thus, we exclude platform-type business models, such as marketplaces, digital freight forwarders, warehousing providers, or fulfillment solutions [36].
Table 2. Keywords used for database generation on AngelList. *Reduced by selection criteria.
1st Keyword 2nd Keyword Hits
Logistics & “Optimization” 49 “Visibility” 60 “Data Science” 7 “Data Mining” 6 “Digital Service” 44 “Digital Platform” 51 “Big Data” 57 “API” 54 After Check* 26 With additional databases 49
4. Final Taxonomy
4.1. Meta-Characteristic and Meta-Dimension
The meta-characteristic guides the user to delimit the overarching goal of the taxonomy. In line with the research question, the meta-characteristic reads as follows: “Key Elements of Optimization and Visibilitybased Data-Driven Business Models in Logistics.”
The use of a meta-dimension, i.e., a superordinate conceptual framework for dimensions, supports the targeted derivation of dimensions and characteristics [41]. For this paper, the authors chose to apply the VISOR-framework, as it is one of the few frameworks explicitly focusing on digital business models [14, 41]. Following [6], we see data-driven business models as a subtype of digital business models, which focus explicitly on leveraging data as the key resource. Subsequently, the meta-dimensions are as follows [14]:
• Value Proposition: The value proposition explicates the business models offer, the customer value, and customer segments [14].
• Interface: An interface acts as technological device mediating transactions [55], for example, through Application Programming Interfaces (API). Besides, the term describes the creation of graphical interfaces that can be used by humans in the form of graphical user interfaces (GUI).
• Service Platform: The service platform is a technological device to map business processes digitally. In the framework of [14], the service platform consists, among others, of
key resources and logistical streams.
• Organizing Model: The organizing model describes how the value network of actors and their relationships are organized.
• Revenue Model: The revenue model explicates the logic in which the enterprise at hand generates income from their offering.
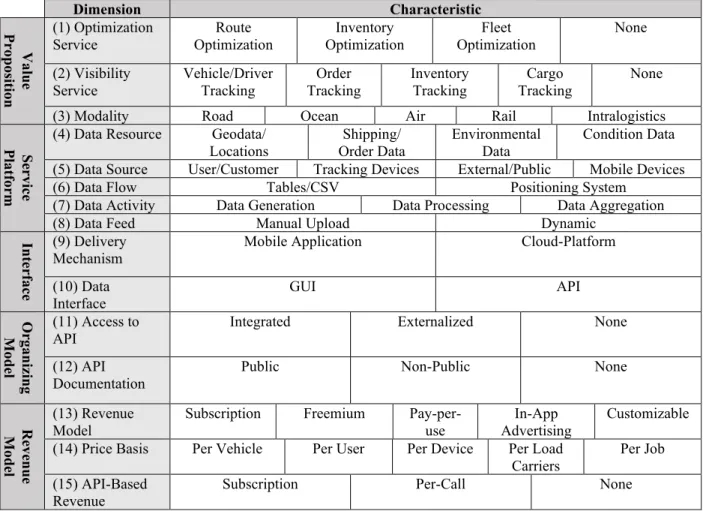
4.2. Taxonomy
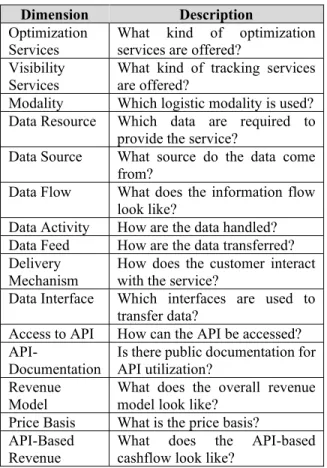
Table 1shows the final taxonomy, which consists of fifteen dimensions and corresponding characteristics span over the five meta-dimensions. Usually, taxonomies employ characteristics that are mutually exclusive [11, 38]. Considering the nature of each characteristic, the authors chose to opt for non-exclusive characteristics in line with a morphological approach [42]. That approach is suitable as it assists the purpose of the taxonomy as a tool for representation of data-driven business models but also as a toolbox for their design. Furthermore, the creation of exclusivity through additional generalization and linguistic adaptation somewhat complicates the result and is not beneficial to a clear depiction of each specimen. Table 3 gives short descriptions phrased as questions to define each dimension of the taxonomy. In designing a taxonomy, one must choose between one of two basic orientations [19]. Firstly, taxonomies might be intended to be applied generally to a broad field, such as the “broader field of BMI” [22 p. 7]. Secondly, taxonomies might be intended to analyze a specific set of objects, sharply restricted by almost atomic characteristics and dimensions, which describe relations in detail. Glass and Vessey expressly point out that industry-specific taxonomies often have few general objectives and are therefore specific [19]. Following that rationale, the taxonomy developed here is defined as specific, as it is tailored for use in the logistics domain, and as it constitutes a detailed complementary view of an existing general taxonomy [36]. To this end, the general taxonomy in [36] examines a broad spectrum of objects using digital business models (general), and the taxonomy
developed here examines a narrow spectrum focused on optimization and visibility services (specific).
Table 3. Dimensions and guiding questions.
Dimension Description
Optimization
Services What kind of optimization services are offered? Visibility
Services What kind of tracking services are offered? Modality Which logistic modality is used? Data Resource Which data are required to
provide the service?
Data Source What source do the data come from?
Data Flow What does the information flow look like?
Data Activity How are the data handled? Data Feed How are the data transferred? Delivery
Mechanism How does the customer interact with the service? Data Interface Which interfaces are used to
transfer data?
Access to API How can the API be accessed? API-
Documentation Is there public documentation for API utilization? Revenue
Model
What does the overall revenue model look like?
Price Basis What is the price basis? API-Based
Revenue What does the API-based cashflow look like?
4.3 Value Proposition
Based on prior research and in alignment with the given definition and viewing frame, the study focuses on two dominant and overarching data-driven services as the basis for most business models either stand-alone or in combination. Firstly, start-ups focus on providing optimization of logistical processes, such as
Route Optimization, Inventory Optimization, or Fleet Optimization. These data-driven Optimization Services (1) rely on gathering data either directly from the logistical process through using added hardware in the shape of tracking devices, mobile devices of drivers or through the manual upload of data. Fleet Optimization is given a superordinate term and describes holistic optimization offers, e.g., routes, procurement, inventory, and more. Secondly, Visibility (2) refers to creating transparency of the entire supply chain or parts of it, such as individual vehicles. These types of services instantiate as tracking services for, e.g., Vehicles, Orders, Cargo, or
Inventory. A central element of logistical processes is
how they are executed. Characteristics of the dimension Modality (3), hence, are Truck, Ship, Rail, Air, and Intralogistics, which are typical modalities in logistics [35].
4.4 Service Platform
The position of data as the dominant resource of data-driven business models makes conceptualizing of data-related dimensions paramount.
Firstly, the authors identify four types of Data Resources (4) that the enterprises require for value creation (see Table 4). These data resources refer to processing Geodata, e.g., locations enabling position determination. Secondly, Shipping Data refer to data about deliveries and shipments; for example, aggregated from marine terminals. Environmental data refer to data about environmental conditions, such as temperature or humidity, generated through sensor-equipped devices. Lastly, Condition Data
describes the state of a physical object and aims to guarantee the integrity of the shipment, through monitoring, for example, of shocks and breaches.
Table 4. Data resource characteristics and excerpts of the aggregated content.
Data
Resource Aggregated Content
Geodata/
Locations Addresses, Routes, Position Data, GPS (Global Positioning System) Data, Distances, GSM (Global System for Mobile Communications) Shipping/
Order Data Import/Export Data, Data from Terminals, Order details, Data from shippers
Environme
ntal Data Temperature Data, Humidity, Traffic Condition
Data
Shocks, Breaches, Impacts, Speed Next, the authors follow prior taxonomies of data-driven business models and acknowledge the importance of specifying the Data Source(5) [15, 24]. With regards to logistics, we identify four characteristics serving as a source for data, namely
Tracking Devices, External Data,the User/Customer,
and Mobile Devices (see Table 6). The distinction is broadly in line with parts of the data sources found by [24], namely freely available data, customer-provided data, and tracked and generated data. Though one could argue that an up to date smartphone could be counted as a tracking device, the authors make the distinction, as enterprises either extract data from privately or company-owned mobile devices of the
drivers or from tracking devices that are supplied as part of the service. Mostly, the business model-relevant data are uploaded by the user of the service. Lastly, the characteristic public institution/external
data refers to businesses acquiring data from external sources, for example, shipping terminals or partners in the value creation ecosystem[36].
Table 6. Data source characteristics and excerpts of the aggregated content.
Data Source Aggregated Content
Customer/User Data provided by the user, e.g., addresses
Tracking
Devices Sensory-equipped Truck-integrated telematics devices, devices, other tracking devices Mobile Devices Private or Company-owned
mobile phones, Tablets
External/Public Public Institutions, Terminal, Data from external systems The Data Flow (6) complements data resources and specifies the nature of the data emerging from the
data source. The study distinguishes two types of data flows. Firstly, using CSV (Comma Separated Value) documents and excel spreadsheets for data transfer or using positioning systems, such as GPS, GSM, or comparable positioning technologies.
The dimension Data Activity (7) refers to activities required to transform the data into value. Staying consistent with recent literature, the authors draw from [24] and identify three characteristics as transferable and applicable to the present taxonomy. Firstly, data generation refers to generating data, e.g., through using tracking devices. Secondly, data processing refers to value-adding processing of data resources. Lastly, data aggregation refers to collecting and harmonizing external data into a single source.
The Data Feed (8) may occur in two different ways, manually or dynamic. Dynamic data upload contains non-manual data input, for example, regularly scheduled updates such as minute-by-minute or real-time position transfers. This way of data feed provides a constant stream of data. Secondly, manual input requires users to input data manually through uploading tables or textual based data. Usually, manual data are uploaded in the form of CSV Table 5. Taxonomy of data-driven business models for optimization and visibility services
Dimension Characteristic Va lue P ro po sit io n (1) Optimization
Service Optimization Route Optimization Inventory Optimization Fleet None (2) Visibility Service Vehicle/Driver Tracking Order Tracking Inventory Tracking Cargo Tracking None
(3) Modality Road Ocean Air Rail Intralogistics
Serv ice P la tfo rm
(4) Data Resource Geodata/
Locations Order Data Shipping/ Environmental Data Condition Data (5) Data Source User/Customer Tracking Devices External/Public Mobile Devices
(6) Data Flow Tables/CSV Positioning System
(7) Data Activity Data Generation Data Processing Data Aggregation
(8) Data Feed Manual Upload Dynamic
Inte
rf
ace
(9) Delivery Mechanism
Mobile Application Cloud-Platform
(10) Data Interface GUI API O rg anizi ng M odel (11) Access to
API Integrated Externalized None
(12) API Documentation
Public Non-Public None
Rev enue M odel (13) Revenue Model
Subscription Freemium Pay-per-use
In-App Advertising
Customizable (14) Price Basis Per Vehicle Per User Per Device Per Load
Carriers Per Job (15) API-Based
documents or Excel-spreadsheets containing locations, for example, addresses. These tables may then contain excel-based position data containing latitudes, altitudes, or addresses, which are machine-readable for optimization.
4.5 Interface
The authors distinguish between two types of data interfaces. On the one hand between the Delivery Mechanism (9) via which the customer perceives the product or service and on the other hand, the Data Interface (10) via which the necessary data for value creation is provided. The interaction with the customer either works through a mobile application, a web-based cloud platform or a combination thereof [36, 51]. The data interface relates to how data enters the system, which can be either through a, for example, Google-Maps like Graphical User Interface (GUI) or through Application Programming Interfaces (API).
4.6 Organizing Model
Through a business model lens, the business models vary in the extent to which they allow customers Access to the API (11). On the one hand, businesses either offer the API as a by-product included in the overarching business model. Hence, access is provided as a free complimentary service. On the other hand, access to the API can be a separate business model and clearly distinguished from other services. The authors generalize the modes of API access, respectively as Integrated and Externalized.
The technical implementation of API utilization requires that developers receive APIDocumentation (12) outlining the inner workings of the respective API. That type of documentation often is made accessible via freely available web portals. We distinguish between three characteristics, namely
public,non-public, and none.
4.7 Revenue Model
The findings implicate two revenue models. Firstly, the overarching Revenue Model (13) outlines how the business generates income, namely
Subscription, Freemium,Pay-Per-Use, Customizable,
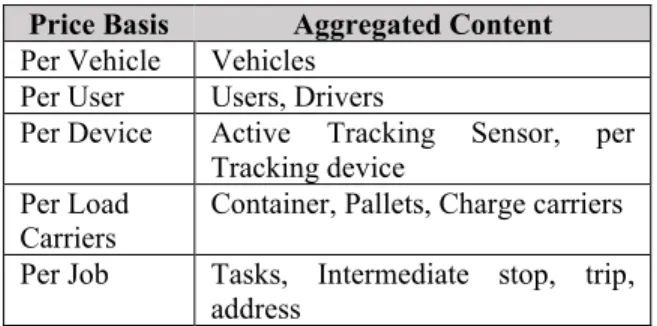
and Advertising. The Price Basis (14) describes how many units of a service or product are included for the price to be paid. The study implies that these are per vehicle, per user,per device, per load carrier, per job. Table 7 shows the aggregated atomic price bases and the respective generalization.
The second stream of revenue models focuses on leveraging API-access. Some enterprises employ a
separate, or externalized, API-based Revenue Model (15). The authors have identified Subscriptions, Pay-per-call, or None as possible characteristics. Pay-per-call, in this regard, means that the enterprises charge API utilization based on the number of calls, where a call is a delimited set of routes planned.
Table 7. Price basis characteristics and excerpts of the aggregated content.
Price Basis Aggregated Content
Per Vehicle Vehicles Per User Users, Drivers
Per Device Active Tracking Sensor, per Tracking device
Per Load
Carriers Container, Pallets, Charge carriers Per Job Tasks, Intermediate stop, trip,
address
5. Discussion
As the characteristics of the taxonomy are not mutually exclusive, identifying a precise percentage distribution is not possible [41]. To identify types, two categories were identified, which are of importance in the field of business models, namely the value proposition and the revenue model. The individual characteristics were replaced with numeric values. For example, if a business offers optimization services, no matter the exact type, the value is set to one. If it does not offer optimization, the value is set to zero. Correspondingly, this procedure applies to visibility services and the revenue model.
Figure 1. Comparison of business model types and revenue models
The revenue models were assigned numerical values of one to five. The revenue models of nine start-ups were not identifiable, which is why these nine companies are not included in the analysis. The remaining companies were subjected to cluster analysis using the statistical programming language R and the package cluster [33]. Three generalized types of data-driven business models were aggregated based on the value proposition and revenue models (see
V is ib il it y O p ti m iz at io n
Advertising Freemium Subscription Pay-per-Use Customizable
1 21 Optimization + Tracking 2 1 1 10 Optimization Tracking 1 2 11
Figure 1). Firstly, one type consists of businesses providing visibility services exclusively. These businesses use tracking devices or mobile phones to generate data, which they process and resell as actionable insights. The second type consists of businesses offering both visibility and optimization services. The way of tracking is often complementary. For example, Routific [44] offers complimentary driver tracking via the mobile application, but the core offer is optimization by uploading addresses as tables and returning optimized routes. The last type is pure optimization services. As Figure 1 shows, there is only one business that offers pure optimization (at least no other indication could be found) by uploading excel-spreadsheets into a browser-based cloud platform.
After an in-depth analysis of the business models, the following vital observations are evident and potentially relevant to conceptualize further avenues for research:
• Most business models rely on generating revenue through subscription-based revenue models (see Figure 1).
• Thirty-eight of the forty-nine businesses provide an API and twenty-six of them supply free and public access to documentation.
• Only three business models generate API-based revenue separately or complementarily.
6. Conclusion, Limitations, and Outlook
The taxonomy detailed in this work provides dimensions and characteristics able to describe data-driven business models in logistics comprehensively.The present work provides several contributions. Firstly, in terms of managerial contributions, the taxonomy enables practitioners to navigate more effectively in the yet mostly unexplored field of data-driven business models. The authors have derived and generated the dimensions alongside central data-driven business model elements and framed them as short questions so that practitioners can go through the individual dimensions and see them as tool support for design. Most of the dimensions are on an atomic or near-atomic level, which favors a realistic configuration of a data-driven business model and only requires the executing of a last instantiating step. The research ties in and builds on prior research on data-driven business models. The taxonomy’s scientific contribution is above all the intensification of the previously generalized work (see, for example, [15, 24, 36, 48]) into a particular domain of application, namely logistics, which, as an industry-specific classification, constitutes a valuable
contribution [27]. Some of the characteristics and dimensions developed in this work draw from prior research, thus further spinning the red paths of development of the field of data-driven business models.
The taxonomy has both practical and scientific added value, although it is naturally subject to limitations. To some extent, as with all qualitative research and coding in general, a taxonomy requires stark generalization and simplification of most complex issues and their interrelationships [46]. Also, the taxonomy is derived empirically from samples consisting mostly of start-ups, which is why transferability of the results cannot be fully guaranteed and is instead an open flank for practice-oriented further research. The way of research, namely desk research, relies on published material, which inevitably means that the results can only build on what is publicly available.
Lastly, the work provides connecting points for further research activities in additional databases. As most businesses provide an API, but only a few explicitly leverage them economically, it would have merit to investigate the role and functionalities of APIs for data-driven business models in logistics further.
7. Acknowledgment
This research was supported by the Excellence Center for Logistics and IT funded by the Fraunhofer-Gesellschaft and the Ministry of Culture and Science of the German State of North Rhine-Westphalia.
8. References
[1] Amit, R. and C. Zott, "Value Creation in e-Business", Strategic Management Journal, 22(6-7), 2001, pp. 493–520.
[2] Asadullah, A., I. Faik, and A. Kankanhalli, "Digital Platforms: A Review and Future Directions", in Proceedings of the 22nd Pacific Asia Conference on Information Systems, Yokohama: Japan. 2018.
[3] Baden-Fuller, C. and M.S. Morgan, "Business Models as Models", Long Range Planning, 43(2-3), 2010, pp. 156– 171.
[4] Bailey, K.D., Typologies and Taxonomies: An Introduction to Classification Techniques, Sage Publications, Thousand Oaks, London, New Dehli, 1994.
[5] Banks, M., Using Visual Data in Qualitative Research, Sage Publications, Los Angeles, London, New Dehli, Singapore, 2018.
[6] Bock, M. and M. Wiener, "Towards a Taxonomy of Digital Business Models – Conceptual Dimensions and
Empirical Illustrations", in Proceedings of the 38th International Conference on Information Systems, Seoul: South Korea. 2017.
[7] Burkhart, T., J. Krumeich, D. Werth, and P. Loos, "Analyzing the Business Model Concept - A Comprehensive Classification of Literature", in Proceedings of the 32nd International Conference on Information Systems, Shanghai: China. 2011.
[8] Cattaruzza, D., N. Absi, D. Feillet, and J. Gonzalez-Feliu, "Vehicle Routing Problems for City Logistics", EURO Journal on Transportation and Logistics, 6, 2017, pp. 51–79.
[9] Criscuolo, P., N. Nicolaou, and A. Salter, "The elixir (or burden) of youth? Exploring differences in innovation between start-ups and established firms", Research Policy, 41(2), 2012, pp. 319–333.
[10] DaSilva, C. and P. Trkman, "Business Model: What It Is and What It Is Not", Long Range Planning, 47(6), 2014, pp. 379–389.
[11] Doty, D.H. and W.H. Glick, "Typologies as a Unique Form of Theory Building: Toward Improved Understanding and Modeling", The Academy of Management Review, 19(2), 1994, pp. 230–251.
[12] Eickhoff, M., J. Muntermann, and T. Weinrich, "What do FinTechs actually do? A Taxonomy of FinTech Business Models", in Proceedings of the 38th International Conference on Information Systems, Seoul: South Korea. 2017.
[13] Eisenhardt, K., "Building Theories from Case Study Research", The Academy of Management Review, 14(4), 1989, pp. 532–550.
[14] El Sawy, O.A. and F. Pereira, Business Modelling in the Dynamic Digital Space an Ecosystem Approach, Springer Heidelberg, 2013.
[15] Engelbrecht, A., J. Gerlach, and T. Widjaja, "Understanding the Anatomy of Data-Driven Business Models - towards an Empirical Taxonomy", in Proceedings of the 24th European Conference on Information Systems, Istanbul: Turkey. 2016.
[16] Fiedler, K.D., V. Grover, and J.T.C. Teng, "An Empirically Derived Taxonomy of Information Technology Structure and Its Relationship to Organizational Structure", Journal of Management Information Systems, 13(1), 1996, pp. 9–34.
[17] Gerber, A., R. Baskerville, and A. van der Merwe, "A taxonomy of classification approaches in IS research", in Proceedings of the 23rd Americas Conference on Information Systems. 2017: Boston: USA.
[18] Ghazawneh, A. and O. Henfridsson, "Balancing Platform Control and External Contribution in Third-Party Development: The Boundary Resources Model", Information Systems Journal, 23(2), 2013, pp. 173–192.
[19] Glass, R.L. and I. Vessey, "Contemporary Application-Domain Taxonomies", IEEE Software, 12(4), 1995, pp. 63– 76.
[20] Göpfert, I. and P. Seeßle, "Startups in der Logistikdienstleisterbranche: Eine Systematisierung der neuen Marktteilnehmer sowie Analyse von deren Auswirkungen auf die Logistikdienstleisterbranche", 2017.
[21] Groth, P. and C. Nielsen, "Constructing a Business Model Taxonomy: Using statistical tools to generate a valid and reliable business model taxonomy", Journal of Business Models, 3(1), 2015, pp. 4–21.
[22] Hanelt, A., B. Hildebrandt, and J. Polier, "Uncovering the Role of IS in Business Model Innovation - A Taxonomy-Driven Approach to Structure the Field", in Proceedings of the 23rd European Conference on Information Systems, Münster: Germany. 2015.
[23] Hartmann, P.M., M. Zaki, N. Feldmann, and A. Neely, Big Data for Big Business? A Taxonomy of Data-driven Business Models used by Start-up Firms, University of Cambridge, Cambridge, 2014.
[24] Hartmann, P.M., M. Zaki, N. Feldmann, and A. Neely, "Capturing Value from Big Data – A Taxonomy of Data-Driven Business Models Used by Start-Up Firms", International Journal of Operations & Production Management, 36(10), 2016, pp. 1382–1406.
[25] Hunke, F., S. Seebacher, R. Schüritz, and A. Illi, "Towards a Process Model for Data-Driven Business Model Innovation", in Proceedings IEEE 19th Conference on Business Informatics (CBI). 2017: Thessaloniki: Greece.
[26] Jacob, E., "Classification and Categorization: A Difference that Makes a Difference", Library Trends, 52, 2004.
[27] Kamprath, M. and B. Halecker, "A Systematic Approach for Business Model Taxonomy-How to operationalize and compare large Quantities of Business Models?", in ISPIM Innovation Symposium, Seoul: South Korea. 2012.
[28] Kouris, I. and R. Kleer, "BUSINESS MODELS IN TWO-SIDED MARKETS: AN ASSESSMENT OF STRATEGIES FOR APP PLATFORMS", in Proceedings of the International Conference on Mobile Business. 2012: Delft: Netherlands.
[29] Kühne, B. and T. Böhmann, "Requirements for Representing Data-Driven Business Models-Towards Extending the Business Model Canvas", in Proceedings of the 24th Americas Conference on Information Systems, New Orleans: USA. 2018.
[30] Lambert, S., "Do We Need a "Real" Taxonomy of e-Business Models?", Flinders University - School of Commerce Research Paper Series(06-6), 2006.
[31] Lambert, S., "The Importance of Classification to Business Model Research", Journal of Business Models, 3(1), 2015, pp. 49–61.
[32] Lycett, M., "‘Datafication’: making sense of (big) data in a complex world", European Journal of Information Systems, 22(4), 2013, pp. 381–386.
[33] Maechler, M., P. Rousseeuw, A. Struyf, M. Hubert, and K. Hornik, "cluster: Cluster Analysis Basics and Extensions. R package version 2.0.7-1", 2018.
[34] Mayr, E., The growth of biological thought: Diversity, evolution, and inheritance, Harvard University Press, 1982.
[35] Meyer, N., D. Horvat, M. Hitzler, and C. Doll, Business models for freight and logistics services, Working Paper Sustainability and Innovation(S08/2018), 2018.
[36] Möller, F., H. Bauhaus, C. Hoffmann, C. Niess, and B. Otto, "Archetypes of Digital Business Models in Logistics Start-Ups", in Proceedings of the 27th European Conference on Information Systems, Uppsala and Stockholm: Sweden. 2019.
[37] Morris, M., M. Schindehutte, and J. Allen, "The Entrepreneur’s Business Model: Toward a Unified Perspective", Journal of Business Research, 58(6), 2005, pp. 726–735.
[38] Nickerson, R.C., U. Varshney, and J. Muntermann, "A Method for Taxonomy Development and its Application in Information Systems", European Journal of Information Systems, 22(3), 2013, pp. 336–359.
[39] Osterwalder, A., Y. Pigneur, and C.L. Tucci, "Clarifying Business Models: Origins, Present, and Future of the Concept", Communications of the Association for Information Systems, 16, 2005, pp. 1–25.
[40] Otto, B., R. Bärenfänger, and S. Steinbuß, "Digital Business Engineering: Methodological Foundations and first Experiences from the Field", 28th Bled eConference: #eWellbeing - Proceedings, 2015, pp. 58–76.
[41] Remane, G., R.C. Nickerson, A. Hanelt, J.F. Tesch, and L.M. Kolbe, "A Taxonomy of Carsharing Business Models", in Proceedings of the 37th Conference on Information Systems, Dublin: Ireland. 2016.
[42] Ritchey, T., "General morphological analysis", in Proceedings of the 16th euro conference on operational analysis. 2016.
[43] Roland Berger, "2016 logistics study on digital business models", 2016.
[44] https://routific.com/#, accessed 6-8-2019.
[45] Sabatier, V., V. Mangematin, and T. Rousselle, "From Recipe to Dinner: Business Model Portfolios in the European Biopharmaceutical Industry", Long Range Planning, 43(2), 2010, pp. 431–447.
[46] Saldaña, J., The coding manual for qualitative researchers, Sage, 2015.
[47] Schüritz, R. and G. Satzger, "Patterns of Data-Infused Business Model Innovation", in Proceedings of the IEEE Conference on Business Informatics. 2016: Paris: France.
[48] Schüritz, R., S. Seebacher, and R. Dorner, "Capturing Value from Data: Revenue Models for Data-Driven Services", in Proceedings of the 50th Hawaii International Conference on System Sciences. 2017: Hawaii: USA.
[49] Shapiro, C., S. Carl, H.R. Varian, and Harvard Business Press, Information Rules: A Strategic Guide to the Network Economy, Harvard Business School Press, 1998.
[50] Sorescu, A., "Data-Driven Business Model Innovation", Journal of Product Innovation Management, 34(5), 2017, pp. 691–696.
[51] Täuscher, K. and S.M. Laudien, "Understanding Platform Business Models: A Mixed Methods Study of Marketplaces", European Management Journal, 36(3), 2018, pp. 319–329.
[52] Teece, D.J., "Business Models, Business Strategy and Innovation", Long Range Planning, 43(2-3), 2010, pp. 172– 194.
[53] Teece, D.J., "Business Models and Dynamic Capabilities", Long Range Planning, 51(1), 2018, pp. 40–49.
[54] Veit, D., E. Clemons, A. Benlian, P. Buxmann, T. Hess, D. Kundisch, J.M. Leimeister, P. Loos, and M. Spann, "Business Models: An Information Systems Research Agenda", Business and Information Systems Engineering, 6(1), 2014, pp. 45–53.
[55] Williamson, O.E., "The Economics of Organization: The Transaction Cost Approach", American Journal of Sociology, 87(3), 1981, pp. 548–577.
[56] Yoo, Y., R.J. Boland, K. Lyytinen, and A. Majchrzak, "Organizing for Innovation in the Digitized World", Organization Science, 23(5), 2012, pp. 1398–1408.
[57] Zolnowski, A., T. Christiansen, and J. Gudat, "Business Model Transformation Patterns of Data-Driven Innovations", in Proceedings of the Twenty-Fourth European Conference on Information Systems (ECIS), Istanbul: Turkey. 2016.
[58] Zrenner, J., A.P. Hassan, B. Otto, and J.C. Marx Gómez, "Data Source Taxonomy for Supply Network Structure Visibility", in Proceedings of the Hamburg International Conference of Logistics (HICL), Hamburg: Germany. 2017.
[59] Zrenner, J., F.O. Möller, C. Jung, A. Eitel, and B. Otto, "Usage control architecture options for data sovereignty in business ecosystems", Journal of Enterprise Information Management, 32(3), 2019, pp. 477–495.