!
!
!
!
"
"
"
"
"
"
"
"
#
#
#
#
!
!
!
!
$
$
$
$
"
""
"
%
&
%
&
%
&
%
&
'
''
'
()*
()*
()*
()*
"
""
" +,,-
+,,-
+,,-
+,,-CAPE VERDE: THE CASE FOR EUROIZATION
João Loureiro
Manuel M. F. Martins
Ana Paula Ribeiro
[email protected] CEMPRE* and Faculdade de Economia, Universidade do Porto
Rua Dr. Roberto Frias s/n, 4200-464 Porto, Portugal
March 2009
Abstract
After 10 years of a fixed exchange rate against the euro and a deepening integration with the European Union (EU), the authorities of Cape Verde maintain a strong commitment to nominal stability and are now considering the official euroization of the country.
Compared to the current pegging, euroization could be costly if the economic conditions of Cape Verde were to require control over the interest rates and the exchange rate. Given the strong economic and financial integration between Cape Verde and Europe, and the fact that Cape Verde records inflation rates at levels that are similar to those of the European Monetary Union (EMU), the relevant issue is whether the European Central Bank (ECB) monetary policy fits the needs of Cape Verde. In order to answer this question, we empirically assess the synchronization between the business cycle of Cape Verde and the business cycle of the EMU. For that purpose, we compute output gaps and then use conventional correlation measures as well as other indicators recently suggested in the literature. Replicating the methodology for each of the current 27 EU members, our results show that Cape Verde ranks better than several EU countries and even better than some EMU countries. We thus argue that there is a strong case for the euroization of Cape Verde. Euroization would secure the benefits already attained with the pegging to the euro and would warrant additional benefits, most likely with no relevant costs stemming from inappropriate ECB monetary policies.
Keywords: Africa, Cape Verde, European Monetary Union, Euroization, Business
Cycles.JEL classification: E32, E58, F44.
* CEMPRE - Centro de Estudos Macroeconómicos e Previsão (centre for macroeconomic and
forecasting studies) - is supported by the Fundação para a Ciência e a Tecnologia (FCT), Portugal.
We acknowledge helpful comments and suggestions by Arne Bigsten and Clas Wihlborg. The usual disclaimer applies.
1. Introduction
Following the exchange agreement established between Cape Verde and Portugal (Acordo de Cooperação Cambial, ACC), in April 1998 the Cape-verdean escudo (CVE) became anchored to the Portuguese escudo (PTE). With the adoption of the euro by Portugal, the ACC has been recognized by the European authorities and the CVE was officially anchored to the euro.1 Since 1 January 1999 the exchange rate has been pegged at 110.265 CVE per euro.
The adoption of this conventional peg had two main purposes. On one hand, it was intended to further stimulate trade, investment and the overall economic and financial relations with Europe. On the other hand, it was intended to ensure an environment of nominal stability and the resulting macroeconomic discipline which, jointly with an emphasis on free markets and private initiative, would promote sustained growth. In fact, pegging to the euro would imply the loss of monetary autonomy by Cape Verde in favour of the European Central Bank’s (ECB) monetary policy. As the ECB is credibly committed to price stability, shadowing the policy of the anchor would warrant low inflation rates.2 The priority to price stability has been later on stated in Law, at the 2002 revision of the statutes of the central bank of Cape Verde (BCV).
Following the decision to peg, the choice of the euro as the reference currency was obvious. On one hand, economic and financial relations between Cape Verde and Portugal, as well as Europe, were already profound as a result of historical and cultural ties – including a common language – and even some geographical proximity. On the other hand, adopting the euro was simply a continuation of a strategy clearly oriented to price stability. In fact, as documented by Honohan and Lane (1999), Cape Verde was one of the few non European countries that have tracked the German mark (DEM) for many years, until the replacement of the DEM by the euro. Given that by the time the ACC agreement was signed it was clear that Portugal was about to join the European
1 The decision was taken by the European Council, following a recommendation of the European Central
Bank. See European Council (1998) and ECB (1999).
2 As is well known, anchoring the domestic currency to that of a large country with a tradition of low
inflation is one of the possible strategies for achieving price stability. See, for example, Giavazzi and Pagano (1988).
Monetary Union (EMU), the agreement can thus be interpreted as instrumental for Cape Verde to become institutionally linked to the euro.
At this point, it should also be noted that Cape Verde has always preferred to take decisions on exchange rate matters in an independent way. For example, pegging to the euro could have been indirectly done by joining the Western African Economic and Monetary Union (WAEMU), as Guinea Bissau did in 1997.3 However, instead of doing it via the regional CFA franc, Cape Verde decided to take a short cut to the euro. Also, in 1999, Cape Verde declined to participate in the West African Monetary Zone (WAMZ), a project that would eventually lead to a single currency for the Economic Community of West African States (ECOWAS), of which Cape Verde is a member. The authorities of Cape Verde are presently considering deepening the current link of the CVE to the euro, and official euroization of Cape Verde is one of the alternatives under debate. This intention has been voiced, among others, by the prime-minister.4 The proposal of a full de jure liberalization of the international capital movements, prior to euroization, has also been raised. Clearly, these steps would mean a strengthened renewal of the two objectives set forth in 1998.
The choice faced by Cape-verdean authorities is between a fixed or a super-fixed exchange rate regime (see LeBaron and McCulloch, 2000). In the case where the latter is chosen and Cape Verde actually liberalizes the capital account, then euroization is the recommended option. In fact, as noted by Obstfeld and Rogoff (1995) and shown by several episodes in the last two decades, conventional fixed exchange rate regimes combined with free capital flows are prone to speculative attacks. Neither sound fundamentals nor foreign exchange credit lines seem to effectively prevent speculation. Even harder fixed exchange rate regimes, such as currency boards, are vulnerable to
As suggested elsewhere in the literature, African countries may achieve the objective of nominal stability through a monetary union, even if lacking individual credibility (e.g., Buigut and Valev, 2009). Furthermore, it has also been suggested that a common African currency should be linked to an external anchor, namely the euro (e.g., Honohan and Lane, 2001). In practice, this is the case with the WAEMU.
4 See, inter alia, the speech given at the celebration of the 10th anniversary of the ACC agreement
speculative attacks, as shown by the experiences of Hong Kong and Argentina (see Berg and Borensztein, 2000 and Irwin, 2004).
Truly, the elimination of speculative attacks and the other benefits of euroization come at some costs. The main cost is the irreversible loss of two policy instruments traditionally used for macroeconomic management, namely the exchange rate and the interest rate.
In theory, the exchange rate may be a useful instrument for management of external demand. For instance, in case of an external deficit, a depreciation of the exchange rate may spur exports and replace imports by domestic production. While it is true that euroization removes this possibility, it should be noted that given the structural characteristics of Cape Verde (a small economy highly dependent on imports of most final and intermediate goods, including energy), the adjustment of external demand via the exchange rate is an illusion. In fact, any depreciation with the purpose of increasing net exports would hardly have any impact. Increasing the price of imports (for instance, of food) does not improve Cape Verde’s competitiveness in the production of such goods. Production is structurally limited by a number of natural constraints (such as climate, aridity and relief), which the exchange rate can not modify. Therefore, an exchange rate depreciation would not reduce the volume of imports but simply increase the cost of living. Analogously, an exchange rate depreciation would not effectively promote exports, as the very high pass-through from import prices to domestic prices would rapidly increase wages as well as other input costs. This would increase the price of exports in CVE without significantly changing the prices in foreign currency. In short, the loss of exchange rate management would not be a structural cost for Cape Verde.
In principle, another potential cost of euroization is the loss of monetary policy for anti-cyclical purposes, as the ECB policy applies. To be sure, the absence of realignments of the CVE parity during the last ten years has required the monetary policy of the BCV
not to diverge markedly from that of the ECB.5 Hence, the cost of losing monetary
autonomy does not seem to be, either, any novelty regarding the recent experience. This statement does not imply that the monetary policy of the BCV (and of the ECB) has been adequate to smooth the business cycle of Cape Verde. Adequacy can, however, be checked by studying the synchronization between the business cycles of Cape Verde and those of the EMU.
Alesina and Barro (2002) have shown that the type of country that has more to gain from giving up its own currency is (i) a small open economy, trading heavily with the issuer of the currency to be adopted, (ii) with a history of high inflation, and (iii) with a business cycle highly correlated with the cycle of the currency issuer. This framework has motivated empirical studies of a number of authors, focusing on several countries, and with different purposes. For instance, Alesina, Barro and Tenreyro (2002) used those three criteria in order to identify, on the basis of historical data, three possible currency areas, namely an euro area, a dollar area and a yen area. In the same vein, Furceri and Karras (2006) checked the behaviour of inflation and the synchronization of cycles of the new European Union (EU) members, in order to find out which countries would benefit from joining EMU. These studies assume that countries with higher inflation rates are the ones that gain the most from adopting a currency issued by a foreign independent central bank (such as the ECB), provided their business cycles are strongly synchronized with that of the issuer. In fact, those countries would obtain the benefit of disinflation a la Barro and Gordon (1983), without incurring the costs of a cyclically misaligned monetary policy.
In the next section we provide a brief overview of the economy of Cape Verde. The data there presented show that, through the exchange-rate-pegging strategy, Cape Verde has already achieved low levels of inflation. Thus, the argument that euroization would contribute to disinflation is not relevant in the case of Cape Verde. However, on top of other benefits, euroization would secure the gains achieved as regards price stability. Moreover, one must bear in mind that if euroization is to be formally agreed with the EU, the fulfilment of the criterion of low inflation (as stated in the EU Treaty for EMU
5 The prevalence of some foreign exchange restrictions may have allowed for some independence of the
membership) will be required beforehand. The next section also documents the high degree of openness of the Cape-verdean economy, as well as its strong trade, investment and financial links to Europe.
Hence, the empirical focus of this paper is on the third criterion referred by Alesina and Barro (2002), i.e. the degree of synchronization of business cycles. Assessing the synchronization between the business cycle of Cape Verde and that of the EMU over the last ten years allows for an ex-post inference of whether the ECB monetary policy – closely followed by the BCV – has been adequate for demand management of the Cape-verdean economy. A high degree of synchronization means that the monetary policy designed by the ECB for the whole EMU has met the needs of Cape Verde. Looking forward, in the case where the degree of synchronization is indeed large, one may ex-ante conclude that official replacement of the CVE by the euro, and the corresponding loss of an independent interest rate, will not imply relevant macroeconomic costs for Cape Verde.
Actually, an ex-ante high synchronization of business cycles may not be a necessary condition for euroization. There is a vast body of literature – known under the heading of “endogeneity of optimum currency areas” – emphasizing that the adoption of a common currency sets in motion a virtuous engine that increases cyclical co-movements.6 Still, given the uncertainty about the mechanisms that may lead to endogenous synchronization of cycles, it is advisable to be prudent. And being prudent is, for our purpose, to detect a history of evident similarity of business cycles ahead of euroization.
The rest of this paper is structured as follows. In section 2 we present a brief overview of the Cape-verdean economy. In section 3 we empirically assess the degree of synchronization between the business cycle of Cape Verde and the EMU cycle. To
6 The hypothesis of optimum-currency-area endogeneity was first suggested by Frankel and Rose (1997,
1998). Originally, the reasoning was that sharing a common currency would increase trade integration and that trade integration would, in turn, increase synchronization of business cycles. The endogeneity arising through the trade channel is the most discussed in the literature, very much due to the huge effect of common currencies on trade found by Rose (2000). However, as surveyed by De Grauwe and Mongelli (2005), other channels beyond trade may also trigger endogeneity.
further interpret the results for Cape Verde, we replicate the assessment for each of the 27 EU countries. Some final remarks and conclusions are presented in section 4.
2. A brief overview of the economy of Cape Verde: A tale of a successful peg to the euro
In this section we briefly describe the economy of Cape Verde and review how the fixed exchange rate regime between the CVE and the euro has been managed for the last ten years.7 In spite of the scarcity of natural resources, the high protection of key markets and a strong reliance upon tourism-based activities, Cape Verde has been deepening its economic and financial integration with Europe and has already come across some of the underlying costs of relinquishing the control over the national currency.
Cape Verde was a Portuguese colony that became independent in 1975. Spread out over 10 islands, Cape Verde is located 500 kms West of Senegal and 1300 kms South of the Canary Islands, which is the closest region belonging to the EMU. Cape Verde is a very small economy with approximately 530 thousand people (roughly 0.17 per cent of the EMU’s) and with a gross domestic product (GDP) that amounts to just 0.01 per cent of the euro area GDP.
Cape Verde has a stable democracy and, unlike many African countries, has not been subject to episodes of civil unrest. According to the 2008 Corruption Perception Index of Transparency International, Cape Verde ranks 47th among the 180 observed countries. This makes Cape Verde one of the best performers among African countries, also performing better than 9 EU countries (Slovakia, Italy, Greece, Hungary, Latvia, Lithuania, Poland, Romania and Bulgaria).
The average of real GDP growth rates in the last fifteen years was close to 8 per cent, i.e. double that of the corresponding figure for the Sub-Saharan Africa. This path has
7 Hereafter, and throughout this section, we make use of information and data released by public sources,
namely the central bank of Cape Verde, the International Monetary Fund, the Statistical Offices of Cape Verde and Portugal and the Portuguese Ministry of Finance. Raw and treated data used in the text are available upon request.
strongly contributed to the current International Monetary Fund (IMF) classification of Cape Verde among the Sub-Sahara African countries of middle income, a group that also includes Botswana, Lesotho, Mauritius, Namibia, Seychelles, Southern Africa and Swaziland. Since the beginning of 2008, the United Nations also ranks Cape Verde as a middle income country.
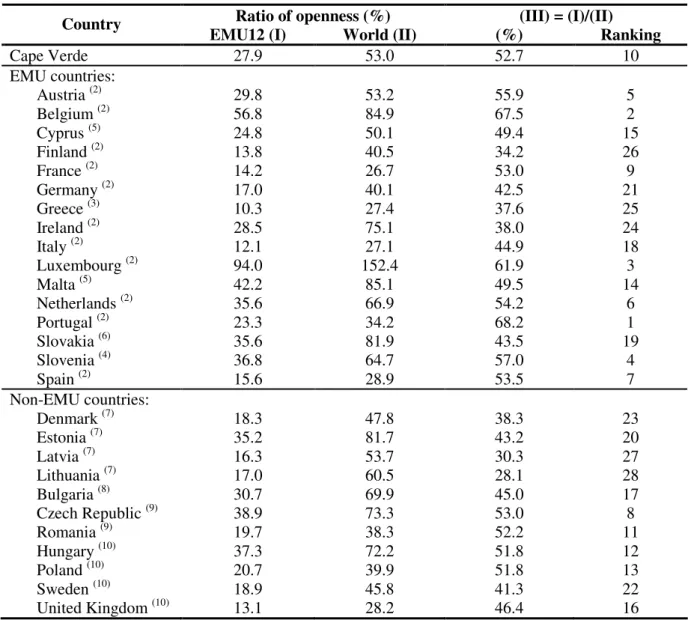
Cape Verde is a highly open economy. This is shown in Table 1, which displays the degree of openness, as measured by the sum of imports and exports of goods and services, divided by twice the GDP. For comparative purposes, the table also presents figures for all EU countries, both EMU and non-EMU. The figures reported in column I measure only relative exports to and imports from the euro area, providing the degree of openness relative to the EMU. The group of EMU countries consists of the eleven founding members, plus Greece that joined in 2001 (EMU12). Column II reports the total degree of openness (World), i.e., total exports and imports of each country relative to GDP. Column III shows, for each country, the proportion of trade with EMU12 in total trade.8
8 Most of the figures reported in Table 1 refer to 2004-2007. This is the only period for which Eurostat
reports data on trade in services between the EMU and most of the EU members. We include data on trade in services because data on foreign trade in tourism is critical for any study of the economy of Cape Verde.
Table 1. Degree of integration as measured by trade in goods and services, 2004-07(1)
Ratio of openness (%) (III) = (I)/(II)
Country EMU12 (I) World (II) (%) Ranking
Cape Verde 27.9 53.0 52.7 10 EMU countries: Austria (2) 29.8 53.2 55.9 5 Belgium (2) 56.8 84.9 67.5 2 Cyprus (5) 24.8 50.1 49.4 15 Finland (2) 13.8 40.5 34.2 26 France (2) 14.2 26.7 53.0 9 Germany (2) 17.0 40.1 42.5 21 Greece (3) 10.3 27.4 37.6 25 Ireland (2) 28.5 75.1 38.0 24 Italy (2) 12.1 27.1 44.9 18 Luxembourg (2) 94.0 152.4 61.9 3 Malta (5) 42.2 85.1 49.5 14 Netherlands (2) 35.6 66.9 54.2 6 Portugal (2) 23.3 34.2 68.2 1 Slovakia (6) 35.6 81.9 43.5 19 Slovenia (4) 36.8 64.7 57.0 4 Spain (2) 15.6 28.9 53.5 7 Non-EMU countries: Denmark (7) 18.3 47.8 38.3 23 Estonia (7) 35.2 81.7 43.2 20 Latvia (7) 16.3 53.7 30.3 27 Lithuania (7) 17.0 60.5 28.1 28 Bulgaria (8) 30.7 69.9 45.0 17 Czech Republic (9) 38.9 73.3 53.0 8 Romania (9) 19.7 38.3 52.2 11 Hungary (10) 37.3 72.2 51.8 12 Poland (10) 20.7 39.9 51.8 13 Sweden (10) 18.9 45.8 41.3 22 United Kingdom (10) 13.1 28.2 46.4 16
Notes: (1) Period coverage: the data is an average for the period 2004-07, except for Belgium, Bulgaria and Netherlands (average 2004-06) and for Romania and Spain (average 2005-07) in columns (I) and (III); (2) EMU founding country (1999); (3) EMU country since 2001; (4) EMU country since 2007; (5) EMU country since 2008; (6) EMU country since 2009; (7) Countries in the Exchange Rate Mechanism II (ERM II) since 1999, 2004, 2005 and 2005, respectively. Denmark is committed to a +/-2.25% band; Estonia has a unilateral commitment to a currency board based on the euro since 1999 and Lithuania since February 2002; Latvia has a unilateral commitment to an exchange rate band of +/-1%; (8) Euro-based currency board; (9) Managed float based on the euro; (10) Independent floating.
Sources: - European countries: Eurostat, available at
http://epp.eurostat.ec.europa.eu/portal/page/portal/external_trade/data/database,
http://epp.eurostat.ec.europa.eu/portal/page/portal/national_accounts/data/database and
http://epp.eurostat.ec.europa.eu/portal/page/portal/balance_of_payments/data/database, (accessed in March 2009).
- Cape Verde: International Financial Statistics (IMF), BCV (http://www.bcv.cv/) and Eurostat,
available at http://epp.eurostat.ec.europa.eu/portal/page/portal/external_trade/data/database
Table 1 shows that Cape Verde is more open than many EU countries (53 per cent), that it trades more with the EMU12 than many EU countries do (27.9 per cent), and that, among the 28 countries considered, Cape Verde has the 10th highest degree of concentration of trade with the EMU12 (52.7 per cent). Portugal, Spain, the Netherlands and France are the most representative trading partners as they account for roughly 80 per cent of the Cape-verdean merchandise trade.
Due to a high dependence from abroad on energy, equipment and food, Cape Verde has had a chronic deficit in its merchandise trade balance. On average, in the last ten years, the deficit amounted to nearly 40 per cent of GDP.
The deficit in merchandise trade has been partially financed by tourism services, which have boomed from 4.7 per cent of GDP in 1999 to around 20 per cent of GDP in recent years. Tourism currently accounts for almost 50 per cent of the exports of Cape Verde and is highly concentrated in the EU, particularly in some EMU countries. In recent years, on average, 90 per cent of tourists are from European countries.9
The path of foreign direct investment has also been giving an increased contribution to external inflows to Cape Verde. In the last ten years, foreign direct investment has jumped from around 5 per cent of GDP to more than 11 per cent. Tourism has attracted the majority of these inflows, mainly on real estate and construction and broadly promoted by some EMU countries. Besides tourism-related investments, foreign investment originated from Europe has also been directed to communications, energy and financial institutions. The main Cape-verdean firms in those sectors are partly owned by corresponding Portuguese specialized firms, which bring in expertise and know-how. On average, in recent years, investment from Portugal, Spain and Italy represented together more than half of total foreign direct investment.
Another quite relevant source of external inflows is emigrants’ remittances. In spite of its descending relative importance (resulting, among other factors, from the reduction in emigration flows, the decrease in altruism-motivated transfers and the end of fiscal
incentives), remittances still represent nearly 10 per cent of GDP.10 Roughly 80 per cent
of the remittances are sent from EU countries.
External aid has also been an important financing source for Cape Verde. In spite of the recent graduation by the United Nations as a middle income country, it is not expected that such flows will abruptly come to an end. In recent years external grants and loans represented around 10 per cent of GDP and, according to IMF projections, they will fall below 9 per cent of GDP only from 2013 onwards (IMF, 2009).
Regarding the economic policy regime, since April 1998 the Cape-verdean economy has functioned under the umbrella of the ACC agreement. The ACC includes three main features: 1) a fixed exchange rate between the CVE and the euro; 2) a lending facility endorsed by the Portuguese Treasury; 3) the commitment by the Cape-verdean government to adopt the macroeconomic reference criteria established in the EU Treaty. The overall balance of the ACC is positive throughout. The agreement has worked, de facto, as a fixed exchange rate arrangement with no realignments occurring since its inception. The successful exchange rate stability was progressively achieved through a sounder external balance while the interest rates kept on converging downward.
After the institution of the ACC, Cape Verde has gradually dismantled the restrictions on international capital mobility, in line with the requirements made by the IMF. Some restrictions, involving specific authorizations from the BCV are still in place. However, as the IMF (2008) notes, Cape Verde is currently close to a de facto situation of perfect capital mobility.
With the gradual promotion of capital mobility, interest rate management revealed to be crucial to sustaining the peg with the euro. Yet, only in 2006 did the BCV reference interest rates become a central policy instrument. Prior to that, when risks of foreign reserve depletion were in place, upward movements were applied, instead, to the coefficient of bank reserves. Data from the BCV and the ECB show that market deposit
As alternative sources of external financing emerged in recent years, the Cape-verdean authorities have abolished fiscal incentives to emigrants’ deposits.
rates have now converged towards the euro levels. However, significant differentials still apply to the lending rates. The magnitude of the current interest rate spreads can be explained by a number of structural factors. On one hand, banks are subject to some abnormally high operational costs (e.g. telecommunications and a high rate of non-remunerated legal reserves). On the other hand, financial competition is not sufficiently deep yet, although improvements have been recorded in recent years.
The behaviour of the stock of official foreign reserves has been outstanding. By the time of the ACC inception, foreign reserves were no higher than 2 per cent of GDP (6.6 per cent of the monetary base) while, in mid 2008, they represented 35 per cent of the Cape-verdean GDP (114 per cent of the monetary base).
This undoubtedly successful evolution was not straightforward. In 1999 and 2000, and in spite of the commitment to disciplined fiscal policy, government deficits represented, respectively, 12.5 per cent and 19.5 per cent of the GDP. Loose fiscal policy, stemmed from - among other factors - political cycle pressures, transfer compensation for bad crop years and from financial transfers to public firms, especially to those providing basic services. Such high pressure on domestic demand, with strong negative impacts on the balance of payments, led Cape-verdean authorities to use the ACC lending facility for several times during that period.
After 2001, and with the exception of the first half of 2003, the effort of fiscal consolidation became clear: current expenditure was permanently reduced, tax reforms were implemented and tax effectiveness enhanced. Aware of the pervasive effects of fiscal disruption, Cape-verdean authorities have anchored the government deficit below the Maastricht threshold of 3 per cent of the GDP. Likewise, Cape Verde has achieved an important reduction of total public debt, from 98 percent of GDP in 2001-04 to 76 percent in 2007, thus converging to the EU reference value.
The ACC lending facility has not been used since 2004. This very much reflects fiscal discipline, together with the above mentioned large foreign reserve inflows, mainly resulting from tourism revenue and foreign direct investment.
In balance, the current exchange rate regime appears to be rather credible. Having remained fixed for the last ten years, the exchange rate exhibits alignment with the fundamentals and is, now, truly embedded in the behavior of economic agents. Evidence of credibility comes also from the parallel foreign exchange market, where the amounts involved are small and the rates very close to the official rate. Additionally, despite the convergence of the CVE interest rates with those of the euro, the stock of deposits from non-residents keeps increasing. Furthermore, the euro and the CVE are already interchangeably used in most of Cape Verde, especially in the islands with more visitors.
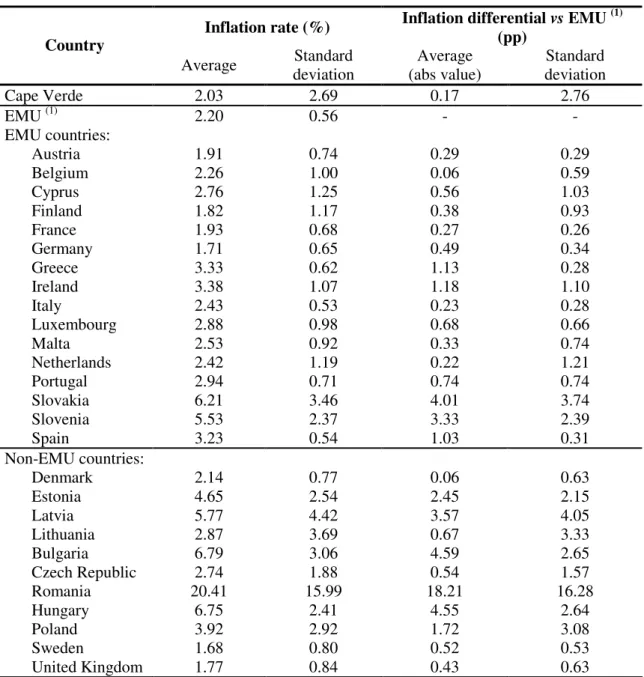
The exchange rate stability has also delivered the intended price stability. Although Cape Verde was already displaying relatively low inflation rates in the past, the ACC has undoubtedly driven Cape Verde’s inflation rates closer to those of the EMU. This is shown in Table 2, where averages and standard deviations of the inflation rates are reported for the period 1999-2008. For comparison, the table also reports figures for the aggregate euro area and for each EU country.
Table 2. Average and standard deviation of inflation rates, 1999-2008
Inflation rate (%) Inflation differential (pp) vs EMU (1) Country
Average deviation Standard (abs value) Average deviation Standard
Cape Verde 2.03 2.69 0.17 2.76 EMU (1) 2.20 0.56 - - EMU countries: Austria 1.91 0.74 0.29 0.29 Belgium 2.26 1.00 0.06 0.59 Cyprus 2.76 1.25 0.56 1.03 Finland 1.82 1.17 0.38 0.93 France 1.93 0.68 0.27 0.26 Germany 1.71 0.65 0.49 0.34 Greece 3.33 0.62 1.13 0.28 Ireland 3.38 1.07 1.18 1.10 Italy 2.43 0.53 0.23 0.28 Luxembourg 2.88 0.98 0.68 0.66 Malta 2.53 0.92 0.33 0.74 Netherlands 2.42 1.19 0.22 1.21 Portugal 2.94 0.71 0.74 0.74 Slovakia 6.21 3.46 4.01 3.74 Slovenia 5.53 2.37 3.33 2.39 Spain 3.23 0.54 1.03 0.31 Non-EMU countries: Denmark 2.14 0.77 0.06 0.63 Estonia 4.65 2.54 2.45 2.15 Latvia 5.77 4.42 3.57 4.05 Lithuania 2.87 3.69 0.67 3.33 Bulgaria 6.79 3.06 4.59 2.65 Czech Republic 2.74 1.88 0.54 1.57 Romania 20.41 15.99 18.21 16.28 Hungary 6.75 2.41 4.55 2.64 Poland 3.92 2.92 1.72 3.08 Sweden 1.68 0.80 0.52 0.53 United Kingdom 1.77 0.84 0.43 0.63
Sources: - European countries: harmonized consumer price index, AMECO database, available at
http://ec.europa.eu/economy_finance/ db_indicators/db_indicators8646_en.htm, accessed in January 2009;
- Cape Verde: consumer price index, International Financial Statistics of the IMF (accessed in January 2009).
Note: (1) EMU comprises the 11 founding countries plus Greece.
Table 2 shows that the average inflation rate in Cape Verde is very close to the one observed in the euro area. Smaller deviations relative to the EMU average occur only in Belgium (an EMU country) and in Denmark (a non-EMU country).11 Such nominal
11 Sharing a common currency does not imply sharing a common inflation rate. Inflation rate differentials
convergence prevented competitiveness depletion of the Cape-verdean economy. However, Cape-verdean inflation rates display substantial volatility. Higher standard deviations are only recorded by some non-EMU countries – mainly eastern European countries – and by the most recent EMU member, Slovakia. The inflation rate volatility in Cape Verde tends to be strongly associated with the effects of rainfall instability on crops and on the supply of primary goods.
The description provided throughout this section makes clear that Cape Verde is indeed highly integrated with Europe and with the EMU, in particular. Moreover, nominal convergence with the EMU provides indirect evidence that monetary policy has been conducted alongside that of the ECB’s. So, what is still left to prove is how suitable the ECB policy is for the Cape-verdean economy. In this context, the next section provides evidence on the synchronization of cycles between Cape Verde and the EMU.
3. Synchronization of business cycles
In this section we assess the co-movement of the business cycle of Cape Verde and of each of the current 27 EU countries with regard to the EMU business cycle. The goal is to establish rankings of proximity between the business cycles of each of the countries under analysis and that of the EMU. Such rankings will provide a picture of the relative performance of Cape Verde during its conventional peg to the euro, thus signaling the adequacy of the ECB monetary policy for the Cape-verdean economy.
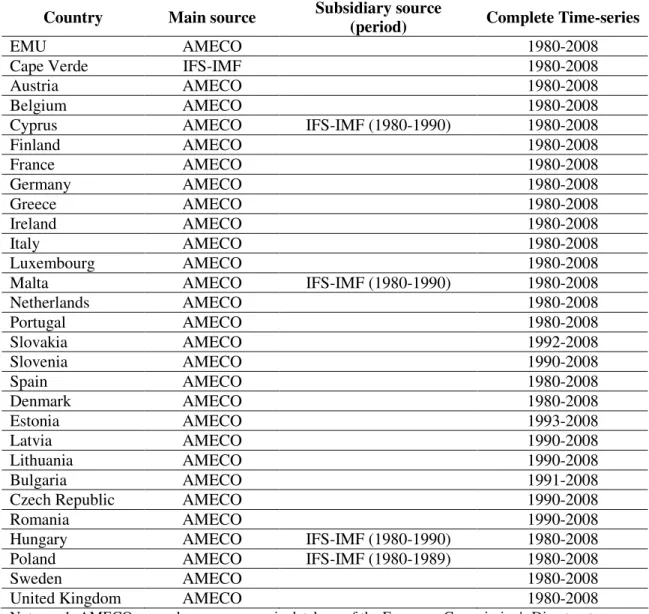
Data are annual time series of real GDP, in national currencies. With some few exceptions, as detailed in Table A.1 in the Annex, the data source is AMECO and covers the period from 1980 to 2008. An explanation regarding data frequency is in order. Although higher frequency data would be more adequate for studying exchange rate and monetary policies, we have chosen to use annual time series. Our choice follows from the unavailability or unreliability of quarterly real GDP data for some countries in most of the sample period. This is a cost that researchers studying economies such as that of Cape Verde and those of most EU central and eastern countries must face for the time being.
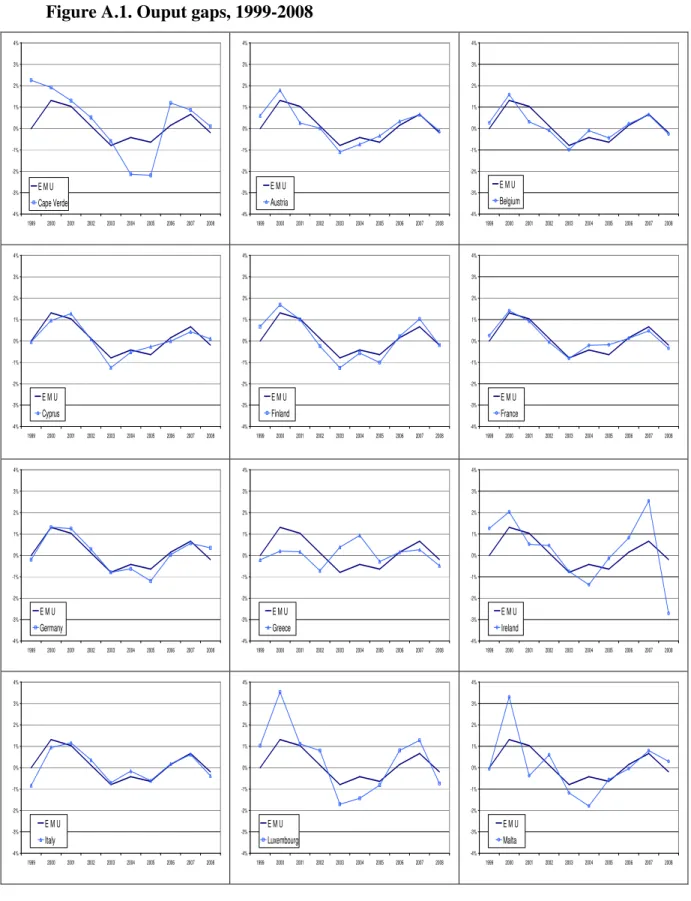
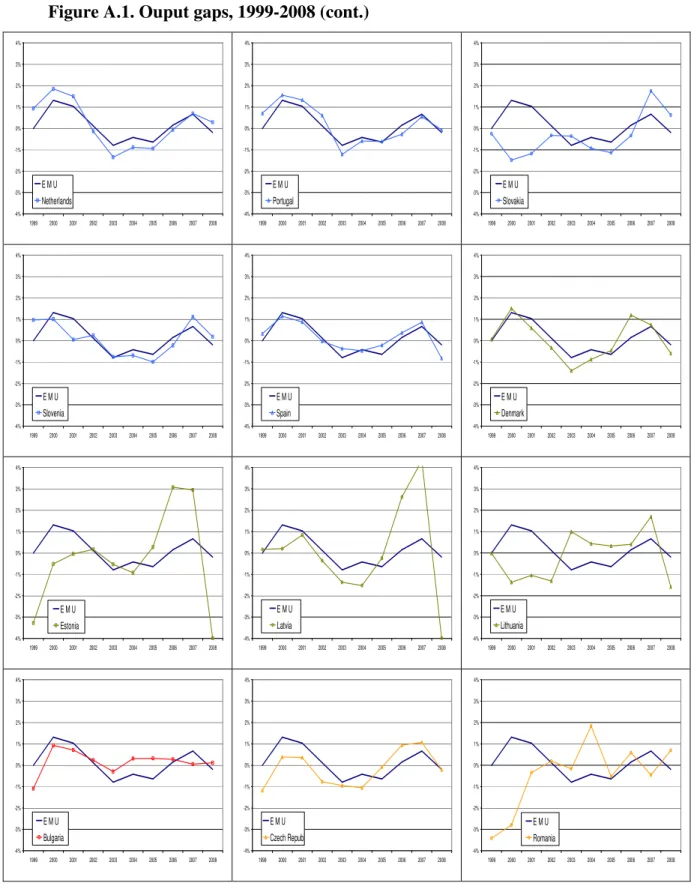
We measure the business cycle by filtering the log of each real GDP time series with the Hodrick-Prescott (HP) filter (Hodrick and Prescott, 1997). The smoothing parameter λ is set at 6.25, the value that mimics with annual data the results obtained with the HP filter on quarterly data (Ravn and Uhlig, 2002). Figure A.1 in the Annex shows the resulting output gaps for each country during the period 1999-2008, i.e., the period for which a single monetary policy has been carried out by the ECB for the EMU countries. Given our purposes, all the 28 charts in the figure include the EMU output gap.
Regarding the identification of the business cycle, four notes are in order:
(i) There are three popular approaches in the literature (see Artis, Marcellino and Proietti, 2004). They are: the deviation cycle, which measures the cycle as the deviation of the log of real GDP from its trend; the classical cycle, which studies the turning points (peaks and troughs) of the log of real GDP; and the growth cycle, which considers the difference between the growth rate of real GDP and its trend growth rate. The classical cycle approach, devised for monthly and quarterly data, is not feasible in our case. In fact, we are using annual data for a period characterised by a high trend growth and low volatility, with very few turning points. Out of the 290 growth rates in the sample (29 time-series with 10 data-points) only 9 are negative. Given that filtering is needed in both the deviation and growth cycle approaches, we have chosen to filter the level of real GDP rather than its growth rate, as the deviation cycle is by and large the most popular in the literature.
(ii) An important feature of the deviation cycle approach is that, in addition to qualitative information on the cyclical state of the economy (peak, recession, trough, expansion), it quantifies the cyclical component of GDP at each point in time.
(iii) We use a simple non-parametric filter, rather than alternative procedures requiring estimation (say, the unobservable components model or the production function approach). This is due to the scarcity of data, especially for some countries. Given its popularity, the use of the HP filter has also the advantage of enabling eventual comparison of results.
(iv) As the HP filter is a high-pass filter that extracts cycles of duration not larger than 8 years, it includes fluctuations at high frequencies, which could be filtered out with an
appropriate band-pass filter. However, high frequency oscillations are less of a problem in annual data. Moreover, band-pass filters typically involve losing data-points or using more complex approximations at larger sections of the beginning and end of the sample. In any case, as a robustness check, we close this section by presenting results obtained with an approximate band-pass filter.
The output gaps for the individual countries and for the EMU are now used to compute a set of co-movement indicators between each business cycle and that of the euro area. As a first simple gauge of the co-movements, we use the linear correlation coefficient between the output gap of each country (g ) and the gap of the EMU (i gEMU):
(
)(
)
(
) (
)
2 ) ( 2 ) ( ) ( ) ( ) ( ) ( ) , ( ) , ( EMU t EMU t it i EMU t EMU t it i EMU i EMU i EMU i g g g g g g g g g g g g Cov g g − − − − = =σ
σ
ρ
where g and i gEMU are the corresponding average output gaps for the sample period. In spite of its extreme simplicity, correlation coefficients have been extensively used in recent studies of business cycle synchronization, irrespectively of the approach used to measure the cycle – see De Haan, Inklaar and Jong-A-Pin (2008) for a survey. 12
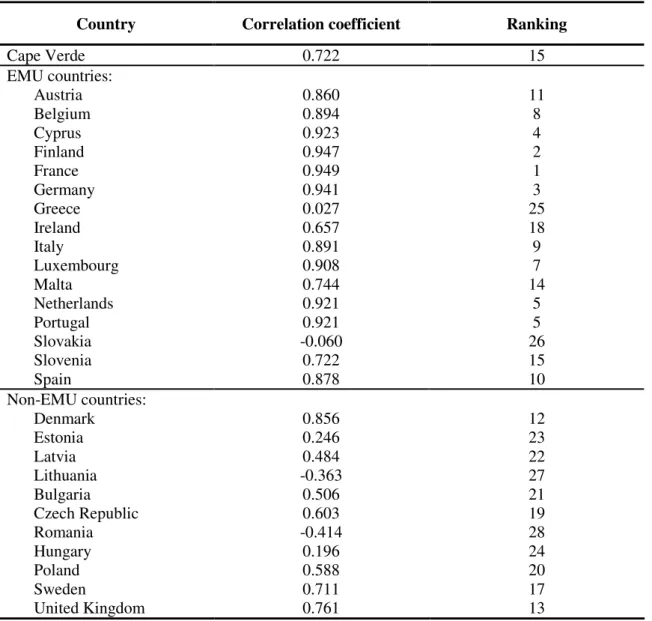
Table 3 presents the contemporaneous linear correlation coefficients between each country’s output gap and the EMU gap for the whole euro period (1999-2008). The output gap of Cape Verde has a correlation of 72.2 percent with that of the euro area. This score puts the country roughly at the middle of the correlations’ ranking for all the 28 countries. Within the EMU, there are 3 countries with lower correlations than Cape Verde (Slovakia, Greece and Ireland) and another (Slovenia) with the same correlation. Moreover, out of the 11 European non-EMU countries, only 2 display higher output gap
12 Many studies compare correlations for different sample periods or look at rolling and
non-contemporaneous correlations. Given our purposes, we merely compute the correlations for the euro period (1999-2008). We choose not to look beyond contemporaneous correlations, as non-contemporaneous correlations would only be relevant for assessing adequacy of a single monetary policy if the data had higher frequency.
correlations. Those are Denmark (which, like Cape Verde, has had a fixed exchange rate against the euro since 1999) and the UK.13
The good position of Cape Verde in the correlations-based ranking of Table 3 is noteworthy, given that the standard deviation of Cape Verde’s output gap is one of the largest in the sample (which is apparent in figure A.1). Within the EMU, only Ireland and Luxembourg have a comparable degree of volatility, while among non-EMU members only the output gaps of Estonia and Latvia have higher standard deviations (Romania’s gap standard deviation is similar to Cape Verde’s). This suggests that the good ranking of Cape Verde derives from a high concordance of business cycles, rather than from a high similarity in the levels of the output gaps.
13 It should be noted that the high correlation between the output gap of Cape Verde and the EMU’s
output gap in Table 3 is not a fortuitous result for the 1999-2008 period. In fact, when the sample period is successively extended backward to include additional years, the correlation coefficients show remarkable stability through 1993-2008.
Table 3. Correlation coefficients with the EMU business cycle, 1999-2008
Country Correlation coefficient Ranking
Cape Verde 0.722 15 EMU countries: Austria 0.860 11 Belgium 0.894 8 Cyprus 0.923 4 Finland 0.947 2 France 0.949 1 Germany 0.941 3 Greece 0.027 25 Ireland 0.657 18 Italy 0.891 9 Luxembourg 0.908 7 Malta 0.744 14 Netherlands 0.921 5 Portugal 0.921 5 Slovakia -0.060 26 Slovenia 0.722 15 Spain 0.878 10 Non-EMU countries: Denmark 0.856 12 Estonia 0.246 23 Latvia 0.484 22 Lithuania -0.363 27 Bulgaria 0.506 21 Czech Republic 0.603 19 Romania -0.414 28 Hungary 0.196 24 Poland 0.588 20 Sweden 0.711 17 United Kingdom 0.761 13
Source: Authors’ calculations.
Given the above considerations, we now focus on specific features of the co-movement of business cycles. A number of indicators providing a deeper analysis of business cycle synchronization have been suggested in recent literature. A large part of these indicators have been used in the context of the classical cycle approach, which has recently been revived by Harding and Pagan (2002, 2003). Such measures use a binary variable for describing whether an economy is in a recession or in an expansion. Within this approach, popular measures include, inter alia, the concordance index and Pearson’s contingency index (see Artis, Krolzig and Toro, 2004). For this type of indicators, Harding and Pagan (2005, 2006) have recently suggested formal statistical tests. Following Harding and Pagan (2002), the classical cycle literature has also focused on
the similarity of cycles’ amplitude. In the case of these measures, the cyclical binary variable is used jointly with the original time series values (see e.g. Altavilla, 2004 and Camacho, Quirós and Saiz, 2007).
Instead of mechanically using the indicators devised for the classical cycles approach, we follow the measures recently suggested by Mink, Jacobs and de Haan (2007) – henceforth MJH – for the specific context of deviation cycles. These measures take into account the value of the output gap at each point of time.
The first measure indicates whether a given country and the EMU are on the same side of their cycles, i.e. if both have positive (negative) output gaps. We call it the phase similarity index. The second measure assesses how much the output gap of a given country deviates from the output gap of the EMU. We call it the deviation similarity index.
The phase similarity index in period t is given by14
( ) ( ) ( ) ( )t EMU( )t i t EMU t i t iEMU g g g g =
ϕ
where gEMU( )t denotes the reference business cycle (the EMU output gap) and gi( )t is
the output gap of country i. Index
ϕ
iEMU( )t may either take on a value of -1 or 1. The average ofϕ
iEMU( )t over a period necessarily lies between -1 (null phase similarity) and1 (full phase similarity); the value 0 means that the number of years in which the output gap of country i had the same sign of that of the EMU has been the same as the number of years with opposite signs. By comparing the average of
ϕ
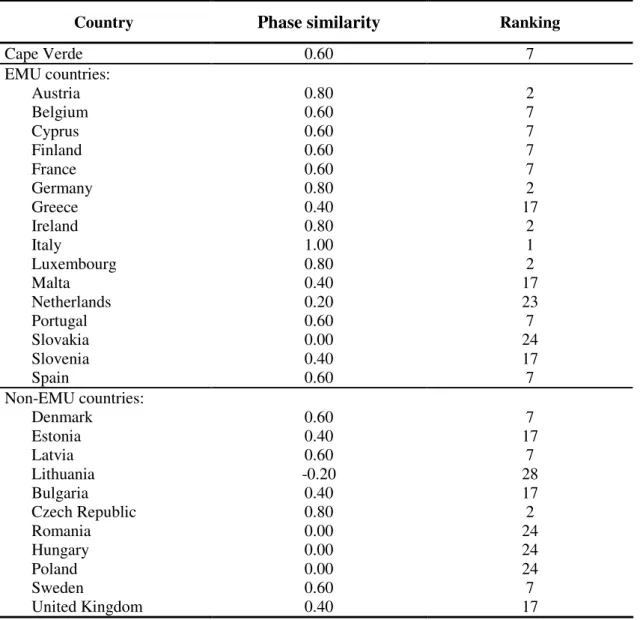
iEMU( )t across countries, one can establish a ranking based on the phase similarity of business cycles.Table 4 presents the phase similarity of EU countries’ and Cape Verde’s output gap with the EMU output gap, measured as the average of the
ϕ
iEMU( )t index for the period1999-2008. Cape Verde ranks quite well, holding the 7th position among the 28
countries, with a record of 0.60. This is the net value of 80 percent of observations with equal signs in output gaps and 20 percent of observations with opposite signs. Among the current 16 countries of the EMU, 5 countries (Greece, Malta, the Netherlands, Slovakia and Slovenia) display less phase similarity with the EMU business cycle than Cape Verde does. Cape Verde has a degree of phase similarity at the same level of 6 EMU countries, namely Belgium, Cyprus, Finland, France, Portugal and Spain. Within the group of the 11 EU countries still not in the EMU, only 1 (the Czech Republic) has a degree of phase similarity higher than that of Cape Verde.
Table 4. Phase similarity with the EMU business cycle, 1999-2008
Country Phase similarity Ranking
Cape Verde 0.60 7 EMU countries: Austria 0.80 2 Belgium 0.60 7 Cyprus 0.60 7 Finland 0.60 7 France 0.60 7 Germany 0.80 2 Greece 0.40 17 Ireland 0.80 2 Italy 1.00 1 Luxembourg 0.80 2 Malta 0.40 17 Netherlands 0.20 23 Portugal 0.60 7 Slovakia 0.00 24 Slovenia 0.40 17 Spain 0.60 7 Non-EMU countries: Denmark 0.60 7 Estonia 0.40 17 Latvia 0.60 7 Lithuania -0.20 28 Bulgaria 0.40 17 Czech Republic 0.80 2 Romania 0.00 24 Hungary 0.00 24 Poland 0.00 24 Sweden 0.60 7 United Kingdom 0.40 17
In order to examine synchronization between business cycles one needs to go beyond phase similarity and also assess differences between amplitudes (in fact,
ϕ
iEMU( )t iscompletely invariant to the amplitude of the business cycle). This is done using the deviation similarity index, which, for period t, is defined as
( ) ( ) ( ) ( ) ( ) = − − − = n i it EMUt t EMU t i t iEMU g g g g n 1
γ
where n is the total number of countries in the sample (n = 28). The distance between countries’ i output gap and the reference gap is scaled by the mean distance in the sample.15 The minus sign implies that the higher the index, the higher is the similarity between the deviations of output from trend output. In case of complete similarity of deviations, the index takes on its maximum value and equals 0. Averaging
γ
iEMU( )tacross the sample period yields an indicator of deviation similarity between the output gap of country i and the EMU output gap during 1999-2008. One can then rank the countries according to this criterion.
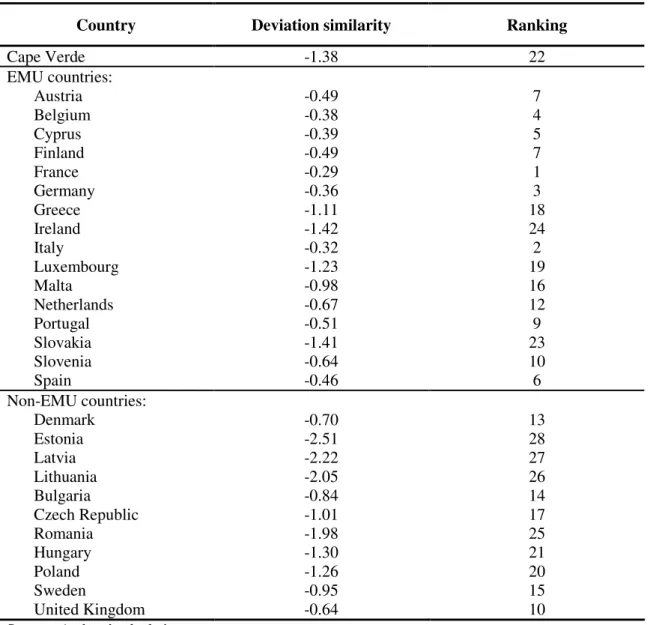
As Table 5 shows, Cape Verde ranks less favorably when the amplitude of the business cycle is also considered. This is a rather expected result, in view of the relatively large standard deviation of Cape Verde’s output gap. However, Cape Verde is far from the bottom of the ranking. Its output gap is more similar to the EMU’s output gap than the gaps of 2 EMU countries (Ireland and Slovakia) and of 4 non-EMU countries (Estonia, Latvia, Lithuania and Romania). Furthermore, there are 4 other EU economies with an index of deviation similarity close to Cape Verde’s (Luxembourg and Greece in the EMU, and Poland and Hungary outside the EMU). The case of Greece is noteworthy, since this country performs rather worse than Cape Verde as regards phase similarity, as seen in Table 4.
15 Note that our index
( )t iEMU
γ
differs from the original MJH’s in two details. First, they consider in thedenominator the sum of the absolute values of all countries’ output gaps, and not their deviation from the reference gap. Second, they compute the reference gap as the gap that minimizes the distance to all the individual gaps in their sample. Our version is justified on two grounds: (i) differently from MJH’s, here only a fraction of the countries considered is part of the reference region; (ii) we compute the reference cycle directly from aggregate EMU data. As MJH state, the denominator of their index is meant to prevent the measure from being affected by an overall change in cyclical activity in the region. In our case what is relevant is to prevent the measure from being affected by an overall change in the dispersion of all the business cycles around the EMU cycle.
Table 5. Deviation similarity with the EMU business cycle, 1999-2008
Country Deviation similarity Ranking
Cape Verde -1.38 22 EMU countries: Austria -0.49 7 Belgium -0.38 4 Cyprus -0.39 5 Finland -0.49 7 France -0.29 1 Germany -0.36 3 Greece -1.11 18 Ireland -1.42 24 Italy -0.32 2 Luxembourg -1.23 19 Malta -0.98 16 Netherlands -0.67 12 Portugal -0.51 9 Slovakia -1.41 23 Slovenia -0.64 10 Spain -0.46 6 Non-EMU countries: Denmark -0.70 13 Estonia -2.51 28 Latvia -2.22 27 Lithuania -2.05 26 Bulgaria -0.84 14 Czech Republic -1.01 17 Romania -1.98 25 Hungary -1.30 21 Poland -1.26 20 Sweden -0.95 15 United Kingdom -0.64 10
Source: Authors’ calculations.
As a robustness check we have computed output gaps with the approximate Baxter and King (1999) band-pass filter, calibrated for the extraction of cycles with periodicities between 2 and 8 years. In order to circumvent the end-of-sample problem of this method, which in annual data implies the loss of the last 3 data points, we have followed the fairly standard practice of padding each time-series with 3-year-horizon forecasts from an estimated AR(1).16
The 29 output gaps obtained with the band-pass filter are quite close to those obtained with the HP filter. Codes and data are available from the authors upon request.
Table 6 summarizes the results, as well as the implied rankings (in parentheses), for the three indicators used in this section, namely the linear correlation coefficient, the phase and the deviation similarity indexes.
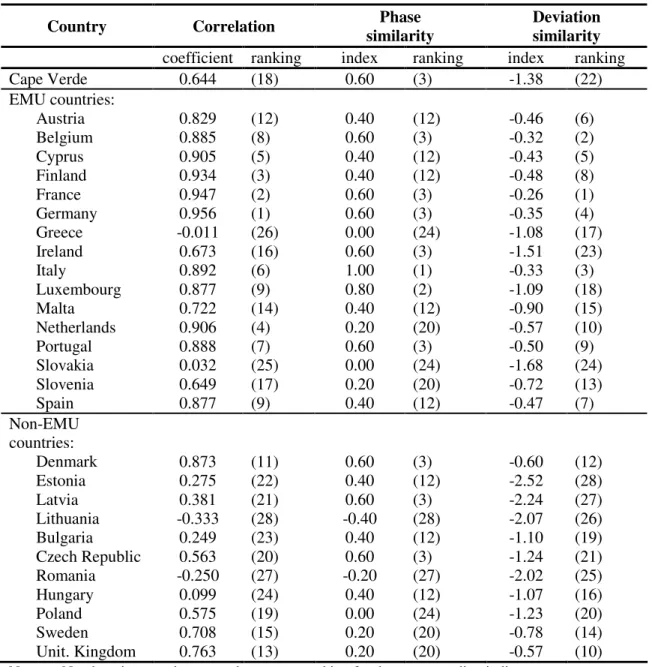
Table 6. Correlation, phase and deviation similarity with the EMU business cycle, 1999-2008 (band-pass gap)
Country Correlation similarityPhase Deviation similarity
coefficient ranking index ranking index ranking
Cape Verde 0.644 (18) 0.60 (3) -1.38 (22) EMU countries: Austria 0.829 (12) 0.40 (12) -0.46 (6) Belgium 0.885 (8) 0.60 (3) -0.32 (2) Cyprus 0.905 (5) 0.40 (12) -0.43 (5) Finland 0.934 (3) 0.40 (12) -0.48 (8) France 0.947 (2) 0.60 (3) -0.26 (1) Germany 0.956 (1) 0.60 (3) -0.35 (4) Greece -0.011 (26) 0.00 (24) -1.08 (17) Ireland 0.673 (16) 0.60 (3) -1.51 (23) Italy 0.892 (6) 1.00 (1) -0.33 (3) Luxembourg 0.877 (9) 0.80 (2) -1.09 (18) Malta 0.722 (14) 0.40 (12) -0.90 (15) Netherlands 0.906 (4) 0.20 (20) -0.57 (10) Portugal 0.888 (7) 0.60 (3) -0.50 (9) Slovakia 0.032 (25) 0.00 (24) -1.68 (24) Slovenia 0.649 (17) 0.20 (20) -0.72 (13) Spain 0.877 (9) 0.40 (12) -0.47 (7) Non-EMU countries: Denmark 0.873 (11) 0.60 (3) -0.60 (12) Estonia 0.275 (22) 0.40 (12) -2.52 (28) Latvia 0.381 (21) 0.60 (3) -2.24 (27) Lithuania -0.333 (28) -0.40 (28) -2.07 (26) Bulgaria 0.249 (23) 0.40 (12) -1.10 (19) Czech Republic 0.563 (20) 0.60 (3) -1.24 (21) Romania -0.250 (27) -0.20 (27) -2.02 (25) Hungary 0.099 (24) 0.40 (12) -1.07 (16) Poland 0.575 (19) 0.00 (24) -1.23 (20) Sweden 0.708 (15) 0.20 (20) -0.78 (14) Unit. Kingdom 0.763 (13) 0.20 (20) -0.57 (10)
Note: Numbers in parentheses are the country ranking for the corresponding indicator. Source: Authors’ calculations.
In general, the picture previously found with the HP filter seems to be robust. In fact, the relative performance of Cape Verde stands, regardless of the gap measures. The linear correlation between the output gaps of Cape Verde and EMU decreases slightly
with the band-pass filter, but since that happens with most countries, Cape Verde holds position 18 in the ranking.17 Among the EMU countries, 2 have smaller correlations
(Greece’s turns out to be negative) while Slovenia displays a correlation coefficient equal to Cape Verde’s. In turn, Cape Verde has higher correlations than 8 non-EMU countries. While the value of the phase similarity index for Cape Verde does not change, the country holds now the 3rd position (rather than the 7th) in the corresponding ranking, as several countries display now lower indexes. Cape Verde has now a phase similarity index at the level of 5 EMU members and 3 non-EMU members. Its index is higher than those of 17 countries, 9 of them belonging to EMU. Finally, both the magnitude and the ranking position are maintained in what regards the index of deviation similarity.
As argued elsewhere in the literature, it might be true that, in general, short run macroeconomic fluctuations of developing countries differ from their developed counterparts (Rand and Tarp, 2002) and, thus, a “one-size-fits-all” policy might not be appropriate. However, we have shown that such a general conclusion does not apply to the case of Cape Verde. Overall, our results suggest that the Cape-verdean business cycle is fairly close to the EMU business cycle and therefore an official euroization is not likely to create problems due to monetary policy inadequacy. In the period 1999-2008 the output gap of Cape Verde has been more correlated with the EMU output gap than the output gaps of several EMU countries and almost all of the other EU members. Truly, this high correlation is more due to phase similarity than to similarity in the amplitude of the business cycle. Yet, even regarding deviation similarity, there are some EMU countries and several other EU countries that perform worse than Cape Verde. Both phase and amplitude of the business cycle matter for the adequacy of monetary policy (see, e.g. Camacho, Quirós and Saiz, 2007). In fact, a single monetary policy can not identically fit countries with different cyclical states, as it can not identically fit countries with different amplitudes in output gaps. Yet, one can argue that the cyclical stateis the most important criterion in the case at hand. Phase similarity determines how
Like with the HP-filter output gaps, the high correlation between the band-pass-filter output gap of Cape Verde and the EMU’s found for the 1999-2008 period still applies if we gradually increase the number of observations by including data back to 1993.
well changes in the ECB monetary policy stance match the cyclical needs of each individual country. In contrast, similar amplitudes of business cycles do not guarantee that a given change in the policy stance matches the needs of each individual country, as one may not take for granted that the monetary policy transmission is similar across countries. Actually, given industrial, banking and labour markets’ diversity, monetary transmission is very likely to be different and unstable in euro-zone newcomers (see Gros and Hefeker, 2007). Accordingly, there is a case for attaching higher relevance to the correlation and phase similarity results.
4. Conclusions and final remarks
This paper has empirically assessed the case for euroization recently put forth by the authorities of Cape Verde. Such a possibility has been raised after a decade of a successful conventional peg to the euro. The pegging has achieved its goals, namely fostering economic integration with Europe and maintaining a macroeconomic regime of nominal stability. Overall, our results indicate that there is a strong case for the euroization of Cape Verde.
The analysis has been developed within the Alesina and Barro (2002) framework, which highlights three criteria for assessing how adequate is for a country to replace its currency by a foreign one. The net benefits are larger (i) the smaller and more open the economy is and the more it trades with the issuer of the currency to be adopted, (ii) the higher inflation rates are, and (iii) the larger the synchronization between the national business cycle and the cycle of the currency issuer is.
The brief overview of the economy of Cape Verde in section 2 has shown, inter alia, that Cape Verde has performed well as regards price stability during the ten years of the peg to the euro. It has also shown that Cape Verde has maintained deep and increasing trade, investment and financial links with the EU and, in particular, with some countries of the EMU. In both respects Cape Verde ranks very well in comparison with several EU countries. Hence, Cape Verde is very likely to benefit from euroization as far as Alesina-Barro’s criteria (i) and (ii) are concerned. In the case of the inflation criterion,
the gains would not consist of disinflation but rather securing the nominal convergence effectively achieved during the pegging.
In turn, in section 3 we have assessed the performance of Cape Verde as regards criterion (iii). Our results strongly suggest that the loss of monetary autonomy ensuing from the pegging of the CVE did not bring relevant costs, at least compared with many European countries. In fact, the business cycle of Cape Verde has been highly correlated with the EMU cycle. Cape Verde scored a degree of phase similarity – and, though to a lesser extent, deviation similarity – higher than some EU countries, both EMU and non-EMU countries. Hence our conclusion that the achievement of the two goals set forth at the outset of the peg did not came at a relevant cost regarding macroeconomic stabilisation.
Looking ahead and considering the goals recently stated by Cape-verdean authorities, our results suggest that there is a strong case for the official euroization of Cape Verde. Such a regime will strengthen the commitment to the two virtuous objectives of 1998, making any overturn of the achievements accomplished to date less likely. Moreover, that would be obtained at no significant costs, given the structural characteristics of the economy of Cape Verde, the nominal convergence already achieved, and that the changes in the stance of ECB’s monetary policy are very likely to fit the cyclical needs of Cape Verde.
In the current stage of its economic evolution, euroization of Cape Verde would also be important for a number of additional reasons, such as the following: as the authorities intend to establish a full de jure capital account liberalization, euroization would render Cape Verde immune to speculative attacks; as euroization would eradicate any inflationary and exchange risks, the corresponding risk premia would dissipate and, country risk premium aside, the domestic interest rates would continue to converge to the EMU interest rates; with euroization, Cape Verde would forgo the current opportunity costs of having highly qualified human resources involved in monetary and exchange rate management tasks, an issue that might be relevant given the dimension of the country and its current development stage.
One argument that might be raised against euroization is that Cape Verde’s structural trade deficit may result in liquidity constraints if the inflows of emigrant remittances, international aid and foreign investment decelerate markedly. While this could be a problem, structural trade deficits can only be solved through a permanent increase in international competitiveness. In the case of Cape Verde, this is independent of the exchange rate regime; to overcome a structural trade deficit, exchange rate flexibility has no advantage over euroization. Under euroization, an extreme and highly persistent external deficit would lead to an increase in interest rates and, eventually, to a disruption of international credit. At the limit, the nation could only import – and consume – as much as it exported. Yet this is precisely the adjustment mechanism under devaluation, as the high pass-through would not increase exports and would not thus create any additional room for imports and consumption.
Finally, there are some economic and institutional issues concerning euroization that we have deliberately omitted in this paper. One is the loss of a lender of last resort and the loss of seignorage. It should be noted, yet, that these issues are typically raised under the assumption of a unilateral use of a foreign currency. Our view is that a proper euroization of Cape Verde should not be unilateral. Instead, we devise some euroization agreement – possibly within the auspices of the recently agreed strategic partnership between the EU and Cape Verde18 – in which adequate solutions could guarantee the existence of a lender of last resort and of transfers compensating for the loss of seignorage.19 This leads us to the issue of the formal model for euroization. While crucial, this political economy problem is far beyond the scope of this paper. The EU has already dealt with this issue regarding small European states that are not part of the EU (Monaco, San Marino and Vatican City) and will very likely have to deal with similar cases in the future. A model for international euroization agreements is an extremely relevant issue that should be addressed in separate research.
18 See the “Cap Vert – Communauté Européenne, Document de stratégie pays et Programme indicatif
national pour la période 2008-2013”, available at
http://ec.europa.eu/development/icenter/repository/scanned_cv_csp10_fr.pdf.
To conclude, it should be noted that the choice of the appropriate timing for euroization is also a relevant issue. Our analysis suggests that the time is ripe for the euroization of Cape Verde. However, given the current international financial crisis, it is advisable to wait for the turbulence to dissipate. Meanwhile, negotiations for an euroization agreement with the EU need not wait.
References
Alesina, Alberto and Robert Barro (2002), “Currency Unions”, Quarterly Journal of Economics, Vol. 107, No. 2, pp. 409-436.
Alesina, Alberto, Robert Barro and Silvana Tenreyro (2002), “Optimal Currency Areas”, NBER Macroeconomics Annual, Vol. 17, pp. 301-345.
Altavilla, Carlo (2004), “Do EMU Members Share the Same Business Cycle”, Journal of Common Market Studies, Vol. 42, No. 5, pp. 869-896.
Artis, Michael, Hans-Martin Krolzig and Juan Toro (2004), “The European Business Cycle”, Oxford Economic Papers, Vol. 56, No. 1, pp. 1-44.
Artis, Michael, Massimiliano Marcellino and Tommaso Proietti (2004), “Dating the Euro Area Business Cycle”, in Lucrezia Reichlin (Ed.) The Euro Area Business Cycle: Stylized facts and Measurement Issues. London, Centre for Economic Policy Research (CEPR), pp. 7-34.
Barro, Robert and David Gordon (1983), “Rules, Discretion, and Reputation in a Model of Monetary Policy”, Journal of Monetary Economics, Vol. 12, No. 1, pp. 101-121.
Baxter, Marianne and Robert King (1999), “Measuring Business Cycles: Approximate Band-Pass Filters for Economic Time Series,” The Review of Economics and Statistics, Vol. 81, No. 4, November, pp. 575-593.
Berg, Andrew and Eduardo Borensztein (2000), “The Pros and Cons of Full Dollarization”, International Monetary Fund Working Paper, No. WP/00/50, March.
Buigut, Steven and Neven Valev (2009), “Benefits from Mutual Restraint in a Multilateral Monetary Union”, World Development, Vol. 37, No. 3, pp. 585-594. Camacho, Maximo, Gabriel Perez-Quirós and Lorena Saiz (2007), “Do European Business Cycles Look Like One?”, Journal of Economic Dynamics & Control, Vol. 32, No. 7, July, pp. 2165-2190.
De Grauwe, Paul and Francesco Paolo Mongelli (2005), “Endogeneities of Optimum Currency Areas: What Brings Countries Sharing a Single Currency Closer Together?”, ECB Working Paper Series, No. 468, European Central Bank.
De Haan, Jakob, Robert Inklaar and Richard Jong-A-Pin (2008), “Will Business Cycle in the Euro Area Converge? A Critical Survey of Empirical Research”, Journal of Economic Surveys, Vol. 22, No. 2, pp. 234-273.
European Central Bank (1999), “Opinion of the European Central Bank at the request of the Council of the European Union on a recommendation for a Council Decision concerning exchange rate matters relating to the Cape Verde escudo, (CON/98/57) (1999/C 200/06)”, Official Journal of the European Communities C 200/7-8, 15.7.1999.
European Central Bank (2005), “Monetary Policy and Inflation Differentials in a Heterogeneous Currency Area”, ECB Monthly Bulletin, May, pp. 61-77.
European Council (1998), “Council Decision of 21 December 1998 concerning exchange rate matters relating to the Cape Verde escudo (98/744/EC)”, Official Journal of the European Communities L 358/111-2, 31.12.1998.
Frankel, Jeffrey and Andrew Rose (1997), “Is EMU more justifiable ex post than ex ante?”, European Economic Review, Vol. 41, No. 3-5, pp. 753-760.
Frankel, Jeffrey and Andrew Rose (1998), “The Endogeneity of the Optimum Currency Area Criteria”, The Economic Journal, Vol. 108, No. 449, pp. 1009-1025.
Furceri, Davide and Georgios Karras (2006), “Are the new EU members ready for the Euro? A comparison of costs and benefits”, Journal of Policy Modeling, Vol. 28, No. 1, pp. 25-38.
Giavazzi, Francesco and Marco Pagano (1988), “The Advantage of Tying One’s Hands: EMS Discipline and Central Bank Credibility”, European Economic Review, Vol. 32, No. 5, pp. 1055-1082.
Gros, Daniel and Carsten Hefeker (2007), “Monetary Policy in EMU with Asymmetric transmission and non-tradable goods”, Scottish Journal of Political Economy, Vol. 54, No. 2, pp. 268-282.
Harding, Don and Adrian Pagan (2002), “Dissecting the Cycle: A Methodological Investigation”, Journal of Monetary Economics, Vol. 49, No. 2, March, pp. 365-381.
Harding, Don and Adrian Pagan (2003), “A Comparison of Two Business Cycle Dating Methods”, Journal of Economic Dynamics & Control, Vol. 27, No. 9, July, pp. 1681-1690.
Harding, Don and Adrian Pagan (2005), “A Suggested Framework for Classifying the Modes of Cycle Research”, Journal of Applied Econometrics, Vol. 20, No. 2, pp. 151-159.
Harding, Don and Adrian Pagan (2006), “Synchronization of Cycles”, Journal of Econometrics, Vol. 132, No. 1, pp. 59-79.
Hodrick, Robert and Edward Prescott (1997), “Postwar U.S. Business Cycles: An Empirical Investigation,” Journal of Money, Credit and Banking, Vol. 29, No. 1, pp. 1-16.
Honohan, Patrick and Philip Lane (1999), “Pegging to the Dollar and the Euro,” International Finance, Vol. 2, No. 3, pp. 379-410.
Honohan, Patrick and Philip Lane (2001), “Will the Euro Trigger More Monetary Unions in Africa?”, chapter 12 in C. Wyplosz (ed.), The Impact of EMU on Europe and the Developing Countries, Oxford University Press, pp. 315-338. Honohan, Patrick and Philip Lane (2003), “Divergent inflation rates in EMU”,
Economic Policy, Vol. 18, No. 37, pp. 357-394.
International Monetary Fund (2008), “Cape Verde: Third Review under the Policy Support Instrument – Staff Report; Staff Supplement; Press Release on the Executive Board discussion; and Statement by the Executive Director for Cape Verde”, International Monetary Fund Country Report No. 08/37, January.
International Monetary Fund (2009), “Cape Verde: Fifth Review Under the Policy Support Instrument – Staff Report; Staff Supplement; Press Release on the Executive Board Discussion; and Statement by the Executive Director for Cape Verde”, International Monetary Fund Country Report No. 09/14, January.
Irwin, Gregor (2004), “Currency boards and currency crises”, Oxford Economic Papers, Vol. 56, No. 1, pp. 64-87.
LeBaron, Blake and Rachel McCulloch (2000), “Floating, Fixed, or Super-Fixed? Dollarization Joins the Menu of Exchange-Rate Options”, AEA Papers and Proceedings, American Economic Review, Vol. 90, No. 2, pp. 32-37.
Mink, Mark, Jan Jacobs and Jakob de Haan (2007), “Measuring Synchronicity and Co-Movement of Business Cycles with an Application to the Euro Area”, CESifo Working Paper Series No. 2112.
Neves, José Maria (2008), Speech given by the prime-minister of Cape Verde by the occasion of the 10th anniversary of the exchange rate agreement between Cape Verde and Portugal; 24 March; available at (accessed in January 2009):
http://www.governo.cv/index.php?option=com_content&task=view&id=686&Itemid=74.
Obstfeld, Maurice and Kenneth Rogoff (1995), “The Mirage of Fixed Exchange Rates”, Journal of Economic Perspectives, Vol. 9, No. 4, pp. 73-96.
Rand, John and Finn Tarp (2002), “Business Cycles in Developing Countries: Are They Different?”, World Development, Vol. 30, No. 12, pp. 2071-2088.
Ravn, Morten and Harald Uhlig (2002), “On Adjusting the Hodrick-Prescott Filter for the Frequency of Observations,” The Review of Economics and Statistics, Vol. 84, No. 2, May, pp. 371-376.
Rose, Andrew (2000), “One money, one market: the effect of common currencies on trade”, Economic Policy, Vol. 15, No. 30, pp. 9-45.