0CLEAN DEVELOPMENT MECHANISM PROJECT DESIGN DOCUMENT FORM (CDM-PDD)
Version 03 - in effect as of: 28 July 2006 CONTENTS
A. General description of project activity
B. Application of a baseline and monitoring methodology C. Duration of the project activity / crediting period D. Environmental impacts
E. Stakeholders’ comments
Annexes
Annex 1: Contact information on participants in the project activity Annex 2: Information regarding public funding
Annex 3: Baseline information Annex 4: Monitoring plan
SECTION A. General description of project activity A.1. Title of the project activity:
>>
Project Title: Sayalar Wind Farm Capacity Addition Project, Turkey PDD version: 1.0
Date: 13.10.2011
A.2. Description of the project activity:
>>
Summary:
The Sayalar Wind Farm is located in Agean Region, Manisa – Akhisar Province, Sayalar District in Turkey and is currently operational with an installed capacity of 34.2 MW (Hereafter referred as existing power plant. The existing power plant consists of 38 turbines with a capacity of 900 kW each. The existing 34.2 MW capacity of Sayalar Wind Farm has been registered as a Gold Standard VER project on 01/11/2007 under the registration number GS369 by “Doğal Enerji Elektrik Üretim A.Ş.”1.
The Project Participant is planning to increase the existing 34.2 MW capacity to 54.2 MW installed capacity with a 20MW capacity addition (hereafter referred as the proposed project activity) to the existing power plant2. The proposed project activity is developed by “Doğal Enerji Elektrik Üretim A.Ş.” (Hereafter referred as the project participant) and involves the installation of 10 wind turbines. The electricity generation from the capacity addition is estimated to reach approximately 55 GWh/year3 and will be delivered to the national grid via Akhisar Transformer Station.
The project activity aims to reduce GHGs by replacing electricity generation from the Turkish national grid system with electricity generation from wind energy, which has zero emissions. In accordance with the applicable methodology ACM0002 “Consolidated baseline methodology for grid connected electricity generation from renewable sources” v.12.1.0, the baseline emissions include only CO2 emissions from electricity generation in fossil fuel fired power plants that are displaced due to the project activity. The methodology assumes that all project electricity generation above baseline levels would have been generated by existing grid-connected power plants.
The annual emission reductions, which will result from the capacity addition, are estimated as 34,477 tCO2eq/year.
Contribution to Sustainable Development:
Renewable wind energy is an energy source that offers various environmental benefits. It does not result in emissions of pollutants into the atmosphere, nor does it emit residuals that can have an impact on soil
1
Reference: The Gold Standard Foundation Official Webpage, Public Reports, VER Projects /
https://gs1.apx.com/myModule/rpt/myrpt.asp?r=111 2
Reference: Generation License available to the DOE. 3
and water. The net result is a reduction of fossil fuel consumption that would occur in power stations connected to the national grid so as to produce an equivalent amount of energy. At the same time, wind energy is a renewable source. So it does not endanger the supply of energy for future generations. The project contributes significantly to the region’s sustainable development in the following ways:
• Wind energy is a renewable energy source. Unlike fossil fuels, it does not reduce the availability of energy for future generations.
• Reduction of greenhouse gas emissions and other pollutants in Turkey by replacing electricity otherwise generated by the Turkey’s national grid, which has a large share of fossil fuel power generation4.
• The project also reduces other emissions than GHG such as emissions of sulfur dioxide, nitrogen oxides, and particulates. In turn it contributes to local improvement of air quality.
• The project will enable the use of renewable energy in Turkey and attract foreign and private investment into the Turkey’s power sector.
• The project strengthens the involvement of Turkey in renewable energies and low carbon power production through the use of market mechanisms.
• Creation of local employment both during the construction and operational phase. Based on 2010 figures, the unemployment rate is above 11% in Turkey5.
• Technology and know-how transfer.
• Power supply improvement to the national grid both for domestic and commercial consumers.
• Diversification of electricity generation technologies in Turkey, which is currently dominated by natural gas fired power plants.
Additionally, no major negative impacts are expected as confirmed by the Local Stakeholders Consultation Meeting.
A.3. Project participants: >>
Name of Party involved (*) (host indicates a Host Party)
Private and/or public
entity(ies) project participants (*) (as a applicable)
Kindly indicate if the Party involved wishes to be considered as project participant (Yes/No) Turkey (host) Doğal Enerji Elektrik Üretim
A.Ş.
No
Doğal Enerji Elektrik Üretim A.Ş. is a special purpose company established jointly by Demirer Enerji Üretim Sanayi ve Ticaret A.Ş.6 and Polat Enerji Sanayi ve Ticaret A.Ş7.
4
80% of the total electricity generation of Turkey is from thermal power plants. Reference: TEIAS (Turkish Electricity Transmission Co) official webpage, 2009 statistics / http://www.teias.gov.tr/istatistik2009/32(75-09).xls 5
Reference: TUĐK (Turkish Stastical Institute) 2010 Statistical Yearbook Section 11 p193
http://www.teias.gov.tr/istatistik2009/32(75-09).xls 6
Reference: www.demirer.com.tr 7
OakDanışmanlık is the carbon consultant for this project8.
Full contact information for the project participants are provided in Annex 1. A.4. Technical description of the project activity:
A.4.1. Location of the project activity: A.4.1.1. Host Party(ies): >>
Republic of Turkey
A.4.1.2. Region/State/Province etc.: >>
Aegean Region, Manisa Province
A.4.1.3. City/Town/Community etc.: >>
The proposed project is located in Manisa – Akhisar Province Sayalar District. The closest residential area is the Deremahallesi Village.
8
A.4.1.4. Details of physical location, including information allowing the unique identification of this project activity (maximum one page):
>>
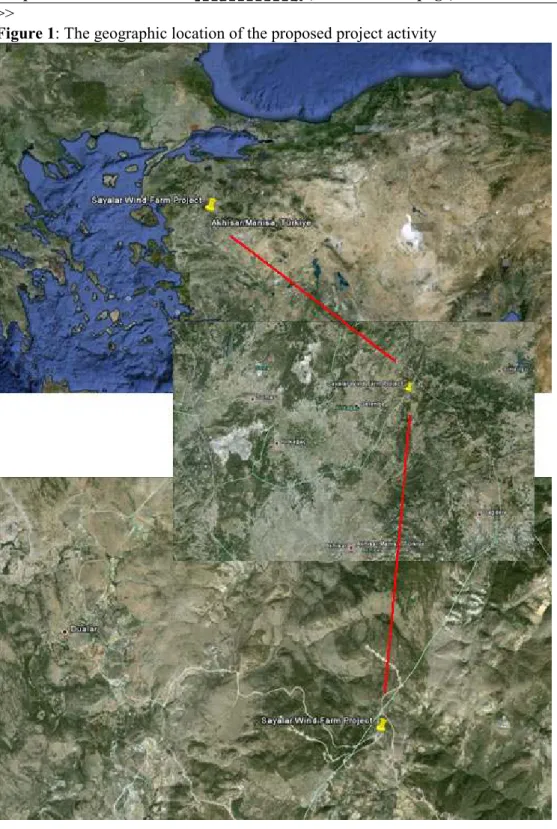
Figure 1: The geographic location of the proposed project activity
The coordinates of the centre point of the proposed project activity is 39°11'52.45" N; 27°57'45.55"E. The coordinates of the turbines are available to the DOE.
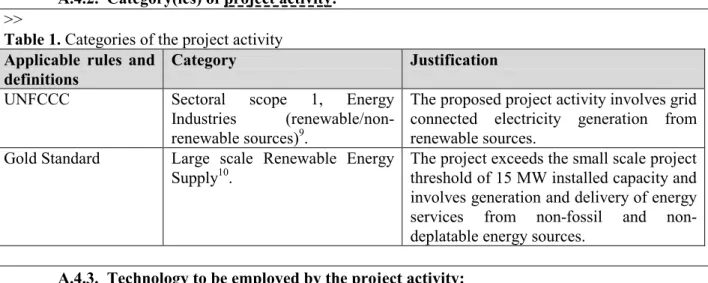
A.4.2. Category(ies) of project activity: >>
Table 1. Categories of the project activity Applicable rules and
definitions
Category Justification
UNFCCC Sectoral scope 1, Energy Industries (renewable/non-renewable sources)9.
The proposed project activity involves grid connected electricity generation from renewable sources.
Gold Standard Large scale Renewable Energy Supply10.
The project exceeds the small scale project threshold of 15 MW installed capacity and involves generation and delivery of energy services from non-fossil and non-deplatable energy sources.
A.4.3. Technology to be employed by the project activity: >>
The proposed project activity involves the installation of 10 units of additional wind turbines with a total installed capacity of 20 MW. The project activity is expected to generate approximately 55 GWh/year of net electricity. The total capacity addition will be reached by installation of Enercon gearless turbines. The key technical specifications of the turbines are as follows:
Table2. Key technical specifications of wind turbines
Parameter Value
Rated Power 2MW
Rotor Diameter 71 - 82 m
Turbine Concept Gearless, variable speed, single blade adjustment
Rotor Type Upwind rotor with active pitch control
Number of blades 3
Swept Area 3959 - 5281 m2
Hub Height 78 – 85 m
Blade Material GRP (epoxy resin); built in lightning protection
Rotational speed Variable, 6-21 rpm
Pitch Control Enercon single blade pitch system; one
independent pitch system per rotor blade with allocated emergency supply
Generator Enercon direct drive annular generator
Brake Systems - 3 independent pitch control systems
- Rotor brake - Rotor lock
Yaw System Active via yaw gear, load dependent damping
Cut out wind speed 28-34m/s
9
Sectoral scopes related approved methodologies and DOEs: http://cdm.unfccc.int/DOE/scopes.html 10
Gold Standard Toolkit, Chapter 1.2, p 20:
A.4.4. Estimated amount of emission reductions over the chosen crediting period: >>
Years Annual estimation of emission
reductions in tonnes of tCO2-eq
2012 14,36511 2013 34,477 2014 34,477 2015 34,477 2016 34,477 2017 34,477 2018 34,477 2019 20,11112
Total emission reductions (tonnes of
CO2-eq) 241,338
Total number of crediting years 7 Annual average over the crediting period of
estimated reductions (tonnes of CO2-eq) 34,477
A.4.5. Public funding of the project activity: >>
No public funding from the Annex I countries is provided to the proposed project.
11
It is estimated that the crediting period will start on 01.08.2012 12
SECTION B. Application of a baseline and monitoring methodology
B.1. Title and reference of the approved baseline and monitoring methodology applied to the project activity:
>>
Applied approved baseline and monitoring methodologies:
• Approved consolidated baseline methodology ACM0002 “Consolidated baseline methodology for grid-connected electricity generation from renewable sources”, version 12.1.0
Used tools:
• “Tool for the demonstration and assessment of additionality”, version 5.2.1
• “Tool to calculate the emission factor for an electricity system”, version 2.2.0 For more information regarding the methodology please refer to
http://cdm.unfccc.int/methodologies/PAmethodologies/approved.html
B.2. Justification of the choice of the methodology and why it is applicable to the project activity:
>>
The project activity involves capacity addition by installation of new wind turbines additional to the existing power plant and units. The existing power plant/units will continue to operate after the implementation of the proposed project activity. The applicability of the methodology and tools have been discussed below.
Applicability of ACM0002 version 12.1.0
The methodology ACM0002 “Consolidated baseline methodology for grid-connected electricity
generation from renewable sources” is applicable to grid-connected renewable power generation project activities that a) install a new power plant at a site where no renewable power plant was operated prior to the implementation of the project activity (greenfield); b) involve a capacity addition c) involve a retrofit of (an) existing plant(s); or d) involve a replacement of (an) existing plant(s).
Since the proposed project activity involves grid connected renewable power generation that involve a capacity addition, ACM0002 “Consolidated baseline methodology for grid-connected electricity
generation from renewable sources” version 12.1.0 is applicable. The applicability criteria and conditions are discussed in more detail as follows:
Ref. Applicability Criteria Justification A) The project activity is the installation,
capacity addition, retrofit or replacement of power plant/unit of one of the following types: hydro power plant/unit (either with a run-of-river reservoir or an accumulation reservoir), wind power plant/unit, geothermal power plant/unit, solar power plant/unit, wave power plant/unit or tidal
The project activity involves capacity addition of an existing power plant by installation of new wind power units. The existing power plant is currently in operation with 34.2 MW and the capacity will reach approximately 54.2 MW with an addition of 10 new wind turbine units.
power plant/unit;
B) In case of capacity additions, retrofits or replacements (except for wind, solar wave and tidal power capacity addition projects which use Option 2 to calculate the
parameter EGPJ,y): the existing plant started commercial operation prior to the start of minimum historical reference period of five years, used for the calculation of baseline emissions and defined in the baseline section, and no capacity expansion or retrofit of the plant has been undertaken between the start of this minimum historical reference period and the implementation of the project activity.
The proposed project activity involves wind power capacity addition and use Option 2 for the calculation of EGPJ,y, where EGPJ,y = EGPJ_ADD,y.
C) In case of hydro power plants, one of the following conditions apply:
- The project activity is implemented in an existing reservoir, with no change in the volume of reservoir; or
- The project activity is implemented in an existing reservoir, where the volume of reservoir is increased and the power density of the project activity, as per definitions given in the Project Emissions sections under the methodology, is greater than 4W/m2; or
- The project activity result in new reservoirs and the power density of the power plant, as per definitions given in the Project Emissions sections under the methodology, is greater than 4W/m2.
Since the proposed project is the capacity
addition to a wind power plant, this criteria is not applicable to the proposed project activity.
D) The methodology is not applicable to the following:
- Project activities that involve switching from fossil fuels to renewable energy resources at the site of project activity, since in this case the baseline may be the continued us use of fossil fuels at the site;
- Biomass fired power plants; - Hydro power plants that result in
new reservoirs or increase in
The proposed project is the capacity addition to a wind power plant and not involving switching from fossil fuels to renewable energy resources neither involved in biomass fired power plants.
existing reservoirs where the power density of the power plant is less than 4W/m2.
Based on the above arguments it could be concluded that the methodology ACM0002 “Consolidated baseline methodology for grid-connected electricity generation from renewable sources” version 12.1.0 is applicable to the proposed project activity.
In addition, the methodologies also refer to several tools described under section B.1 “Title and reference of the approved baseline and monitoring methodology applied to the project activity”. The applicability of these tools has been discussed below:
Applicability of “Tool for the demonstration and assessment of additionality” v 05.2:
The tool for demonstration and assessment of additionality provides a general framework demonstrating and assessing additionality and is applicable to a wide range of project types. As referred in ACM0002, the additionality tool is applicable for the proposed project activity.
Applicability of “Tool to calculate the emission factor for an electricity system” v 02.2:
This methodological tool determines the CO2 emission factor for displacement of electricity generated by power plants in an electricity system, by calculating the “combined margin” emission factor (CM) of the electricity system. This tool maybe applied to estimate the OM, BM and/or CM when calculating baseline emissions for a project activity that substitutes grid electricity. As the proposed project activity supplies electricity to the national grid, the “Tool to calculate the emission factor for an electricity system” v 02.2 is applicable to the project activity.
B.3. Description of the sources and gases included in the project boundary: >>
Spatial Boundary:
As per ACM0002 version 12.1.0, the spatial extent of the proposed project boundary includes the project power plant and all power plants connected physically to the electricity system, which the proposed project activity is connected to13.
Emission Sources:
The greenhouse gases and emission sources included in or excluded from the project boundary are shown in Table 2 as followed:
Table 3 Emission sources included in or excluded from the project boundary
Source Gas Included? Justification/Explanation Baseline CO2 emissions from
electricity generation in fossil fuel fired power plants that are displaced
CO2 Yes Main emission source CH4 No Minor emission source N2O No Minor emission source
13
due to the project activity. Project activity For geothermal power
plants, fugitive emissions of CH4 and CO2 from non-condensable gases
contained in geothermal steam.
CO2 No Since the proposed project activity involves energy generation from wind energy, project emissions from project activity is assumed to be zero. This is also in line with the requirements of ACM0002 (version 12.1.0)
CH4 No
N2O No
CO2 emissions from combustion of fossil fuels from electricity
generation in solar thermal power plants and geothermal power plants
CO2 No
CH4 No
N2O No
For hydro power plants, emissions of CH4 from the reservoir
CO2 No
CH4 No
N2O No
Figure 2: Project Boundary Existing Power Plant 34.2 MW Capacity Addition (Proposed Project Activity) 20 MW Private Electricity Meter Private Electricity Meter TEIAS Electricity Meter Akhisar Transformer Station Electricity System Project Boundary
B.4. Description of how the baseline scenario is identified and description of the identified baseline scenario:
>>
The proposed project activity is a capacity addition to an existing grid-connected renewable power plant/unit. The baseline scenario in accordance with ACM0002 v12.1.0 is defined as followed:
In the absence of the proposed VER project activity, the existing facility will continue to supply
electricity to the grid at historical levels. Since the project activity is based on wind energy and Option 2 is chosen for the determination of EGPJ,y, the baseline scenario for the proposed project is the equivalent annual net electricity generation supplied to the grid by the power units that have been added under the project activity.
B.5. Description of how the anthropogenic emissions of GHG by sources are reduced below those that would have occurred in the absence of the registered CDM project activity (assessment and demonstration of additionality):
>>
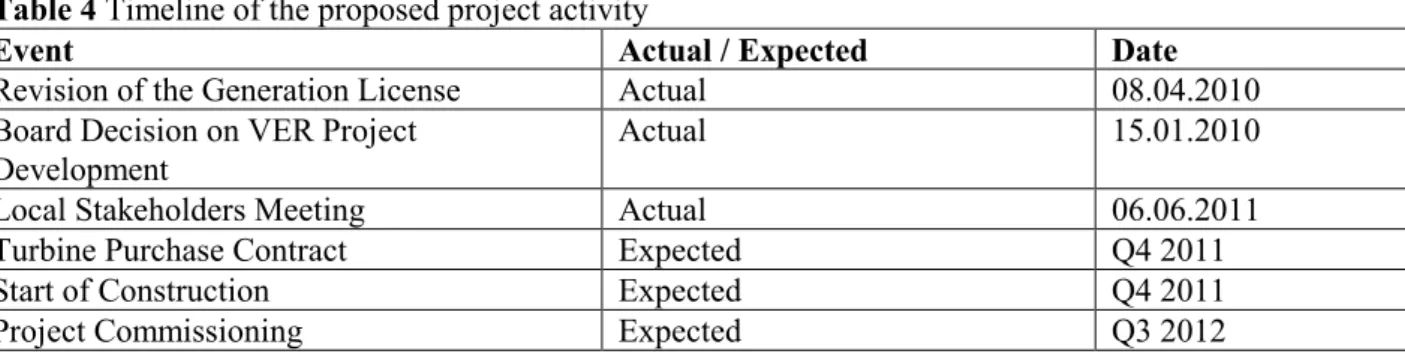
Timeline of the Project:
An overview of the implementation time line of the proposed project is presented in table 3 as followed: Table 4 Timeline of the proposed project activity
Event Actual / Expected Date
Revision of the Generation License Actual 08.04.2010
Board Decision on VER Project Development
Actual 15.01.2010
Local Stakeholders Meeting Actual 06.06.2011
Turbine Purchase Contract Expected Q4 2011
Start of Construction Expected Q4 2011
Project Commissioning Expected Q3 2012
Based on the events listed above, the project entity has been aware of the VER and the decision was based on VER revenues taken into account. The potential carbon revenue was vital for the project owner to go ahead with the implementation of the proposed project activity.
Approved consolidated baseline methodology ACM0002 “Consolidated baseline methodology for grid-connected electricity generation from renewable sources” version 12.1.0, requires the use of the latest “Tool for demonstration and assessment of additionality” (v05.2.1) agreed by the CDM Executive Board to demonstrate and assess the additionality of the proposed project.
The tool provides for a step-wise approach to demonstrate and assess additionality. These steps include:
• Identification of alternatives to the project activity;
• Investment analysis to determine that the proposed project activity is either 1) not the most economical or financial attractive, or 2) not economically or financially feasible;
• Barrier analyses; and
Step 1. Identification of alternatives to the project activity consistent with current laws and regulations
According to CDM Validation and Verification Manual14 (version 01.2), the PDD shall identify credible alternatives to the project activity in order to determine the most realistic baseline scenario, unless the approved methodology that is selected by the proposed CDM project activity prescribes the baseline scenario and no further analysis is required. Alternatives to the proposed project is not needed to be identified as the baseline scenario has been prescribed according to ACM0002 (v12.1.0) under section B.4.
Step 2. Investment analysis
According to “Tool for the demonstration and assessment of additionality” version 5.2.1, the economical or financial attractiveness of the proposed project should be determined without taking into consideration the VER revenues. It should be noted that the guidance provided by the Executive Board on investment analysis has been taken into account15. The following sub-steps are conducted in order to do the
investment analysis.
Sub-step 2a. Determination of an appropriate analysis method:
According to “Tool for the demonstration and assessment of additionality” version 5.2.1, simple cost analysis can only be applied to projects that do not generate any other financial benefits than the VER related incomes. Considering that the electricity produced by the proposed project will be sold to the national grid and is expected to create revenues, the simple cost analysis is discarded.
A benchmark analysis (option III) has been chosen as the appropriate analysis method. Sub-step 2b. Option III. Apply benchmark analysis
The following benchmark analysis applies the equity IRR as financial indicator. The Equity IRR is considered to be a suitable and widely used financial indicator to determine the attractiveness of equity investments.
When analysing a potential project, investors compare the equity IRR of the project against their required rate of return.
The approach to determine the benchmark against which the equity IRR shall be evaluated is option (a) from the “Tool for the demonstration and assessment of additionality” (Version 05.2.1):
"Government bond rates, increased by a suitable risk premium to reflect private investment and/or the project type, as substantiated by an independent (financial) expert or documented by official publicly available financial data; ..."
14
Reference: CDM Validation and Verification Manual, page 20 paragraph 105 15
In line with the requirements of “Tool for the demonstration and assessment of additionality” (Version 05.2.1) and its supporting guidelines, the expected return on equity is calculated based on; risk free rate, equity risk premium and the country risk premium.
Risk Free Rate: The risk free rate of return is the best rate that does not involve a risk. Both the return of the original capital and the payment of interest are completely certain. Government bonds are considered a risk free investment option, and their yields can be seen as a risk free rate of return. TCMB (Central Bank of Turkey) publishes Financial Stability Report periodically, which also includes data on long term bond rates. The latest and most up to date report is from March 2011. According to the official report the bond rates are 6.5%16.
Equity Risk Premium: The equity risk premium is the historical risk premium for a mature equity market. The US stock return over a long term provides the most ideal figure since this is by far the largest and most liquid market and one which provides data over the longest term. A value of 6.5% is used for the equity risk premium17.
Country Risk Premium: The risk premium for the host country is derived from Moody’s rating for Turkey. Turkey has a long-term rating of Ba2 which corresponds to a country risk premium of 4.1%18. Based on the above data set the required rate of return could be calculated as 17.1% for Turkey. Table 6 Benchmark for Turkey
Parameter Value Risk Free Rate 6.5% Equity Risk Premium 6.5% Country Risk Premium 4.1% Required Rate of Return 17.1% 16
Reference: TCMB Financial Stability Report March 2011 Section II page 16
http://www.tcmb.gov.tr/yeni/evds/yayin/finist/bolumII-12.pdf 17
Reference: Guidelines on the assessment of investment analysis version 5
http://cdm.unfccc.int/Reference/Guidclarif/reg/reg_guid03.pdf 18
Reference: New York University Stern School of Business, Risk Premiums for other markets July 2011
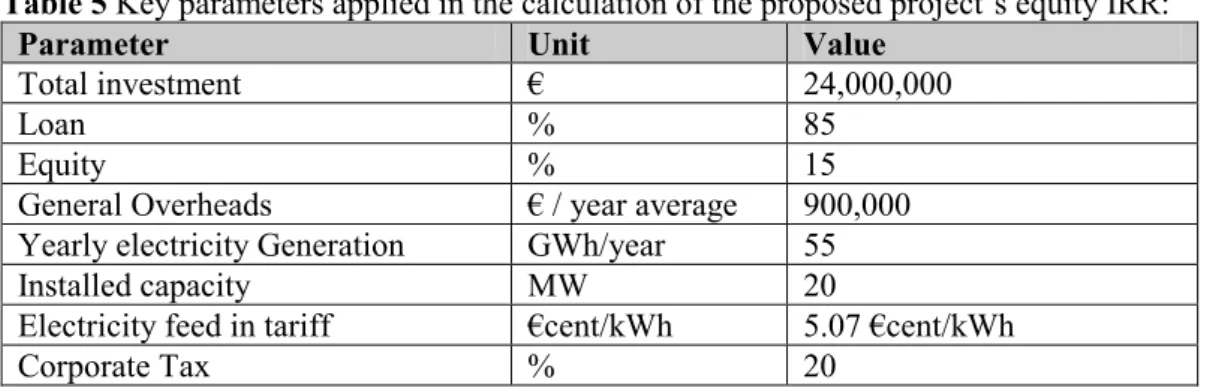
Sub-step 2c: Calculation and comparison of financial indicators The main financial indicators are presented in the below table:
Table 5 Key parameters applied in the calculation of the proposed project’s equity IRR:
Parameter Unit Value
Total investment € 24,000,000
Loan % 85
Equity % 15
General Overheads € / year average 900,000 Yearly electricity Generation GWh/year 55
Installed capacity MW 20
Electricity feed in tariff €cent/kWh 5.07 €cent/kWh
Corporate Tax % 20
The key assumptions for the calculation of the equity IRR are as follows:
- The calculation of the equity IRR of the proposed project activity includes all relevant costs and revenues19.
- The revenue from yearly electricity generation is based on the guaranteed feed in tariff applicable at the time of the investment decision20. According to the Law, the guaranteed feed in tariff for electricity generated from wind energy is 7.3 USDcent/kWh, which corresponds to approximately 5 €cent/kWh21 for the first 10 year period. For the remaining years a conservative market price of 6€cent/kWh has been applied.
- Input values used in the investment analysis are values valid and applicable for 2011.
- Only the portion of investment costs which is financed by equity have been considered as the net cash outflow and the portion of the investment cost which is financed by dept have not been considered as a cash outflow.
- 8 €/tCO2eq value has been taken for the GS VER credits, which is an average price for the GS VERs in the market.
The result of the equity IRR calculation with and without VER revenues are: Equity IRR without VERs -12%
Equity IRR with VERs -2%
It could be seen that the equity IRR of the project activity is below the financial benchmark of 17.1 % and cannot be considered to be a financially attractive alternative. With the introduction of expected revenues from VERs, although the equity IRR is still below the benchmark, the feasibility is increases, which has a positive impact on access to finance and has been the bases of the investment decision.
19
The full financial calculation is available to the DOE. 20
Reference: EMRA (Electricity Market Regulatory Authority) Law on Utilization of Renewable Energy Resources
http://www.epdk.gov.tr/documents/10157/4b360128-53aa-4174-8104-a6c10434ac9c 21
As per 09.09.2011, the euro/dollar exchange rate is observed to fluctuate between 1.43 and 1.45 for the past three months. An average exchange rate of 1.44 €/USD has been used. Reference: Central Bank of Republic of Turkey
Sub-step 2d: Sensitivity Analysis
The objective of the sensitivity analysis is to show whether the conclusion regarding the financial attractiveness is robust to reasonable variations in the critical assumptions. According to the Annex 5 of EB 62 “Guidelines on the assessment of Investment analysis” version 5, only variables including the initial investment cost, that constitute more than 20% of either total project costs or total project revenues should be subjected to reasonable variation.
In line with the guidelines, important parameters for the feasibility of the proposed project activity are defined as total investment, electricity price, electricity generation and general overheads. The mentioned parameters have been tested with a range of ±10% for the sensitivity analysis.
The following table demonstrates the results for a ±10% deviation of selected parameters which increase the equity IRR.
Table 6 Sensitivity Analysis of the equity IRR with variations in total investment, electricity price, electricity generation, investment and general overheads.
Parameter Value Applied Equity IRR
Reached Without VER
Equity IRR Reached WithVER Electricity Price 8,03 USDcent/kWh (+10%) 2% 8% Electricity
Generation
60,500 MWh/year (+10%) -4% 5%
General Overheads 794,000 €/year average (-10%) -9% 0% Total investment 21.6 million € (-10%) -6% 4% Discussion on the probability of the deviations:
Electricity Price:
One of the most important parameter that has an impact to the equity IRR of the project is the electricity sales price. For the sensitivity analysis the electricity price was increased 10% from the guaranteed price of 7,3 to 8,03 USDcent/kWh for the whole assessment period and observed that the equity IRR reaches to 2% without taking into the VER revenues and to 8% taking into account the VER revenues, which is still below the benchmark value.
The Law on Utilization of Renewable Energy Resources, provides a guaranteed electricity tariff of 7.3 USDcent/kWh to the electricity generated from wind energy resources, which is applicable for a 10 year period. In addition to this guaranteed price, the Law also introduces an additional incentive to projects benefiting from local equipment in their project activity. According to the Law, wind energy projects using local equipment could be rewarded by a plus incentive as indicated under Table II of the Law on top of the guaranteed price of 7,3 USDcent/kWh. Although it is not for certain that the proposed project will be eligible for this plus incentive, since the blades and turbine masts used in the proposed project activity are produced locally, the project activity has a significant chance to be rewarded a +1.4
USDcent/kWh22. This plus incentive will be applicable only for a 5 year period. If this would be the case the electricity tariff applicable to the project activity for the first 5 years will be 8.7 USDcent/kWh. If the equity IRR calculation is re-executed for this price the equity IRR reaches to -9%, which is within the sensitivity range.
Electricity Generation:
Another important parameter that has an impact on the equity IRR is the net electricity generation delivered to the electricity system. For the sensitivity analysis, the electricity generation is increased by 10% from the value of 55GWh/year to 60.5GWh/year and observed that the equity IRR reaches to -4% without taking into the VER revenues and to 5% taking into account the VER revenues, which is still below the benchmark value. It should be noted that the equity IRR doesn’t reach to the benchmark even with a net electricity generation of 74.25GWh/year, which corresponds to a 35% of increase.
An average annual electricity generation of 55GWh/year has been estimated based on micro-siting23, which corresponds to a load factor of 31,4%. Since the existing capacity of 34.2 MW is operational since 2008, an accurate performance of the project location is known to the Project Participant. The actual readings indicate a capacity factor of approximately 27% load factor for the project and therefore an increase over 35% of the expected generation (corresponding to a load factor of 42%) is not realistic.
General Overheads:
The impact of a deviation in general overheads is relatively insignificant compared to changes in other parameters. For the sensitivity analysis, the general overheads are decreased by 10% from the value of approximately 900,000 €/year average to approximately 794,000 €/year average and observed that the equity IRR reaches to -9% without taking into the VER revenues and to 0% taking into account the VER revenues, which is still below the benchmark value. Even if the general overheads are considered to be “0”, the equity IRR does not reach to the benchmark.
Total Investment:
For the sensitivity analysis, the total investment costs are decreased by 10% from the value of 24 million € to 21.6 million € (approximately 1 million €/MW) and observed that the equity IRR reaches to -6% without taking into the VER revenues and to 4% taking into account the VER revenues, which is still below the benchmark value. The equity IRR cannot even reach to the benchmark when the total investment is considered to be as low as 16.8 million €s, which is 30% lower than the estimated investment. Taking into account the fact that the investment cost of an average turbine is 1.23 million/MW24, a major deviation from the estimated investment costs is not realistic.
22
According to Table II of the Law on Utilization of Renewable Energy Resources, +0.8 USDcent/kWh is rewarded for locally produced turbine blades and +0.6 USDcent/kWh is rewarded for locally produced turbine masts. 23
Technical feasibility is available to the DOE. 24
Reference: EWEA (European Wind Energy Association) “Wind Energy –The Facts Report, page 13 Part III, The Economics of Wind Power.
Outcome of Step2:
The sensitivity analysis shows that the equity IRR of the proposed project does not overcome the financial benchmark despite favourable conditions.
The sensitivity analysis further substantiates that the project activity is not a financially attractive alternative and therefore additional.
Step 3. Barrier analysis
Sub-step 3a. Identify barriers that would prevent the implementation of the proposed CDM project activity:
Without being registered as a VER project, the proposed project activity faces barriers that would prevent its implementation. The main barrier towards the implementation of the project activity could be characterized as “limited access to financing” due to unfavourable investment and financial structure which results in high risks and limited access to project financing.
Limited access to project financing:
Waste management projects need a high level of financing and long repayment periods. In the proposed project activity, it is envisaged that 85% of the investment will be realised with debt funding and 15% from equity. However the project participants face barriers to secure loan from finance institutions / creditor banks. The additional revenues from potential VER sales are considered to be an important revenue stream and play an important role on securing a debt funding. Wind energy investments are still perceived as investments with high risks and unfavourable investment and finance structure. Although there is a guaranteed electricity tariff for wind energy in Turkey, it is still not enough to secure an attractive feasibility and therefore extra revenues such as VERs are considered to have a positive impact on the bankability of the project from the creditors point of view.
Outcome of Step 3a:
“Investment Barriers” is identified as one of the major barriers that prevent the Project Participant from carrying out the proposed project activity
Step 4: Common practice analysis
Sub-step 4 a: Analyse other activities similar to the proposed project activity:
As per the “Tool for the demonstration and assessment of the additionality” version 5.2.1, an analysis of any other activities that are operational and that are similar to the proposed project activity must be provided. Projects are considered similar if they are in the same country/region and/or rely on a broadly similar technology, are of similar scale, and take place in a comparable environment with respect to regulatory framework, investment climate, access to technology, access to financing, etc.
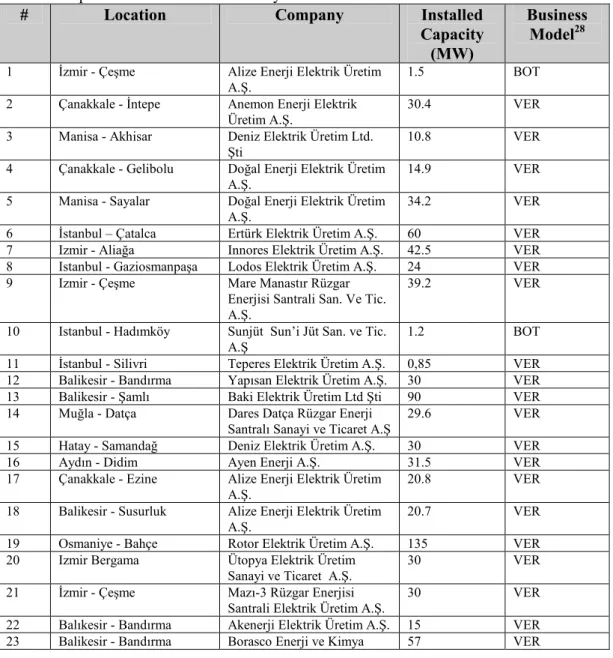
The project activities have been tracked from EMRA (Electricity Market Regulatory Authority) Generation Licenses25. Currently there are 41 wind farm projects that are connected and operational in
25
Reference: EMRA / Development of Wind Energy in Turkey
Turkey26. The total installed capacity reaches to 1493 MW, which constitutes less than 3% of the total installed capacity of Turkey27.
A list of the operational wind farms are presented below: Table 8. Operation wind farms in Turkey
# Location Company Installed
Capacity (MW)
Business Model28 1 Đzmir - Çeşme Alize Enerji Elektrik Üretim
A.Ş.
1.5 BOT
2 Çanakkale - Đntepe Anemon Enerji Elektrik Üretim A.Ş.
30.4 VER
3 Manisa - Akhisar Deniz Elektrik Üretim Ltd. Şti
10.8 VER
4 Çanakkale - Gelibolu Doğal Enerji Elektrik Üretim A.Ş.
14.9 VER
5 Manisa - Sayalar Doğal Enerji Elektrik Üretim A.Ş.
34.2 VER
6 Đstanbul – Çatalca Ertürk Elektrik Üretim A.Ş. 60 VER 7 Izmir - Aliağa Innores Elektrik Üretim A.Ş. 42.5 VER 8 Istanbul - Gaziosmanpaşa Lodos Elektrik Üretim A.Ş. 24 VER 9 Izmir - Çeşme Mare Manastır Rüzgar
Enerjisi Santrali San. Ve Tic. A.Ş.
39.2 VER
10 Istanbul - Hadımköy Sunjüt Sun’i Jüt San. ve Tic. A.Ş
1.2 BOT
11 Đstanbul - Silivri Teperes Elektrik Üretim A.Ş. 0,85 VER 12 Balikesir - Bandırma Yapısan Elektrik Üretim A.Ş. 30 VER 13 Balikesir - Şamlı Baki Elektrik Üretim Ltd Şti 90 VER 14 Muğla - Datça Dares Datça Rüzgar Enerji
Santralı Sanayi ve Ticaret A.Ş
29.6 VER
15 Hatay - Samandağ Deniz Elektrik Üretim A.Ş. 30 VER 16 Aydın - Didim Ayen Enerji A.Ş. 31.5 VER 17 Çanakkale - Ezine Alize Enerji Elektrik Üretim
A.Ş.
20.8 VER
18 Balikesir - Susurluk Alize Enerji Elektrik Üretim A.Ş.
20.7 VER
19 Osmaniye - Bahçe Rotor Elektrik Üretim A.Ş. 135 VER 20 Izmir Bergama Ütopya Elektrik Üretim
Sanayi ve Ticaret A.Ş.
30 VER
21 Đzmir - Çeşme Mazı-3 Rüzgar Enerjisi Santrali Elektrik Üretim A.Ş.
30 VER
22 Balıkesir - Bandırma Akenerji Elektrik Üretim A.Ş. 15 VER 23 Balikesir - Bandırma Borasco Enerji ve Kimya 57 VER
26
As per 17.08.2011. 27
The total installed capacity of Turkey is 44,761 MW for year 2009. Reference: TEIAS (Turkish Electricity Transmission CO) Annual development of Turkeys Installed capacity 2009
http://www.teias.gov.tr/istatistik2009/1.xls 28
Reference: Gold Standard Foundation VER Project Registry Page
Sanayi ve Ticaret A.Ş. 24 Manisa - Soma Soma Enerji Elektrik Üretim
A.Ş.
79.2 VER
25 Hatay - Belen Belen Elektrik Üretim A.Ş. 36 VER 26 Tekirdağ - Şarköy Alize Enerji Elektrik Üretim
A.Ş.
28.8 VER
27 Izmir – Urla Kores Kocadağ Rüzgar Enerji Santralı Üretim A.Ş.
15 VER
28 Balıkesir - Bandırma As Makinsan Temiz Enerji Elektrik Üretim San. ve Tic. A.Ş.
24 VER
29 Mersin Mut Akdeniz Elektrik Üretim A.Ş. 33 VER 30 Edirne - Enez Boreas Enerji Üretim
Sistemleri A.Ş.
15 VER
31 Izmir - Bergama Bergama RES Enerji Üretim A.Ş.
90 VER
32 Hatay - Belen Bakras Enerji Elektrik Üretim ve Tic. A.Ş.
15 VER
33 Hatay - Samandağ Ziyaret RES Elektrik Üretim San. ve Tic. A.Ş.
35 VER
34 Manisa - Soma Bilgin Rüzgar Santrali Enerji Üretim A.Ş.
90 VER
35 Manisa – Kırkağaç Alize Enerji Elektrik Üretim A.Ş.
25.6 VER
36 Çanakkale - Ezine Garet Enerji Üretim ve Ticaret A.Ş.
22.5 VER
37 Aydin - Çine Sabaş Elektrik Üretim A.Ş. 24 VER 38 Çanakkale - Ezine Enerjisa Enerji Üretim A.Ş. 29.9 VER 39 Balikesir - Susurluk Alentek Enerji A.Ş. 45 VER 40 Balikesir – Havran Alize Enerji Elektrik Üretim
A.Ş.
16 VER
41 Balikesir - Bandırma Galata Wind Enerji Ltd. Şti 90 VER
TOTAL 1493.15
In line with the requirements of the “Tool for the demonstration and assessment of the additionality” version 5.2.1, the following scope of assessment has been applied in selecting the “similar project activities”:
- Turkey as the geographical scope
- Project activities with an installed capacity over 2 MW (project activities with an installed capacity smaller than 2 MW could be considered as pilot or demo project since it only involves 1 or 2 turbine units)
- In line with the requirements of the tool, VER project activities will be excluded from the common practice analysis29.
Based on the above information it is clear that there are no similar project activities in Turkey, which are not developed with a business model excluding VER revenues, hence it can be concluded that wind projects are not a common practice and the technology has not yet diffused in Turkey.
29
The term CDM and UNFCCC under the tool is interpreteed as VER and Gold Standard respectively (Sub step 4a: Analyze other activities similar to the proposed Project activity).
Substep 4 b: Discuss any similar options that are occurring:
There are no similar options occurring which do not rely on VER revenues for their implementation. The proposed project activity is therefore not common practice and hence proves to be additional. B.6. Emission reductions:
B.6.1. Explanation of methodological choices: >>
The emission reductions for the proposed project activity are calculated according to ACM0002 “Consolidated baseline methodology for grid connected electricity generation from renewable sources” version 12.1.0.
Emission Reductions
The emission reductions are calculated based on the following formula:
Y Y y BE PE
ER = − (1)
Where:
ERy Emission reductions in year y (tCO2e/year) BEy Baseline emissions in year y (tCO2e/year) PEy Project emissions in year y (tCO2e/year)
Project Emissions
In accordance with the methodology ACM0002 “Consolidated baseline methodology for grid-connected electricity generation from renewable sources” (version 12.1.0), no project emissions need to be
considered. Project emissions apply only for geothermal power plants, solar thermal power plants and for some hydro power plants. Therefore
PEy= 0
Baseline Emissions
According to the methodology ACM0002 “Consolidated baseline methodology for grid-connected electricity generation from renewable sources” (version 12.1.0), baseline emissions include only CO2 emissions from electricity generation in fossil fuel fired power plants that are displaced due to the project activity. The methodology assumes that all project electricity generation above baseline levels would have been generated by existing grid-connected power plants and the addition of new grid-connected power plants. The baseline emissions are calculated as follows:
CM grid y PJ y EG EF BE = , ⋅ , (2) Where:
Calculation of EGPJ,y
The calculation of EGPJ,y is different for (a) greenfield plants; (b) retrofits and replacements and; (c) capacity additions. Since the proposed project activity falls under the description capacity addition, the following method has been adopted.
Capacity addition to an existing renewable energy power plant
In case of wind energy, it is assumed that the addition of new capacity does not significantly affect the electricity generated by existing power plant(s) or unit(s). In this case, the electricity fed into the grid by the added power plant(s) or unit(s) could be directly metered and used to determine EGPJ,y.
If the project activity is a capacity addition, project participants may use one of the following options to determine EGPJ,y:
Option 1: Use the approach applied to retrofits and replacements as described in the ACM0002
“Consolidated baseline methodology for grid-connected electricity generation from renewable sources” (version 12.1.0). EGFacility,y corresponds to the total electricity generation of the existing plant(s) or unit(s) and the added plant(s) and unit(s). A separate metering of the electricity fed into the grid by the added plant(s) or unit(s) is not necessary under this option.
Option 2: For wind, solar, wave and tidal power plant(s) or unit(s), the following approach can be used provided that the electricity fed into the grid by the added power plant(s) or unit(s) addition is separately measured: y ADD PJ y PJ EG EG , = _ , (3) Where:
EGPJ,y Quantity of net electricity generation that is produced and fed into the grid as a result of the implementation of the VER project activity in year y (MWh/yr)
EGPJ_ADD,y Quantity of net electricity generation supplied to the grid in year y by the project plant/unit that has been added under the project activity (MWh/yr)
The Project Participants choose Option 2, and the electricity fed into the grid by the added power plant(s) or unit(s) addition will be separately measured.
BEy = Baseline emissions in year y (tCO2/year)
EG PJ,y = Quantity of net electricity generation that is produced and fed into the grid as a result of the implementation of the CDM project activity in year y (MWh/yr)
EFgrid,CM = Combined margin CO2 emission factor for grid connected power generation calculated using the latest version of the “Tool to calculate the emission factor for an electricity system”. The combined margin is calculated ex-post and has been fixed for the first crediting period.
Leakage
In line with the requirements of ACM0002 “Consolidated baseline methodology for grid-connected electricity generation from renewable sources” (version 12.1.0), no leakage emissions are considered. The main emissions potentially giving rise to leakage in context of electric sector projects are emissions arising due to activities such as power plant construction and upstream emissions from fossil fuel use (e.g. extraction, processing and transport). These emission sources are neglected.
Calculation of EFgrid,CM
As referred in ACM0002 “Consolidated baseline methodology for grid-connected electricity generation from renewable sources” (version 12.1.0), EFgrid,CM is calculated according to the “Tool to calculate the emission factor for an electricity system” version 02.2.0.
This tool provides the following steps to calculate combined margin (CM) emission factor: Step 1. Identify the relevant electric systems;
Step 2. Choose whether to include off-grid power plants in the project electricity system (optional); Step 3. Select an operating margin (OM) method;
Step 4. Calculate the operating margin emission factor according to the selected method; Step 5. Calculate the build margin (BM) emission factor.
Step 6. Calculate the combined margin (CM) emissions factor. Step 1. Identification of the relevant electric power system
According to the “Tool to calculate the emission factor for an electricity system” (version 02.2), a project electricity system has to be defined by the spatial extent of the power plants that are physically connected through transmission and distribution lines to the project activity and that can be dispatched without significant transmission constraints.
Similarly, a connected electricity system, e.g. national or international, is defined as an electricity system that is connected by transmission lines to the project electricity system. Power plants within the connected electricity system can be dispatched without significant transmission constraints but transmission to the project electricity system has significant transmission constraint.
The transmission lines in Turkey are operated by TEĐAŞ (Turkish Electricity Transmission CO), which is a state owned company. The grid is 48.971 km long and constitutes of 606 transformer stations with a total transformer capacity of 98,852 MVA and 10 interconnections to neighbour countries30. The interconnected grid system is operated continuously and there are no electricity price differences throughout the regions31. Therefore the relevant electric power system is defined as the national grid system of Turkey.
30
In compliance with the requirements of the applicable tool, the emission factor from neighbouring countries is considered 0 tCO2eq/MWh for determining the OM.
31
Step 2. Choose whether to include off-grid power plants in the project electricity system (optional). According to the applicable tool, Project Participants may choose between the following two options to calculate the operating margin and build margin emission factor:
Option I: Only grid power plants are included in the calculation.
Option II: Both grid power plants and off-grid power plants are included in the calculation.
The Project Participant chooses Option I and therefore only grid power plants are included in the calculation.
Step 3. Selection of an operating margin (OM) method
According to the applicable methodological tool, the operating margin emission factor (EF grid, OM, y) is based on one of the following methods:
a) Simple OM; or
b) Simple adjusted OM; or c) Dispatch data analysis OM; or d) Average OM.
Options b) and c) are not selected since there is no data available for these options. Option d) is not selected since low-cost/must-run resources do not constitute more than 50% of total grid generation. According to the tool, Simple OM can only be if low-cost/must-run resources constitute less than 50% of total grid generation. The low-cost/must-run resources include hydro, geothermal, wind, low-cost
biomass, nuclear, and solar power generation.
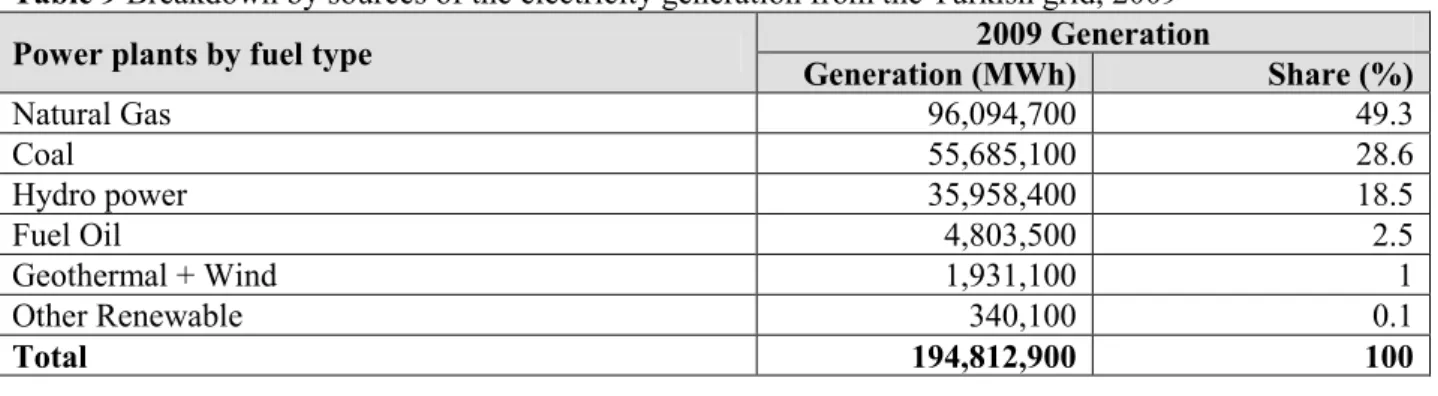
The share of the installed capacity of renewable energy sources excluding hydro power is 1.1% of the total electricity generation and is therefore not taken into consideration. There is no indication that coal is used as a must-run and no nuclear energy plants are located in Turkey. That leaves hydro power as the only relevant low-cost must run source for electricity. The electricity generation from hydro power is 18.5% of the total electricity generation. Therefore the requirements for the use of the Simple OM calculations are satisfied.
Table 9 Breakdown by sources of the electricity generation from the Turkish grid, 200932
Power plants by fuel type 2009 Generation
Generation (MWh) Share (%) Natural Gas 96,094,700 49.3 Coal 55,685,100 28.6 Hydro power 35,958,400 18.5 Fuel Oil 4,803,500 2.5 Geothermal + Wind 1,931,100 1 Other Renewable 340,100 0.1 Total 194,812,900 100 32
For the simple OM, the emissions factor can be calculated using either of the two following data vintages:
• Ex ante option: If the ex ante option is chosen, the emission factor is determined once at the validation stage, thus no monitoring and recalculation of the emissions factor during the crediting period is required. For grid power plants a 3-year generation-weighted average, based on the most recent data available at the time of submission of the VER-PDD to the DOE for validation.
• Ex post option: If the ex post option is chosen, the emission factor is determined for the year in which the project activity displaces grid electricity, requiring the emissions factor to be updated annually during monitoring.
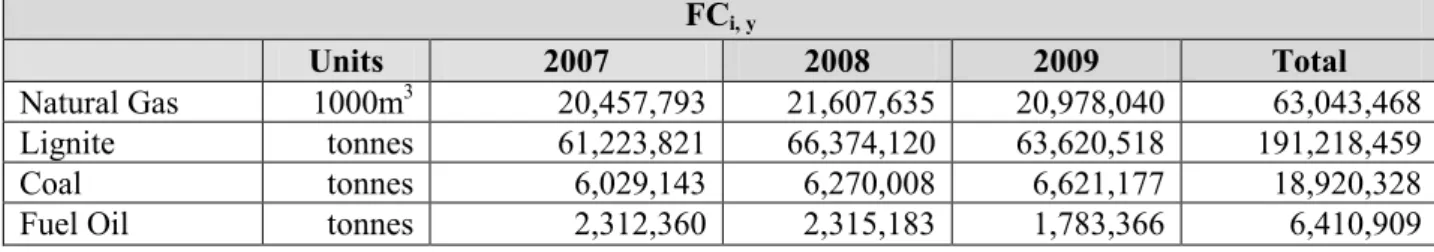
For the proposed project activity the ex ante option is selected. Data for calculating the three year average is obtained from the period 2007 – 2009 which are the most recent data available at the time of submission of the PDD to DOE.33
Step 4. Calculating the operating margin emission factor according to the selected method
The simple OM emission factor is calculated as the generation-weighted average CO2 emissions per unit net electricity generation (tCO2e/MWh) of all generating power plants serving the system, not including low-cost / must-run power plants / units. It may be calculated:
Option A: Based on the net electricity generation and a CO2 emission factor of each power unit; or Option B: Based on the total net electricity generation of all power plants serving the system and the fuel types and total fuel consumption of the project electricity system.
As the fuel consumption and the average efficiency data for each power plant / unit is not available Option B is used for simple OM calculation.34
Option B: Calculation based on total fuel consumption and electricity generation of the system
As Option B is used, the simple OM emission factor is calculated based on the net electricity supplied to the grid by all power plants serving the system, not including low-cost/must run power plants/units, and based on the fuel type(s) and total fuel consumption of the project electricity system as follows:
2 , , , , , , i y i y CO i y i grid OMsimple y y
FC
NCV
EF
EF
EG
×
×
∑
(4) Where:EFgrid,OMsimple,y Simple operating margin CO2 emission factor in year y (tCO2/MWh)
FCi,y Amount of fossil fuel type i consumed in the project electricity system in year y (mass
33
The index “y” in the equations refers to the years 2007-2009 to calculate the emission factor ex-ante. 34
or volume unit)
NCVi,y Net calorific value (energy content) of fossil fuel type i in year y (GJ / mass or volume unit)
EFCO2, i,y CO2 emission factor of fossil fuel type i in year y (tCO2/GJ)
EGy Net electricity generated and delivered to the grid by all power sources serving the system, not including low-cost/must run power plants/units, in year y (MWh) i All fossil fuel types combusted in power sources in the project electricity system in
year y
y The three most recent years for which data is available at the time of submission of the PDD to the DOE for validation (ex-ante option)
For this approach (simple OM) to calculate the operating margin, subscript m refers to the power plants/units delivering electricity to the grid, not including low-cost/must run power plants/units, and including electricity imports to the grid.
Step5. Calculation of the build margin emission factor
In terms of vintage of data, project participants can choose between one of the following two options: Option 1: For the first crediting period, calculate the build margin emission factor ex ante based on the most recent information available on units already built for sample group m at the time of VER PDD submission to the DOE for validation. For the second crediting period, the build margin emission factor should be updated based on the most recent information available on units already built at the time of submission of the request for renewal of the crediting period to the DOE. For the third crediting period, the build margin emission factor calculated for the second crediting period should be used. This option does not require monitoring the emission factor during the crediting period.
Option 2: For the first crediting period, the build margin emission factor shall be updated annually, ex post, including those units built up to the year of registration of the project activity or, if information up to the year of registration is not yet available, including those units built up at the latest year for which information is available. For the second crediting period, the built margin emission factor shall be calculated ex ante, as described in Option 1 above. For the third crediting period, the built margin emission factor calculated for the second crediting period should be used.
For the proposed project activity the Project Participant chooses Option 1 in terms of vintage of data. The sample group of power units m used to calculate the build margin should be determined as per the following procedure, consistent with the data vintage selected above:
(a) Identify the set of five power units, excluding power units registered as VER project activities, that started to supply electricity to the grid most recently (SET5-units) and determine their annual electricity generation (AEGSET-5-units, in MWh).
(b) Determine the annual electricity generation of the project electricity system, excluding power units registered as VER project activities (AEGtotal, in MWh). Identify the set of power units, excluding power units registered as VER project activities, that started to supply electricity to the grid most recently and that comprise 20% of total AEGtotal (if 20% falls on part of the generation
of a unit, the generation of that unit is fully included in the calculation) (SET>20%) and determine their annual electricity generation (AEGSET>20%, in MWh);
(c) From SET5-units and SET>20% select the set of power units that comprise the larger annual electricity generation (SETsample);
Identify the date when the power units in SETsample started to supply electricity to the grid. If none of the power units in SETsample started to supply electricity to the grid more than 10 years ago, then use the SETsample to calculate the build margin.
The most recent information available belongs to 2009 and based on TEIAŞ statistics which is the official information source for the grid35. According to TEIAŞ figure, the annual electricity generation of the project electricity system excluding power units registered as VER project activities (AEGtotal) is 194,912,900 MWh36. Based on the AEGtotal, the set of power units, excluding power units registered as VER project activities, that started to supply electricity to the grid most recently and that comprise 20% of total AEGtotal, have been defined and the AEGSET>20% is determined as 39,022,327 MWh37 and includes 239 units of power plants under SET>20%. Without the need of any further assessment it can be concluded that the SET5-units << SET>20% and therefore the SET>20% is selected as SETsample38 for the calculation of the build margin (BM)39.
The built margin (BM) emission factor is the generation-weighted average emission factor (tCO2/MWh) of all power units m during the most recent year y for which power generation data is available40, calculated as follows: , , , , , , m y EL m y m grid BM y m y m
EG
EF
EF
EG
×
=
∑
∑
(5) Where:EFgrid,BM,y Build margin CO2 emissions factor in year y (tCO2/MWh)
EGm,y Net quantity of electricity generated and delivered to the grid by power unit m in year y (MWh)
35
Reference: www.teias.gov.tr 36
Reference: Turkish Electricity Transmission Co / http://www.teias.gov.tr/istatistik2009/41.xls 37
Reference: Turkish Electricity Transmission Company / http://www.teias.gov.tr/istatistikler.htm; year 2009-2008-2007-2006.
38
None of the power units in SETsample started to supply electricity to the grid more than 10 years ago. 39
Please refer to Annex 3 of the PDD for more detailed information on SETsample. 40
The most recent year for which power generation data is available is 2009. Reference: TEIAŞ Generation and Transmission Statistics www.teias.gov.tr
EFEL,m,y CO2 emission factor of the power unit m in year y (tCO2/MWh) m Power units included in the build margin
y Most recent historical year for which power generation data is available
As per the “Tool to calculate the emission factor for an electricity system” (version 02.2.0), the CO2 emission factor of each power unit m (EFEL,m,y) should be determined as per the guidance from the tool in step 4 for simple OM, using options A1, A2 or A3, using for y the most recent historical year for which power generation data is available, where m is the power units included in the build margin.
As plant specific fuel consumption data is not available for Turkey, option A2 has been selected for the calculation of the CO2 emission factor of each power unit m (EFEL,m,y) as follows:
y m y i CO y m EL
EF
EF
, , , , ,6
.
3
2η
⋅
=
(6) Where:EFELm,y CO2 emission factor of the power unit m in year y (tCO2/MWh)
EFCO2,m,i,y Average CO2 emission factor of fuel type i used in power unit m in year y (tCO2/GJ) ηm,y Average net energy conversion efficiency of power unit m in year y (ratio)
m All power units serving the grid in year y except low-cost/must-run power units y The most recent year for which power generation data is available at the time of
submission of the VER-PDD to the DOE for validation (ex-ante option)
Where several fuel types are used in the power unit, the lowest CO2 emission factor for EFCO2,m,i,y has been used.
Step 6. Calculation of the combined margin emission factor
According to the applicable methodological tool, the calculation of the combined margin (CM) emission factor (EFgrid, CM) is based on one of the following methods:
(a) Weighted average CM; or (b) Simplified CM.
In line with the requirements of the applicable tool, the Project Participant chooses option (a), weighted average CM.
The combined margin emissions factor is calculated as follows:
, , , , , ,
grid CM y grid OM y OM grid BM y BM
EF = EF ⋅w +EF ⋅w
(7) Where:
EFgrid,CM,y Combined Margin emission factor (tCO2/MWh)
EFgrid,BM,y Build margin emission factor (tCO2/MWh) wOM Weight of the operating margin emission factor wBM Weight of the build margin emission factor
As stated in the “Tool to calculate the emission factor for an electricity system” (version 02.2.0), the default weights for the operating margin and build margin emission factors for wind power generation is defined as:
wOM=0.75 wBM=0.25
for the first crediting period and for subsequent crediting periods.
Changes required for the methodology implementation in 2nd and 3rd crediting periods
At the start of the second and third crediting period the Project Proponents will address two issues as required by the applicable methodology:
• Assess the continued validity of the baseline; and
• Update the baseline as defined above
B.6.2. Data and parameters that are available at validation: Data/ Parameter: ID.1 / EGgross
Data unit: MWh
Description: Gross electricity production by fossil fuel power sources (2007-2009) Source of data used: TEIAS (Turkish Electricity Transmission Company)
The distribution of gross electricity generation by primary energy resources and the electricity utilities in Turkey (2007, 2008, 2009).
http://www.teias.gov.tr/ist2007/40.xls http://www.teias.gov.tr/istatistik2008/41.xls http://www.teias.gov.tr/istatistik2009/37(06-09).xls Value applied: See calculations of emission factor (B.6.1)
Justification of the choice of data or description of measurement methods and procedures actually applied:
According to “Turkish Statistics Law and Official Statistics Program”41 TEIAS, the Turkish Electricity Transmission Company is the official source for the related data, hence providing the most up-to-date and accurate information available.
Any comment: The average correction factor between gross/net generation is 95.8%. Its determination is presented in the Ex-ante calculation sheets.
Data/ Parameter: ID.2 / FCi,y
Data unit: m3 / tonnes (m3 for gaseous fuels)
Description: Amount of fossil fuel type i consumed in the project electricity system by
generation sources in year y (2007-2009)
Source of data used: TEIAS (Turkish Electricity Transmission Company)
Fuels consumed in thermal power plants in Turkey by the electricity utilities (2007-2009)
Value applied: See calculations of emission factor (B.6.1) Justification of the choice of data or description of measurement methods and procedures actually applied:
According to “Turkish Statistics Law and Official Statistics Program” TEIAS, the Turkish Electricity Transmission Company is the official source for the related data, hence providing the most up-to-date and accurate information available.
Any comment: -
Data/ Parameter: ID.3 / NCVi,y
Data unit: GJ/tonnes (m3 for gaseous fuels)
Description: Net calorific value (energy content) of fossil fuel type i in year y
Source of data used: TEIAS (Turkish Electricity Transmission Company)
Heating values of fuels consumed in thermal plants in Turkey by the electricity utilities (2007- 2009)
http://www.teias.gov.tr/istatistik2009/46.xls Value applied: See calculations of emission factor (B.6.1) Justification of the choice of data or description of measurement methods and procedures actually applied:
According to “Turkish Statistics Law and Official Statistics Program” TEIAS, Turkish Electricity Transmission Company is the official source for the related data, hence providing the most up-to-date and accurate information available
Any comment: -
Data/ Parameter: ID.4 /EFC02,i,y
Data unit: tCO2/GJ
Description: CO2 emission factor of fossil fuel type i” used in power unit min year y Source of data used: IPCC default values at the lower limit of the uncertainty at a 95% confidence
interval as provided in table 1.4 of Chapter 1 of Volume 2 (Energy) of the 2006 IPCC Guidelines for National Greenhouse Gas Inventory
http://www.ipcc-nggip.iges.or.jp/public/2006gl/index.htm Value applied: See calculations of emission factor (B.6.1)
Justification of the choice of data or description of measurement methods and procedures actually applied:
There is no information on the fuel specific default emission factor in Turkey, hence, IPCC values has been used as referred in the “Tool to calculate the emission factor for an electricity system (version 2)”.
Data/ Parameter: ID.5 / EGm,y
Data unit: MWh
Description: Net electricity generated by power plant/unit m Source of data used: TEIAS (Turkish Electricity Transmission Company)
Generation units put into operation in 2006; 2007; 2008 http://www.teias.gov.tr/ist2006/8.xls, for 2006
http://www.teias.gov.tr/ist2007/8.xls, for 2007 http://www.teias.gov.tr/istatistik2008/8.xls, for 2008 Value applied: Annex 3
Justification of the choice of data or description of measurement methods and procedures actually applied:
Once for each crediting period using the most recent three historical years for which the data is available at the time of submission of the PDD to the DOE for validation.
Any comment: -
Data/ Parameter: ID.6 /
η
m,yData unit: %
Description: Average net energy conversion efficiency of power unit m in year y
Source of data used: “Environmental Map” published by Environmental Inventory Head Department under Ministry of Environment and Forestry /
http://www.cedgm.gov.tr/CED/Files/cevreatlas%C4%B1/atlas_metni.pdf (p.197 table X.3.1; Thermal Plants and Environment)
Value applied: See calculations of emission factor (B.6.1) Justification of the choice of data or description of measurement methods and procedures actually applied:
The average values of thermal plants in Turkey are taken from the report “Environmental Map” published by the Ministry of Environment and Forestry.
Any comment: -
B.6.3. Ex-ante calculation of emission reductions: >>
Estimation of emission reductions prior to validation
According to “Consolidated baseline methodology for grid connected electricity generation from renewable sources” version 12.1.0, project participants should prepare an estimate of likely emission reductions for the proposed crediting period. This estimate is based on the same methodology as described under section B.6.1.
Calculating the operating margin emission factor: