Conference Paper · May 2018 CITATIONS 0 READS 154 4 authors:
Some of the authors of this publication are also working on these related projects:
Does Energy Prices Affect the Investor Sentiment?: Short- and Long-Term Analysis in Equity Market of Istanbul Sock ExchangeView project
Fund performancesView project Sedeaq Nassar
Islamic University of Gaza
8PUBLICATIONS 9CITATIONS SEE PROFILE Mahmoud Ashour Marmara University 3PUBLICATIONS 0CITATIONS SEE PROFILE Ömer Faruk Tan
Marmara University 15PUBLICATIONS 11CITATIONS SEE PROFILE Sezer Kulah Marmara University 1PUBLICATION 0CITATIONS SEE PROFILE
All content following this page was uploaded by Ömer Faruk Tan on 12 September 2018.
THE EFFECT OF OWNERSHIP STRUCTURE ON INTELLECTUAL CAPITAL EFFICIENCY: EVIDENCE
FROM BORSA ISTANBUL
Sedeaq Nassar1, Mahmoud Ashour 2, Ömer Faruk Tan 3, Sezer Külah4 ABSTRACT
This study examined the effect of ownership structure on intellectual capital efficiency of listed firms on Borsa Istanbul. Data covering the 2005 – 2015 period is gathered from the FINNET database and companies’ financial statements to compute VAIC, and from the ISO500 website to obtain the ownership structures of the companies. The ownership structure is divided into five different categories; government, family, institutional, individual, and foreign, while the efficiency of intellectual capital is measured using Pulic’s model Value Added Intellectual Coefficient (VAIC). This measure is composed of three main components, Human Capital Efficiency (HCE), Structural Capital Efficiency (SCE), and Capital Employed Efficiency (CEE). In general, we find that family and foreign ownership structures have a significant negative impact on intellectual capital efficiency, while government, institutional, and individual ownership structures have a negative impact on intellectual capital efficiency. It seems that in this setting, all ownership structures have a negative impact on intellectual capital.
Keywords: Intellectual Capital, Value Added Intellecutal Coefficient, Ownership Structure, Borsa Istanbul JEL Codes: F65, G32, L60
1.Introduction
The shift to knowledge-based economies has been under a focus of attention for the past two decades. This type of economy is based on the production, distribution, and use of knowledge through the utilization of technology (OECD, 1996). The increased focus on knowledge and its role in economic growth, as well as in value creation, has heightened the discussion of the vital role Intellectual Capital plays in this setting, as opposed to focusing on Physical Capital. Intellectual Capital could be defined as the total of intangible assets; such as knowledge, employee skills, and experience, that allows an organization to efficiently use their physical capital to create value. According to Pulic (2000), Intellectual Capital can be segregated into three components; Human Capital, Structural Capital, and Capital Employed.
Human Capital is considered the most important component of Intellectual Capital, as it is considered to be the foundation of innovation, competitiveness, and value creation. It is considered to include all employees qualifications that an organization would lose if these employees opt to leave (Cheng et al., 2010, Kim, Yoo, and Lee, 2011, Lock Lee and Guthrie, 2010, Roos and Roos, 1997). Structural Capital, on the other hand, is the part of intellectual assets that is not lost in case employees opted to leave the organization (Sydler, Haefliger and Pruksa, 2014). It is comprised of information technology, databases, and organizational structures that help the conversion of Human into Structural Capital (Bontis, 1998). The last component of Intellectual Capital is the tangible or physical part of capital, which is comprised of both physical and financial assets (Basso, Kimura, and Aguiar, 2009).
This paper investigates the effect of ownership structure, one of the corporate governance components, on Intellectual Capital. According to the agency theory, conflict of interests appears when ownership and management are segregated. These conflicts often have a negative impact on firms’ performances. As discussed earlier, Intellectual Capital is considered to be an important driver of value. From this standpoint, we are investigating the effect of different ownership structures on Intellectual Capital performance and its ability to create value. We are investigating the Turkish listed firms on Borsa Istanbul, which provide us with a unique setting, as most of the listed firms on Borsa Istanbul are family owned. The paper is organized as follows; Part 2 discusses the literature examining the relation between Intellectual Capital and ownership structure, Part
1 PhD, Islamic University of Gaza, Faculty of Commerce, Deparment of Business Administration, Rimal St., P.O. Box 108, Gaza City, Palestine, [email protected]
2 PhD Candidate, Marmara University, Institute of Social Sciences, Department of Accounting and Finance (English), Göztepe Campus, 34722, Istanbul, Turkey, [email protected]
3 Research Assistant, Marmara University, Faculty of Business Administration, Deparment of Accounting and Finance, Göztepe Campus, 34722, Istanbul, Turkey, [email protected]
4 Research Assistant, Marmara University, Faculty of Business Administration, Deparment of Accounting and Finance (English), Göztepe Campus, 34722, Istanbul, Turkey, [email protected]
3 states the data used in our examination and the methodology utilized, Part 4 presents the results of the study, and finally Part 5 presents the conclusion of this paper.
2. Literature Review
The agency theory implies that ownership concentration would increase the value of the firm as it resolves to some extent the conflict of interests due to the segregation of ownership and management. Our main focus is to examine whether different ownership groups affect intellectual capital performance differently. Mohd-Saleh, Rahman, and Ridhuan (2009) find that family owned firms listed on the Malaysian market have a negative impact on intellectual capital performance. They suggest that this relation is consistent with the entrenchment theory, which suggests that when a party owns a significant controlling part of the firm they tend to value their benefits over the benefits of the minority shareholders. The case of Turkey is similar to that of Malaysia, where most firms listed on the market are family owned. Therefore, we also expect to have a negative relation between family ownership and intellectual capital performance.
H1: There is a negative relation between family ownership and intellectual capital performance.
There has been a significant amount of evidence that suggests government owned firms tend to be run less efficiently (Goldeng, Grünfeld, and Benito, 2008) and hence would not emphasize on maximizing the value of the firm, as they consider political agendas in their decisions. Shahveisi, Khairollahi, and Alipour (2017) report a negative relation between state-owned firms and intellectual capital performance for firms listed on the Iranian stock exchange, as the prior research suggests. Accordingly, we expect a negative relation between government owned firms and intellectual capital performance. H2: There is a negative relation between government ownership and intellectual capital performance.
On the other hand, rationality suggests that institutional ownership exerting control over other firms tend to influence the decisions of their subsidiaries. Their main objective is to maximize their wealth, and hence, exerting control over subsidiaries to do the same. On the contrary, individual ownership of firms gives way to agency costs, which would decrease the value of the firm. This suggests that there would be a positive relation between institutional ownership and intellectual capital performance, but a negative one with individual ownership. Shahveisi, Khairollahi and Alipour (2017) did not find a relation between individual ownership and intellectual capital performance, but find a positive relation with institutional ownership. H3: There is a positive relation between institutional ownership and intellectual capital performance.
H4: There is a negative relation between individual ownership and intellectual capital performance.
With the same rationale as with institutional investors, we expect that foreign investors influence control over firms to increase their value, and in turn, increase their stake’s value of the firms. Therefore, we expect a positive relation between foreign ownership and intellectual capital performance.
H5: There is a positive relation between foreign ownership and intellectual capital performance.
3. Methodology and Data
To perform our analysis to examine the relation between ownership structure and intellectual capital performance, financial data for the firms listed on Borsa Istanbul between 2005 and 2015 was obtained from the FINNET database, while data pertaining to their ownership structure was obtained from their financial statements and the ISO500 companies’ website. Firms with missing data were excluded from the sample. The final sample contained 968 observations.
Intellectual capital performance is measured using Pulic’s Value Added Intellectual Coefficient (VAIC) model. According to this model, the VAIC is the sum of intellectual capital efficiency (ICE) and capital employed efficiency (CEE). ICE is the sum of human capital efficiency (HCE) and structural capital efficiency (SCE), which can be presented as follows;
VAIC = HCE + SCE + CEE
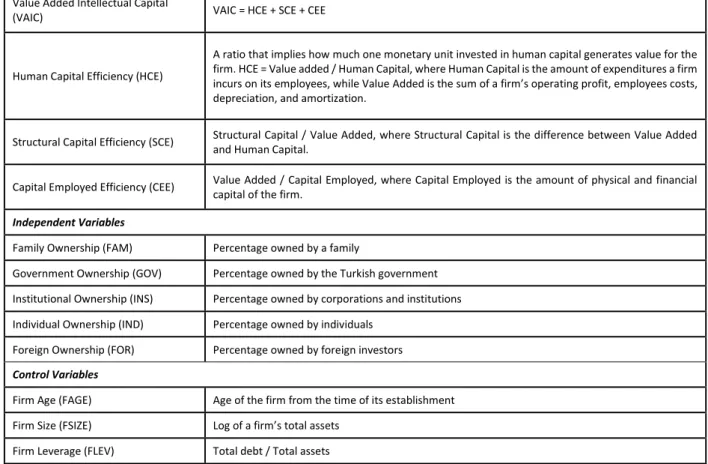
The dependent variables of the study are the three components of the VAIC model, in addition to the comprehensive VAIC measure itself. The independent variables are the ownership structure categories, in addition to some control variables. A detailed list of the variables of the study is presented in the following table.
Table 1: Summary of Variables Dependent Variables
Value Added Intellectual Capital
(VAIC) VAIC = HCE + SCE + CEE
Human Capital Efficiency (HCE)
A ratio that implies how much one monetary unit invested in human capital generates value for the firm. HCE = Value added / Human Capital, where Human Capital is the amount of expenditures a firm incurs on its employees, while Value Added is the sum of a firm’s operating profit, employees costs, depreciation, and amortization.
Structural Capital Efficiency (SCE) Structural Capital / Value Added, where Structural Capital is the difference between Value Added and Human Capital.
Capital Employed Efficiency (CEE) Value Added / Capital Employed, where Capital Employed is the amount of physical and financial capital of the firm.
Independent Variables
Family Ownership (FAM) Percentage owned by a family
Government Ownership (GOV) Percentage owned by the Turkish government Institutional Ownership (INS) Percentage owned by corporations and institutions Individual Ownership (IND) Percentage owned by individuals
Foreign Ownership (FOR) Percentage owned by foreign investors Control Variables
Firm Age (FAGE) Age of the firm from the time of its establishment Firm Size (FSIZE) Log of a firm’s total assets
Firm Leverage (FLEV) Total debt / Total assets
The analysis is performed using a panel-data analysis through the utilization of the following models:
𝑽𝑨𝑰𝑪 = 𝜶 + 𝜷𝟏𝑭𝑨𝑴 + 𝜷𝟐𝑮𝑶𝑽 + 𝜷𝟑𝑰𝑵𝑺 + 𝜷𝟒𝑰𝑵𝑫 + 𝜷𝟓𝑭𝑶𝑹 + 𝜷𝟔𝑭𝑨𝑮𝑬 + 𝜷𝟕𝑭𝑺𝑰𝒁𝑬 + 𝜷𝟖𝑭𝑳𝑬𝑽 + 𝜺 𝑯𝑪𝑬 = 𝜶 + 𝜷𝟏𝑭𝑨𝑴 + 𝜷𝟐𝑮𝑶𝑽 + 𝜷𝟑𝑰𝑵𝑺 + 𝜷𝟒𝑰𝑵𝑫 + 𝜷𝟓𝑭𝑶𝑹 + 𝜷𝟔𝑭𝑨𝑮𝑬 + 𝜷𝟕𝑭𝑺𝑰𝒁𝑬 + 𝜷𝟖𝑭𝑳𝑬𝑽 + 𝜺 𝑺𝑪𝑬 = 𝜶 + 𝜷𝟏𝑭𝑨𝑴 + 𝜷𝟐𝑮𝑶𝑽 + 𝜷𝟑𝑰𝑵𝑺 + 𝜷𝟒𝑰𝑵𝑫 + 𝜷𝟓𝑭𝑶𝑹 + 𝜷𝟔𝑭𝑨𝑮𝑬 + 𝜷𝟕𝑭𝑺𝑰𝒁𝑬 + 𝜷𝟖𝑭𝑳𝑬𝑽 + 𝜺 𝑪𝑬𝑬 = 𝜶 + 𝜷𝟏𝑭𝑨𝑴 + 𝜷𝟐𝑮𝑶𝑽 + 𝜷𝟑𝑰𝑵𝑺 + 𝜷𝟒𝑰𝑵𝑫 + 𝜷𝟓𝑭𝑶𝑹 + 𝜷𝟔𝑭𝑨𝑮𝑬 + 𝜷𝟕𝑭𝑺𝑰𝒁𝑬 + 𝜷𝟖𝑭𝑳𝑬𝑽 + 𝜺 4. Findings and Discussion
Table 2 shows the descriptive statistics of the variables used in this study. Human capital efficiency (HCE) shows the highest mean value of 6.68 among the three components of VAIC. This indicates that HCE is the most influential factor in value creation for our study sample for the selected period. The average mean value of VAIC, which includes the three components; HCE, SCE, and CEE, is 7.76.
Table 2: Descriptive statistics
Dependent Variables Independent Variables Control variables
HCE SCE CEE VAIC GOV FAM INS IND FOR FAGE FSIZE FLEV
N 968 968 968 968 968 968 968 968 968 968 968 968
Mean 6.68 0.80 0.27 7.76 1.59 44.49 11.80 29.93 9.07 38.26 19.65 0.43 SD 4.34 0.31 0.29 4.47 10.36 30.43 24.07 19.02 20.10 11.86 1.52 0.17 HCE is human capital efficiency, SCE is structural capital efficiency, CEE is capital employed efficiency, VAIC is value added intellectual coefficient, GOV is Government ownership, FAM is family ownership, INS is institutional ownership, IND is individual ownership, FOR is foreign ownership, FAGE is firm age, FSIZE is firm size, FLEV is firm leverage.
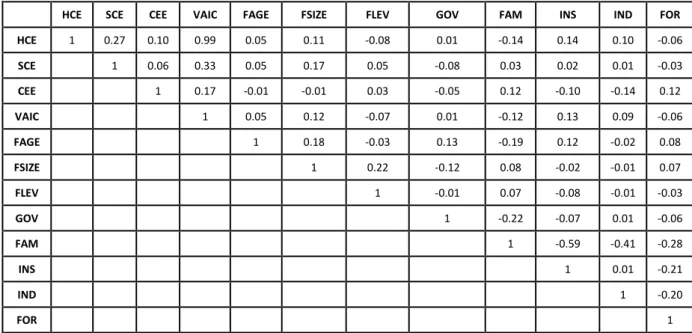
The results of the descriptive tests show that the mean of family ownership for the 10 year period for firms listed on Borsa Istanbul is 44.49%, the highest of all ownership structures, which indicates that it is the dominant structure in Borsa Istanbul. The second dominant structure is the individual structure, followed by the institutional structure. Table 3 presents the correlation between the components within the VAIC measure and parametric correlations between variables used in the regression. While human capital and structural capital efficiencies are 27% correlated, as reported by the Pearson correlation coefficient, neither is correlated with the capital employed efficiency. The results also show that there is a strong correlation between human capital efficiency and value added intellectual coefficient with a value of 0.99. As expected, the table shows positive correlations among human capital, structural capital, capital employed efficiencies and the value added intellectual coefficient.
The results also suggest that there is a weak level of correlation between the VAIC used as the dependent variable and institutional ownership, one of the independent variables (Pearson coefficient = 0.13). The table also shows that there is a negative correlation between VAIC and firms leverage and foreign ownership. This indicates that foreign ownership does not have a positive influence on intellectual capital. These positive and negative effects of ownership structures should be analyzed simultaneously in order to examine the effect on intellectual capital performance. Overall, we find that the highest correlation between independent variables does not exceed 25%. This result suggests that the possibility of multicollinearity in a regression using these variables as the independent variables is very small.
Table 3: Correlation Statistics
HCE SCE CEE VAIC FAGE FSIZE FLEV GOV FAM INS IND FOR
HCE 1 0.27 0.10 0.99 0.05 0.11 -0.08 0.01 -0.14 0.14 0.10 -0.06 SCE 1 0.06 0.33 0.05 0.17 0.05 -0.08 0.03 0.02 0.01 -0.03 CEE 1 0.17 -0.01 -0.01 0.03 -0.05 0.12 -0.10 -0.14 0.12 VAIC 1 0.05 0.12 -0.07 0.01 -0.12 0.13 0.09 -0.06 FAGE 1 0.18 -0.03 0.13 -0.19 0.12 -0.02 0.08 FSIZE 1 0.22 -0.12 0.08 -0.02 -0.01 0.07 FLEV 1 -0.01 0.07 -0.08 -0.01 -0.03 GOV 1 -0.22 -0.07 0.01 -0.06 FAM 1 -0.59 -0.41 -0.28 INS 1 0.01 -0.21 IND 1 -0.20 FOR 1
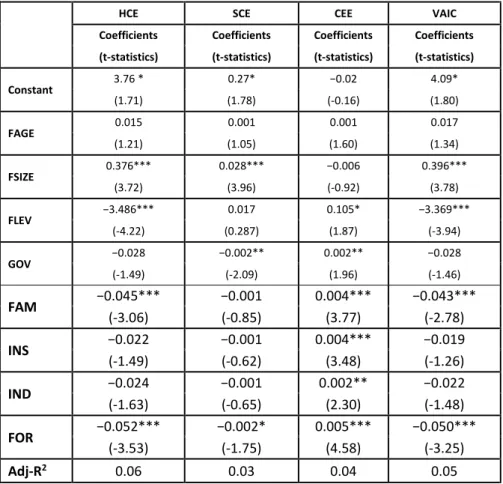
We run the four regression models using VAIC and its components, HCE, SCE, and CEE, as dependent variables to investigate the influence of various ownership structures on intellectual capital performance. The results of these models are shown in Table 4. The results show that family ownership have a significant negative effect on VAIC and HCE. This indicates that firms with high degree of family ownership are associated with low intellectual capital performance, which implies that family owned firms pursue opportunistic behaviors to pursue their private objectives at the expense of minority shareholders. Subsequently, these companies would be less efficient users of their knowledge assets, resulting in lower intellectual capital performance, relative to companies with lower degrees of family ownership, confirming our hypothesis H1. Moreover, the results indicate that there is a significant negative impact of foreign investment on VAIC, HCE, and SCE, contrary to what we expected in our hypothesis H5.
Regarding government ownership and its effect on intellectual capital performance, the results indicate that there is a significant negative relation between SCE and government ownership and an insignificant negative relation between HCE and VAIC. Although the results show a positive significant relation with CEE, we conclude that that there is a negative relation between government ownership and intellectual capital performance, in accordance to our hypothesis H2. Furthermore, the results show a negative relation between HCE, SCE, and VAIC and individual ownership. Again, although the results show a significant positive relation between CEE and individual ownership, we conclude that that there is a negative relation between individual ownership and intellectual capital performance, in accordance to our hypothesis H4.
According to our hypothesis H3, we expected a positive influence of institutional ownership on intellectual capital performance. Contrary to our expectations, we found a negative effect as implied by the negative relation between HCE, SCE, and VAIC. The results also show a significant positive effect of firm size on intellectual capital performance, and a significant negative effect of firm leverage on intellectual capital.
Table 4: Regression Analysis
HCE SCE CEE VAIC
Coefficients Coefficients Coefficients Coefficients
(t-statistics) (t-statistics) (t-statistics) (t-statistics)
Constant 3.76 * 0.27* −0.02 4.09* (1.71) (1.78) (-0.16) (1.80) FAGE 0.015 0.001 0.001 0.017 (1.21) (1.05) (1.60) (1.34) FSIZE 0.376*** 0.028*** −0.006 0.396*** (3.72) (3.96) (-0.92) (3.78) FLEV −3.486*** 0.017 0.105* −3.369*** (-4.22) (0.287) (1.87) (-3.94) GOV −0.028 −0.002** 0.002** −0.028 (-1.49) (-2.09) (1.96) (-1.46) FAM −0.045*** −0.001 0.004*** −0.043*** (-3.06) (-0.85) (3.77) (-2.78) INS −0.022 −0.001 0.004*** −0.019 (-1.49) (-0.62) (3.48) (-1.26) IND −0.024 −0.001 0.002** −0.022 (-1.63) (-0.65) (2.30) (-1.48) FOR −0.052*** −0.002* 0.005*** −0.050*** (-3.53) (-1.75) (4.58) (-3.25) Adj-R2 0.06 0.03 0.04 0.05
Hints: coefficients of regression reported as standardized coefficients.
* Correlation is significant at the 0.01 level, ** Correlation is significant at the 0.05 level and *** Correlation is significant at the 0.10 level. VIF value for all control and independents variables are less than 3, means there is no multicollinearity.
5. Conclusion
The study examined the effect of ownership structure on intellectual capital efficiency of listed firms on Borsa Istanbul. Data covering the 2005 – 2015 period is gathered from the FINNET database and companies’ financial statements to compute VAIC, and from the ISO500 website to obtain the ownership structures of the companies. The ownership structure is divided into five different categories; government, family, institutional, individual, and foreign, while the efficiency of intellectual capital is measured using Pulic’s model Value Added Intellectual Coefficient (VAIC). This measure is composed of three main components, Human Capital Efficiency (HCE), Structural Capital Efficiency (SCE), and Capital Employed Efficiency (CEE). In general, we find that family and foreign ownership structures have a significant negative impact on intellectual capital efficiency, while government, institutional, and individual ownership structures have a negative impact on intellectual capital efficiency. It seems that in this setting, all ownership structures have a negative impact on intellectual capital.
References
Basso, L., Herbert, K., Aguiar, J. (2009). Intellectual capital and value creation ın the production and assembly of vehicles and auto-parts sector ın Brazil. SSRN Electronic Journal. http://ssrn.com/abstract=1505522
Bontis, N., (1998). Intellectual capital: An exploratory study that develops measures and models. Management Decision, vol. 36, no. 2, p. 63–76.
Cheng, M., Lin, J., Hsiao T., Lin, T., (2010). Invested resource, competitive ıntellectual capital, and corporate performance, Journal of Intellectual Capital, vol. 11, no. 4, p. 33–50. https://doi.org/10.1108/14691931011085623.
Goldeng, E., Grünfeld, L., Benito, G., (2008). The performance differential between private and state owned enterprises: The roles of ownership, management and market structure. Journal of Management Studies, Vol.45,No.7,p.1244–73. https://doi.org/10.1111/j.1467-6486.2008.00790.x
ISO500. (2017). Türkiye'nin 500 büyük sanayi kuruluşu. http://www.iso500.org.tr/
Kim, T., Yoo, J., Lee, G. (2011). The HOINCAP scale: Measuring ıntellectual capital in the hotel ındustry. Service Industries Journal, 31 (13):2243–72. https://doi.org/10.1080/02642069.2010.504817.
Lock Lee, Laurence, and James Guthrie. 2010. “Visualising and Measuring Intellectual Capital in Capital Markets: A Research Method, Journal of Intellectual Capital, vol. 11, no. 1, p. 4–22. https://doi.org/10.1108/14691931011013307.
Mohd-Saleh, N., Rahman, C., Ridhuan, M. (2009). Ownership structure and intellectual capital performance in Malaysia. Asian Academy of Management Journal of Accounting and Finance, vol. 5, no. 1, p. 1–29.
OECD. (1996). The Knowledge-Based Economy. Ocde/Gd. https://www.oecd.org/sti/sci-tech/1913021.pdf.
Pulic, A., (2000). VAIC TM – an accounting tool for IC management. International Journal of Technology Management, vol. 20, p. 702–714.
Roos, G., Roos, J. (1997). Measuring your company’s İntellectual performance. Long range planning, vol. 30, no.3, p.413–426. https://doi.org/10.1016/S0024-6301(97)90260-0.
Shahveisi, F., Khairollahi, F., Alipour, M. (2017). does ownership structure matter for corporate intellectual capital performance? An empirical test in the Iranian context, Eurasian Business Review, vol. 7, no. 1, p. 67–91.
Sydler, R., Haefliger, S., Pruska, R. (2014). Measuring intellectual capital with financial figures: Can we predict firm profitability? European Management Journal, vol. 32, no. 2, p. 244–59. https://doi.org/10.1016/j.emj.2013.01.008.
View publication stats View publication stats