Effects of Low-Carbohydrate and Low-Fat Diets
A Randomized Trial
Lydia A. Bazzano, MD, PhD, MPH*; Tian Hu, MD, MS*; Kristi Reynolds, PhD; Lu Yao, MD, MS; Calynn Bunol, MS, RD, LDN; Yanxi Liu, MS; Chung-Shiuan Chen, MS; Michael J. Klag, MD, MPH; Paul K. Whelton, MD, MSc, MB; and Jiang He, MD, PhD
Background: Low-carbohydrate diets are popular for weight loss, but their cardiovascular effects have not been well-studied, partic-ularly in diverse populations.
Objective:To examine the effects of a low-carbohydrate diet com-pared with a low-fat diet on body weight and cardiovascular risk factors.
Design: A randomized, parallel-group trial. (ClinicalTrials.gov: NCT00609271)
Setting:A large academic medical center.
Participants:148 men and women without clinical cardiovascular disease and diabetes.
Intervention:A low-carbohydrate (⬍40 g/d) or low-fat (⬍30% of daily energy intake from total fat [⬍7% saturated fat]) diet. Both groups received dietary counseling at regular intervals throughout the trial.
Measurements: Data on weight, cardiovascular risk factors, and dietary composition were collected at 0, 3, 6, and 12 months. Results: Sixty participants (82%) in the low-fat group and 59 (79%) in the low-carbohydrate group completed the intervention.
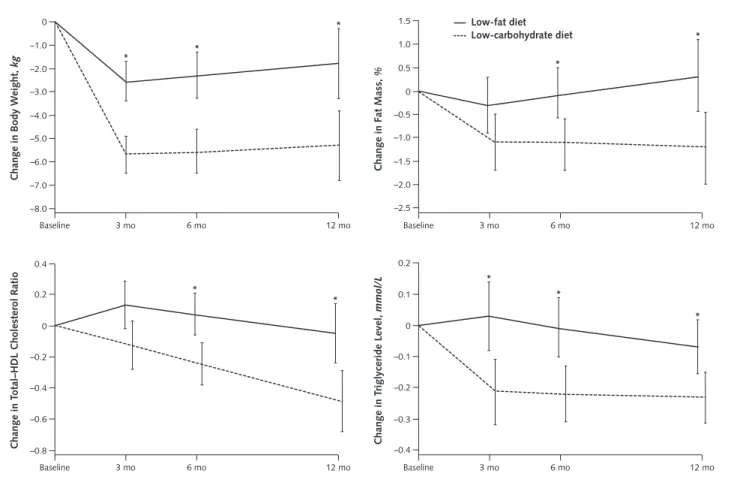
At 12 months, participants on the low-carbohydrate diet had greater decreases in weight (mean difference in change,⫺3.5 kg [95% CI,⫺5.6 to⫺1.4 kg];P⫽0.002), fat mass (mean difference in change, ⫺1.5% [CI,⫺2.6% to⫺0.4%]; P⫽0.011), ratio of total– high-density lipoprotein (HDL) cholesterol (mean difference in change,⫺0.44 [CI,⫺0.71 to⫺0.16];P⫽0.002), and triglyceride level (mean difference in change, ⫺0.16 mmol/L [⫺14.1 mg/dL] [CI,⫺0.31 to⫺0.01 mmol/L {⫺27.4 to⫺0.8 mg/dL}];P⫽0.038) and greater increases in HDL cholesterol level (mean difference in change, 0.18 mmol/L [7.0 mg/dL] [CI, 0.08 to 0.28 mmol/L {3.0 to 11.0 mg/dL}];P⬍0.001) than those on the low-fat diet. Limitation:Lack of clinical cardiovascular disease end points. Conclusion: The low-carbohydrate diet was more effective for weight loss and cardiovascular risk factor reduction than the low-fat diet. Restricting carbohydrate may be an option for persons seeking to lose weight and reduce cardiovascular risk factors.
Primary Funding Source:National Institutes of Health.
Ann Intern Med.2014;161:309-318. doi:10.7326/M14-0180 www.annals.org For author affiliations, see end of text.
* Drs. Bazzano and Hu contributed equally to this work.
A
ccording to the latest estimates, more than one third of American adults have at least 1 form of cardiovas-cular disease (CVD) and one third of total deaths are due to CVD (1). The annual cost of caring for Americans with CVD was an estimated $312.9 billion in 2009 and is pro-jected to increase to approximately $1.48 trillion by 2030 (1). Thus, CVD is one of the most important public health challenges in the United States.Low-carbohydrate diets have become a popular strat-egy for weight loss and weight management in recent years; however, their cardiovascular effects are unknown. Pro-spective cohort studies have produced conflicting results regarding the association between low-carbohydrate dietary patterns and risk for CVD (2, 3). Few randomized, con-trolled trials thus far have examined the effects of carbohy-drate restriction on CVD risk factors in a diverse popula-tion with a significant proporpopula-tion of black persons. The few that have either did not assess a typical low-carbohydrate diet or included severely obese participants, most of whom had type 2 diabetes or the metabolic syn-drome (4 – 6). Hence, we conducted a randomized, parallel-group trial to examine the effects of a 12-month low-carbohydrate diet compared with a low-fat diet (7–9) on body weight and CVD risk factors in a diverse popula-tion with a substantial proporpopula-tion of black persons with no clinical comorbid conditions.
M
ETHODSSetting and Participants
Men and women aged 22 to 75 years with a body mass index of 30 to 45 kg/m2 were recruited from the general
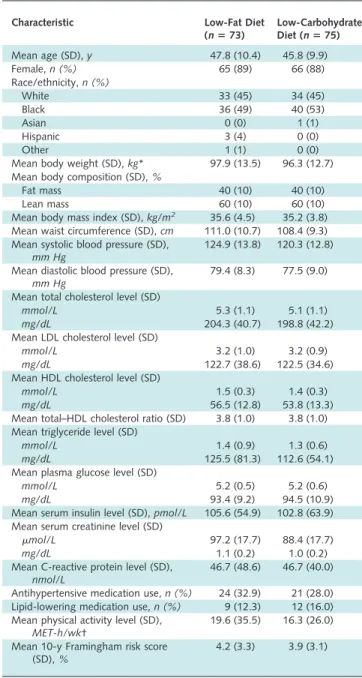
public by using mailing lists, fliers, work site and commu-nity screenings, and television advertisements. Major exclu-sion criteria were self-reported clinical CVD, type 2 diabe-tes, or kidney disease; use of prescription weight-loss medications; surgery; and weight loss greater than 6.8 kg within 6 months of study entry. A total of 148 participants (mean age, 46.8 years; 88% female; 51% black) were in-cluded (Table 1). We recruited, enrolled, and followed participants and collected data and specimens from 2008 through 2011 at the Tulane University Health Sciences Center in New Orleans, Louisiana. The study was ap-proved by the Institutional Review Board at Tulane Uni-versity, and each participant signed an approved consent form.
Study Design and Intervention
We used a computer-generated, blocked randomiza-tion, stratified by sex, to allocate participants to 1 of the 2
See also:
diet groups. After randomization, 73 participants were as-signed to the low-fat diet group and 75 were asas-signed to the low-carbohydrate diet group. Participants assigned to the low-carbohydrate diet were instructed to maintain an intake of digestible carbohydrate (total carbohydrate minus total fiber) of less than 40 g/d. Those assigned to the low-fat diet were instructed to maintain less than 30% of their daily energy intake from total fat (with ⬍7% from satu-rated fat) and 55% from carbohydrate, based on National Cholesterol Education Program guidelines (7–9). Neither diet included a specific calorie or energy goal. Participants in each group were asked to refrain from changing their physical activity levels during the intervention. A hand-book was given to participants that contained recipes, sam-ple menus for 1 week of food intake at various energy levels, food lists, shopping lists, meal planners, and guides on counting macronutrients and reading nutrition labels. We also provided 1 low-carbohydrate or low-fat meal re-placement (bar or shake) per day to participants in each group for the duration of the study.
Participants met with a dietitian in weekly individual counseling sessions for the first 4 weeks, followed by small group counseling sessions every other week for the next 5 months (a total of 10 sessions) and monthly for the last 6 months of the intervention. Individual sessions generally lasted about 1 hour and included dietary instruction and supportive counseling. Group counseling sessions were held separately for participants in the fat and low-carbohydrate groups but followed a common behavioral curriculum.
Staff provided a single set of instructions that were not altered over the course of the study. Participants in each diet group received the same information on dietary fiber (recommended intake of 25 g/d) and types of dietary fats. These common instructions included education on satu-rated, monounsatusatu-rated, and trans fats, with emphasis on the benefits of monounsaturated fats and recommenda-tions to limit or eliminate trans fats.
Data Collection
Two 24-hour dietary recalls were obtained from par-ticipants at baseline and 3, 6, and 12 months to character-ize and monitor individual dietary intake of macronutri-ents. One recall reflected consumption on a weekday, and the other reflected consumption on a weekend day. All dietary recalls were obtained by a trained and certified staff member. We calculated dietary nutrient intakes using the food composition tables of the Nutrition Data System for Research (10). Five percent of the dietary recalls were re-corded and reviewed for quality control purposes.
A detailed medical history that included assessment of hypertension, diabetes, CVD, medication use, and health behaviors (smoking habits, alcohol use, and physical activ-ity) was obtained at the screening visit. We collected an-thropometric measures, blood pressure, and blood and urine samples at the screening visit, randomization, and each follow-up visit. Body weight and height (without shoes) were measured to the nearest 0.1 kg and 0.1 cm, respectively, using a single calibrated scale (Detecto, model 6855) and a wall-mounted stadiometer. We measured body composition using whole-body bioelectrical imped-ance analysis (RJL Systems) while the participant was in a supine position. We measured blood pressure 3 times with a mercury sphygmomanometer using procedures recom-mended by the American Heart Association (11). The sys-tolic and diassys-tolic blood pressures were recorded as the first and fifth Korotkoff sounds, respectively. Blood samples were collected after the participant had fasted for 12 hours. We assayed serum total cholesterol, high-density lipopro-tein (HDL) cholesterol, and triglyceride levels according to procedures recommended by the National Heart, Lung, and Blood Institute and the Centers for Disease Control and Prevention (12). Low-density lipoprotein (LDL) cho-lesterol level was calculated using the Friedewald formula (13). We measured plasma glucose, serum creatinine, and high-sensitivity C-reactive protein (CRP) levels using stan-dard methods. We calculated physical activity as the sum of hours of moderate to vigorous activities per week (walk-ing, sports, dance, and conditioning) multiplied by each activity’s individual metabolic equivalent value. Urinary ketone levels were measured by dipstick at each behavioral session attended and each clinic visit for data collection. A range of adverse effects was assessed using closed-ended questions at each counseling session.
Statistical Analysis
The power assessment for the primary end point (body weight) was based on data abstracted from trials similar to this one (4, 14 –16). Assuming a 2-sided significance level of 0.05, we needed 55 participants per group to provide 80% power to detect differences in weight change of at least 3% (SD, 5%) between the groups. The sample size of 148 participants allowed for a 25% dropout rate after randomization.
Context
The relative benefits of low-carbohydrate and low-fat diets have not been well-studied in populations that included a substantial proportion of black persons.
Contribution
Participants in this 12-month study who were randomly assigned to a low-carbohydrate diet lost more weight and had greater reductions in certain markers of cardiovascular disease than those assigned to a low-fat diet. About half of the study’s participants were black.
Implication
A low-carbohydrate diet may be beneficial for weight loss and reduction of cardiovascular risk factors.
Data on baseline characteristics of study participants were expressed as means (SDs) or numbers (percentages). Eleven participants (5 in the low-fat group and 6 in the low-carbohydrate group) declined to have their body weight measured at randomization and were not included in the analysis of our primary outcome. We usedttests or chi-square tests to compare baseline characteristics between the groups. Dietary composition data were expressed as means (SDs) and compared using t tests. We used a random-effects linear model that was fitted to continuous outcomes (primary and secondary). Each random-effects model consisted of a random intercept and a random slope to adjust for the within-participant correlation among the observed longitudinal data. To examine the change in each study end point, we included an indicator variable in the model for time (3, 6, and 12 months), diet group, an interaction term for diet group by time, and baseline level of the corresponding end point. In a post hoc analysis, we also examined the estimated 10-year risk for coronary heart disease (CHD) by Framingham risk score between groups (17). To examine adverse effects (binary outcomes) over time while accounting for the repeated measurements within individuals, we used generalized estimating equa-tions under the logistic regression model.
The random-effects model allows the assumption of data missing at random (MAR). We performed sensitivity analyses to assess the robustness of our conclusions and departures from the MAR assumption. We used Markov-chain Monte Carlo techniques to impute missing values, including additional covariates (age, sex, race, marital sta-tus, education, and employment status), in the model to make the MAR assumption more plausible (18). AllP val-ues were 2-sided, and no adjustment was made for multiple comparisons. We used SAS, version 9.2 (SAS Institute), for all analyses.
Role of the Funding Source
The study was funded by the National Center for Re-search Resources of the National Institutes of Health. The funding source had no role in the design, conduct, analysis, or reporting of the study.
R
ESULTSBaseline Characteristics
Baseline characteristics of the trial participants are shown inTable 1. Demographic characteristics and cardio-vascular risk factors were similar between groups. The pro-portions of participants completing assessments at months 3, 6, and 12 were 93.2%, 87.7%, and 82.2%, respectively, in the low-fat group and 92.0%, 82.7%, and 78.7%, re-spectively, in the low-carbohydrate group (Figure 1). Dietary Intake and Physical Activity
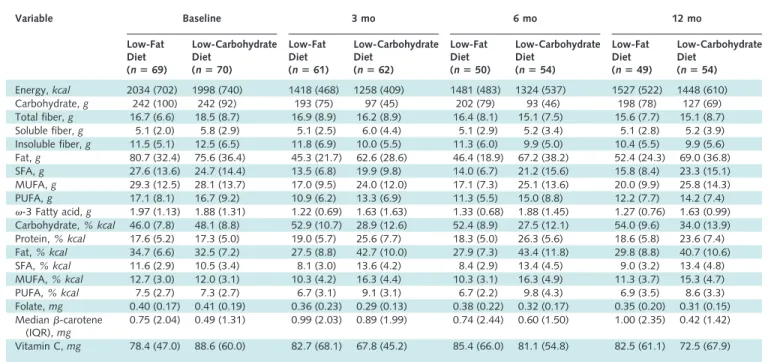
Dietary composition data for participants who re-mained on each diet and also provided 24-hour recalls are summarized inTable 2. At baseline, reported dietary com-position in the low-fat group was similar to that in the
low-carbohydrate group. During follow-up, total energy intake was similar between groups. The intake of total car-bohydrate was significantly higher and intakes of protein and total, saturated, and monounsaturated fat (as percent-ages of kilocalories) were significantly lower in the low-fat group at 12 months (P⬍ 0.001 for these comparisons). Physical activity levels were similar throughout the study. Body Weight and Composition and Waist Circumference Weight loss from baseline values was greater in the low-carbohydrate group than in the low-fat group at 3, 6,
Table 1. Baseline Characteristics of Trial Participants
Characteristic Low-Fat Diet (nⴝ73) Low-Carbohydrate Diet (nⴝ75) Mean age (SD),y 47.8 (10.4) 45.8 (9.9) Female,n (%) 65 (89) 66 (88) Race/ethnicity,n (%) White 33 (45) 34 (45) Black 36 (49) 40 (53) Asian 0 (0) 1 (1) Hispanic 3 (4) 0 (0) Other 1 (1) 0 (0)
Mean body weight (SD),kg* 97.9 (13.5) 96.3 (12.7) Mean body composition (SD),%
Fat mass 40 (10) 40 (10)
Lean mass 60 (10) 60 (10)
Mean body mass index (SD),kg/m2 35.6 (4.5) 35.2 (3.8)
Mean waist circumference (SD),cm 111.0 (10.7) 108.4 (9.3) Mean systolic blood pressure (SD),
mm Hg
124.9 (13.8) 120.3 (12.8) Mean diastolic blood pressure (SD),
mm Hg
79.4 (8.3) 77.5 (9.0) Mean total cholesterol level (SD)
mmol/L 5.3 (1.1) 5.1 (1.1)
mg/dL 204.3 (40.7) 198.8 (42.2)
Mean LDL cholesterol level (SD)
mmol/L 3.2 (1.0) 3.2 (0.9)
mg/dL 122.7 (38.6) 122.5 (34.6)
Mean HDL cholesterol level (SD)
mmol/L 1.5 (0.3) 1.4 (0.3)
mg/dL 56.5 (12.8) 53.8 (13.3)
Mean total–HDL cholesterol ratio (SD) 3.8 (1.0) 3.8 (1.0) Mean triglyceride level (SD)
mmol/L 1.4 (0.9) 1.3 (0.6)
mg/dL 125.5 (81.3) 112.6 (54.1)
Mean plasma glucose level (SD)
mmol/L 5.2 (0.5) 5.2 (0.6)
mg/dL 93.4 (9.2) 94.5 (10.9)
Mean serum insulin level (SD),pmol/L 105.6 (54.9) 102.8 (63.9) Mean serum creatinine level (SD)
mol/L 97.2 (17.7) 88.4 (17.7)
mg/dL 1.1 (0.2) 1.0 (0.2)
Mean C-reactive protein level (SD), nmol/L
46.7 (48.6) 46.7 (40.0) Antihypertensive medication use,n (%) 24 (32.9) 21 (28.0) Lipid-lowering medication use,n (%) 9 (12.3) 12 (16.0) Mean physical activity level (SD),
MET-h/wk†
19.6 (35.5) 16.3 (26.0) Mean 10-y Framingham risk score
(SD),%
4.2 (3.3) 3.9 (3.1)
HDL⫽high-density lipoprotein; LDL⫽low-density lipoprotein; MET⫽ met-abolic equivalent.
*11 participants had no data on body weight at randomization.
†Calculated as the sum of weekly hours of moderate to vigorous activities per week (walking, sports, dance, and conditioning) multiplied by the activity’s indi-vidual MET value.
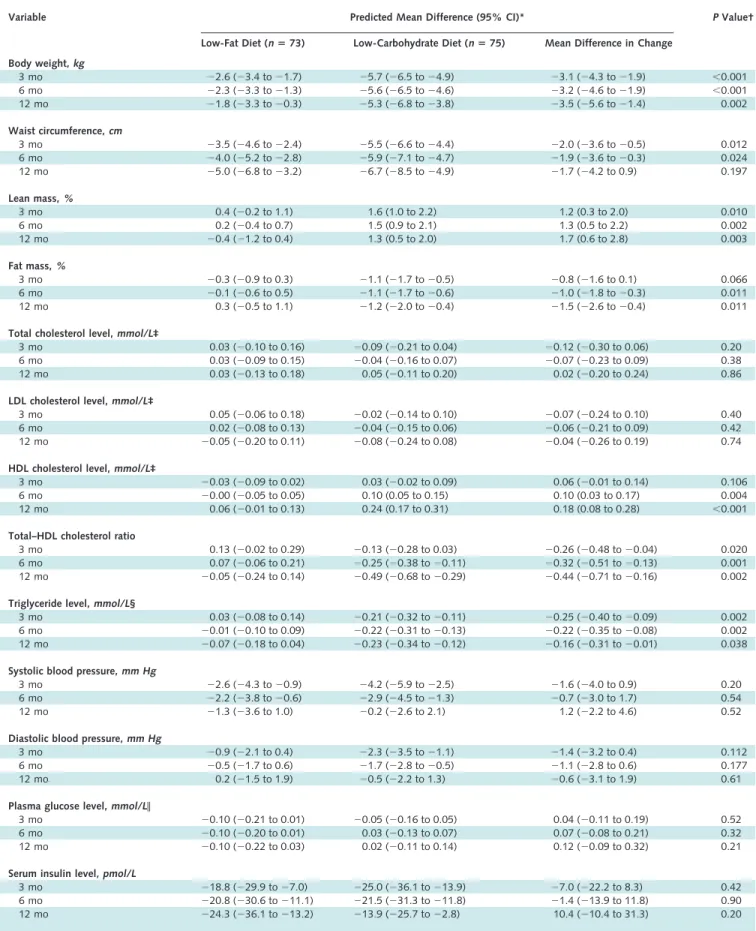
and 12 months (Table 3). The reduction in body weight was significantly greater in the low-carbohydrate group (mean difference in change at 12 months,⫺3.5 kg [95% CI, ⫺5.6 to⫺1.4 kg]; P⫽0.002). Compared with
par-ticipants on the low-fat diet, those on the low-carbohydrate diet had significantly greater proportional reductions in fat mass (mean difference in change at 12 months, ⫺1.5% [CI, ⫺2.6% to ⫺0.4%]; P⫽ 0.011) and significantly Figure 1.Study flow diagram.
Assessed at 3 mo (n = 68)
Remained on diet but not assessed (n = 0) Discontinued study (n = 5)
Time constraints: 1 Life stressors: 1 Pregnancy: 1 No reason: 2 Low-fatdiet (n = 73) Entereddata analysis (n = 73)* Completed prescreening (n = 962) Excluded by prescreening (n = 458)
Assessed for eligibility (n = 255)
Excluded (n = 107)
Did not meet eligibility criteria: 70 Lost interest: 37
Randomly assigned (n = 148) Not excluded by prescreening (n = 504)
Missed in-clinic screening visit
(n = 249)
Assessed at 6 mo (n = 64)
Remained on diet but not assessed (n = 0) Discontinued study (n = 4)
Time constraints: 2 Life stressors: 1
Dissatisfied with program: 1
Assessed at 12 mo (n = 60) Discontinued study (n = 4)
Time constraints: 3 No reason: 1
Assessed at 3 mo (n = 69)
Remained on diet but not assessed (n = 1) Discontinued study (n = 5)
Time constraints: 1 Dissatisfied with program: 1 Life stressors: 1 Pregnancy: 2 Low-carbohydrate diet (n = 75) Entereddata analysis (n = 75)* Assessed at 6 mo (n = 62) Remained on diet but not assessed (n = 0) Discontinued study (n = 7)
Time constraints: 5 Life stressors: 1 No reason: 1
Assessed at 12 mo (n = 59) Discontinued study (n = 3)
Dissatisfied with program: 1 No reason: 2
greater proportional increases in lean mass (mean differ-ence in change at 12 months, 1.7% [CI, 0.6% to 2.8%]; P⫽ 0.003). Participants in both groups significantly re-duced their waist circumference. Changes in waist circum-ference were more favorable in the low-carbohydrate group at 3 and 6 months but did not differ significantly from those in the low-fat group at 12 months (Table 3; Figure 2; and Appendix Figure, available at www .annals.org).
Serum Lipid Levels
At 12 months, serum levels of total and LDL choles-terol had not significantly changed among participants in either group. Levels of HDL cholesterol increased signifi-cantly more in the low-carbohydrate group than in the low-fat group (mean difference in change at 12 months, 0.18 mmol/L [7.0 mg/dL] [CI, 0.08 to 0.28 mmol/L {3.0 to 11.0 mg/dL}]; P⬍ 0.001). Ratios of total–HDL cho-lesterol decreased significantly only among participants in the low-carbohydrate group, and the decreases were signif-icantly greater than those in the low-fat group (mean dif-ference in change at 12 months, ⫺0.44 [CI, ⫺0.71 to
⫺0.16];P⫽0.002). Serum levels of triglycerides also de-creased significantly in both groups, with greater decreases among participants in the low-carbohydrate group (mean difference in change at 12 months,⫺0.16 mmol/L [⫺14.1 mg/dL] [CI, ⫺0.31 to ⫺0.01 mmol/L {⫺27.4 to ⫺0.8 mg/dL}]; P⫽ 0.038) (Table 3, Figure 2, and Appendix Figure).
Blood Pressure and CRP, Plasma Glucose, Insulin, and Serum Creatinine Levels
At 12 months, participants in the low-carbohydrate group had significantly greater decreases in CRP level than those in the low-fat group (mean difference in change at 12 months,⫺15.2 nmol/L [CI,⫺27.6 to⫺1.9 nmol/L];P⫽ 0.024). Systolic and diastolic blood pressures did not sig-nificantly decrease among participants in either group, and mean differences in change between the groups were also not significant at 12 months. Plasma glucose levels also did not significantly change in either group. Although serum levels of insulin and creatinine decreased significantly in each group, the decreases did not differ significantly be-tween groups (Table 3).
10-Year Framingham CHD Risk Score
Participants in the low-carbohydrate group had signif-icant decreases in estimated 10-year risk for CHD at 6 and 12 months, whereas those in the low-fat group did not (Table 3 and Appendix Figure). The reductions in esti-mated 10-year risk for CHD were significantly greater in the low-carbohydrate group at 12 months (mean difference in change,⫺1.4% [CI,⫺2.1% to⫺0.6%];P⬍ 0.001).
We examined differences among white and black par-ticipants and found that the results were consistent with those of the overall population (Appendix Tables 1and2, available at www.annals.org), except HDL cholesterol lev-els increased slightly with the low-fat diet among black
Table 2. Daily Dietary Composition in the Low-Fat and Low-Carbohydrate Diet Groups Over the Course of the Study*
Variable Baseline 3 mo 6 mo 12 mo Low-Fat Diet (nⴝ69) Low-Carbohydrate Diet (nⴝ70) Low-Fat Diet (nⴝ61) Low-Carbohydrate Diet (nⴝ62) Low-Fat Diet (nⴝ50) Low-Carbohydrate Diet (nⴝ54) Low-Fat Diet (nⴝ49) Low-Carbohydrate Diet (nⴝ54) Energy,kcal 2034 (702) 1998 (740) 1418 (468) 1258 (409) 1481 (483) 1324 (537) 1527 (522) 1448 (610) Carbohydrate,g 242 (100) 242 (92) 193 (75) 97 (45) 202 (79) 93 (46) 198 (78) 127 (69) Total fiber,g 16.7 (6.6) 18.5 (8.7) 16.9 (8.9) 16.2 (8.9) 16.4 (8.1) 15.1 (7.5) 15.6 (7.7) 15.1 (8.7) Soluble fiber,g 5.1 (2.0) 5.8 (2.9) 5.1 (2.5) 6.0 (4.4) 5.1 (2.9) 5.2 (3.4) 5.1 (2.8) 5.2 (3.9) Insoluble fiber,g 11.5 (5.1) 12.5 (6.5) 11.8 (6.9) 10.0 (5.5) 11.3 (6.0) 9.9 (5.0) 10.4 (5.5) 9.9 (5.6) Fat,g 80.7 (32.4) 75.6 (36.4) 45.3 (21.7) 62.6 (28.6) 46.4 (18.9) 67.2 (38.2) 52.4 (24.3) 69.0 (36.8) SFA,g 27.6 (13.6) 24.7 (14.4) 13.5 (6.8) 19.9 (9.8) 14.0 (6.7) 21.2 (15.6) 15.8 (8.4) 23.3 (15.1) MUFA,g 29.3 (12.5) 28.1 (13.7) 17.0 (9.5) 24.0 (12.0) 17.1 (7.3) 25.1 (13.6) 20.0 (9.9) 25.8 (14.3) PUFA,g 17.1 (8.1) 16.7 (9.2) 10.9 (6.2) 13.3 (6.9) 11.3 (5.5) 15.0 (8.8) 12.2 (7.7) 14.2 (7.4) -3 Fatty acid,g 1.97 (1.13) 1.88 (1.31) 1.22 (0.69) 1.63 (1.63) 1.33 (0.68) 1.88 (1.45) 1.27 (0.76) 1.63 (0.99) Carbohydrate,% kcal 46.0 (7.8) 48.1 (8.8) 52.9 (10.7) 28.9 (12.6) 52.4 (8.9) 27.5 (12.1) 54.0 (9.6) 34.0 (13.9) Protein,% kcal 17.6 (5.2) 17.3 (5.0) 19.0 (5.7) 25.6 (7.7) 18.3 (5.0) 26.3 (5.6) 18.6 (5.8) 23.6 (7.4) Fat,% kcal 34.7 (6.6) 32.5 (7.2) 27.5 (8.8) 42.7 (10.0) 27.9 (7.3) 43.4 (11.8) 29.8 (8.8) 40.7 (10.6) SFA,% kcal 11.6 (2.9) 10.5 (3.4) 8.1 (3.0) 13.6 (4.2) 8.4 (2.9) 13.4 (4.5) 9.0 (3.2) 13.4 (4.8) MUFA,% kcal 12.7 (3.0) 12.0 (3.1) 10.3 (4.2) 16.3 (4.4) 10.3 (3.1) 16.3 (4.9) 11.3 (3.7) 15.3 (4.7) PUFA,% kcal 7.5 (2.7) 7.3 (2.7) 6.7 (3.1) 9.1 (3.1) 6.7 (2.2) 9.8 (4.3) 6.9 (3.5) 8.6 (3.3) Folate,mg 0.40 (0.17) 0.41 (0.19) 0.36 (0.23) 0.29 (0.13) 0.38 (0.22) 0.32 (0.17) 0.35 (0.20) 0.31 (0.15) Median-carotene (IQR),mg 0.75 (2.04) 0.49 (1.31) 0.99 (2.03) 0.89 (1.99) 0.74 (2.44) 0.60 (1.50) 1.00 (2.35) 0.42 (1.42) Vitamin C,mg 78.4 (47.0) 88.6 (60.0) 82.7 (68.1) 67.8 (45.2) 85.4 (66.0) 81.1 (54.8) 82.5 (61.1) 72.5 (67.9) IQR⫽interquartile range; MUFA⫽monounsaturated fatty acid; PUFA⫽polyunsaturated fatty acid; SFA⫽saturated fatty acid.
Table 3. Predicted Mean Differences in Changes in Cardiovascular Risk Factors From Baseline, by Assigned Dietary Group
Variable Predicted Mean Difference (95% CI)* P Value† Low-Fat Diet (nⴝ73) Low-Carbohydrate Diet (nⴝ75) Mean Difference in Change
Body weight,kg 3 mo ⫺2.6 (⫺3.4 to⫺1.7) ⫺5.7 (⫺6.5 to⫺4.9) ⫺3.1 (⫺4.3 to⫺1.9) ⬍0.001 6 mo ⫺2.3 (⫺3.3 to⫺1.3) ⫺5.6 (⫺6.5 to⫺4.6) ⫺3.2 (⫺4.6 to⫺1.9) ⬍0.001 12 mo ⫺1.8 (⫺3.3 to⫺0.3) ⫺5.3 (⫺6.8 to⫺3.8) ⫺3.5 (⫺5.6 to⫺1.4) 0.002 Waist circumference,cm 3 mo ⫺3.5 (⫺4.6 to⫺2.4) ⫺5.5 (⫺6.6 to⫺4.4) ⫺2.0 (⫺3.6 to⫺0.5) 0.012 6 mo ⫺4.0 (⫺5.2 to⫺2.8) ⫺5.9 (⫺7.1 to⫺4.7) ⫺1.9 (⫺3.6 to⫺0.3) 0.024 12 mo ⫺5.0 (⫺6.8 to⫺3.2) ⫺6.7 (⫺8.5 to⫺4.9) ⫺1.7 (⫺4.2 to 0.9) 0.197 Lean mass,% 3 mo 0.4 (⫺0.2 to 1.1) 1.6 (1.0 to 2.2) 1.2 (0.3 to 2.0) 0.010 6 mo 0.2 (⫺0.4 to 0.7) 1.5 (0.9 to 2.1) 1.3 (0.5 to 2.2) 0.002 12 mo ⫺0.4 (⫺1.2 to 0.4) 1.3 (0.5 to 2.0) 1.7 (0.6 to 2.8) 0.003 Fat mass,% 3 mo ⫺0.3 (⫺0.9 to 0.3) ⫺1.1 (⫺1.7 to⫺0.5) ⫺0.8 (⫺1.6 to 0.1) 0.066 6 mo ⫺0.1 (⫺0.6 to 0.5) ⫺1.1 (⫺1.7 to⫺0.6) ⫺1.0 (⫺1.8 to⫺0.3) 0.011 12 mo 0.3 (⫺0.5 to 1.1) ⫺1.2 (⫺2.0 to⫺0.4) ⫺1.5 (⫺2.6 to⫺0.4) 0.011
Total cholesterol level,mmol/L‡
3 mo 0.03 (⫺0.10 to 0.16) ⫺0.09 (⫺0.21 to 0.04) ⫺0.12 (⫺0.30 to 0.06) 0.20
6 mo 0.03 (⫺0.09 to 0.15) ⫺0.04 (⫺0.16 to 0.07) ⫺0.07 (⫺0.23 to 0.09) 0.38
12 mo 0.03 (⫺0.13 to 0.18) 0.05 (⫺0.11 to 0.20) 0.02 (⫺0.20 to 0.24) 0.86
LDL cholesterol level,mmol/L‡
3 mo 0.05 (⫺0.06 to 0.18) ⫺0.02 (⫺0.14 to 0.10) ⫺0.07 (⫺0.24 to 0.10) 0.40
6 mo 0.02 (⫺0.08 to 0.13) ⫺0.04 (⫺0.15 to 0.06) ⫺0.06 (⫺0.21 to 0.09) 0.42
12 mo ⫺0.05 (⫺0.20 to 0.11) ⫺0.08 (⫺0.24 to 0.08) ⫺0.04 (⫺0.26 to 0.19) 0.74
HDL cholesterol level,mmol/L‡
3 mo ⫺0.03 (⫺0.09 to 0.02) 0.03 (⫺0.02 to 0.09) 0.06 (⫺0.01 to 0.14) 0.106
6 mo ⫺0.00 (⫺0.05 to 0.05) 0.10 (0.05 to 0.15) 0.10 (0.03 to 0.17) 0.004
12 mo 0.06 (⫺0.01 to 0.13) 0.24 (0.17 to 0.31) 0.18 (0.08 to 0.28) ⬍0.001
Total–HDL cholesterol ratio
3 mo 0.13 (⫺0.02 to 0.29) ⫺0.13 (⫺0.28 to 0.03) ⫺0.26 (⫺0.48 to⫺0.04) 0.020
6 mo 0.07 (⫺0.06 to 0.21) ⫺0.25 (⫺0.38 to⫺0.11) ⫺0.32 (⫺0.51 to⫺0.13) 0.001
12 mo ⫺0.05 (⫺0.24 to 0.14) ⫺0.49 (⫺0.68 to⫺0.29) ⫺0.44 (⫺0.71 to⫺0.16) 0.002
Triglyceride level,mmol/L§
3 mo 0.03 (⫺0.08 to 0.14) ⫺0.21 (⫺0.32 to⫺0.11) ⫺0.25 (⫺0.40 to⫺0.09) 0.002
6 mo ⫺0.01 (⫺0.10 to 0.09) ⫺0.22 (⫺0.31 to⫺0.13) ⫺0.22 (⫺0.35 to⫺0.08) 0.002
12 mo ⫺0.07 (⫺0.18 to 0.04) ⫺0.23 (⫺0.34 to⫺0.12) ⫺0.16 (⫺0.31 to⫺0.01) 0.038
Systolic blood pressure,mm Hg
3 mo ⫺2.6 (⫺4.3 to⫺0.9) ⫺4.2 (⫺5.9 to⫺2.5) ⫺1.6 (⫺4.0 to 0.9) 0.20
6 mo ⫺2.2 (⫺3.8 to⫺0.6) ⫺2.9 (⫺4.5 to⫺1.3) ⫺0.7 (⫺3.0 to 1.7) 0.54
12 mo ⫺1.3 (⫺3.6 to 1.0) ⫺0.2 (⫺2.6 to 2.1) 1.2 (⫺2.2 to 4.6) 0.52
Diastolic blood pressure,mm Hg
3 mo ⫺0.9 (⫺2.1 to 0.4) ⫺2.3 (⫺3.5 to⫺1.1) ⫺1.4 (⫺3.2 to 0.4) 0.112
6 mo ⫺0.5 (⫺1.7 to 0.6) ⫺1.7 (⫺2.8 to⫺0.5) ⫺1.1 (⫺2.8 to 0.6) 0.177
12 mo 0.2 (⫺1.5 to 1.9) ⫺0.5 (⫺2.2 to 1.3) ⫺0.6 (⫺3.1 to 1.9) 0.61
Plasma glucose level,mmol/L㥋
3 mo ⫺0.10 (⫺0.21 to 0.01) ⫺0.05 (⫺0.16 to 0.05) 0.04 (⫺0.11 to 0.19) 0.52
6 mo ⫺0.10 (⫺0.20 to 0.01) 0.03 (⫺0.13 to 0.07) 0.07 (⫺0.08 to 0.21) 0.32
12 mo ⫺0.10 (⫺0.22 to 0.03) 0.02 (⫺0.11 to 0.14) 0.12 (⫺0.09 to 0.32) 0.21
Serum insulin level,pmol/L
3 mo ⫺18.8 (⫺29.9 to⫺7.0) ⫺25.0 (⫺36.1 to⫺13.9) ⫺7.0 (⫺22.2 to 8.3) 0.42
6 mo ⫺20.8 (⫺30.6 to⫺11.1) ⫺21.5 (⫺31.3 to⫺11.8) ⫺1.4 (⫺13.9 to 11.8) 0.90
12 mo ⫺24.3 (⫺36.1 to⫺13.2) ⫺13.9 (⫺25.7 to⫺2.8) 10.4 (⫺10.4 to 31.3) 0.20
participants at 12 months. Small sample sizes precluded meaningful assessments of other racial and ethnic groups individually.
Sensitivity Analyses
Results of sensitivity analyses using multiple imputa-tion techniques to impute missing values were consistent with those presented in our primary analyses. Specifically, participants in the low-carbohydrate group lost signifi-cantly more weight than those in the low-fat group (mean difference in change at 12 months,⫺3.6 kg [CI,⫺5.7 to
⫺1.4 kg];P⫽0.001). Adverse Events
No serious adverse events were reported during the study. The number of participants who had symptoms, including constipation, fatigue, thirst, polyuria, diarrhea, heartburn, gas, nausea, vomiting, appetite changes, or headache, did not differ significantly between the low-carbohydrate and low-fat groups, except significantly more participants on the low-fat diet reported headaches at 3 months (18 [25%] vs. 6 [8%] participants;P⫽0.030 for between-group difference) (Appendix Table 3, available at www.annals.org).
D
ISCUSSIONOur study found that a low-carbohydrate diet induced greater weight loss and reductions in cardiovascular risk factors at 12 months than a low-fat diet among black and white obese adults who did not have diabetes, CVD, or kidney disease at baseline. Compared with a low-fat diet, a low-carbohydrate diet resulted in greater improvements in body composition, HDL cholesterol level, ratio of total– HDL cholesterol, triglyceride level, CRP level, and
esti-mated 10-year CHD risk. Because CVD is the most com-mon cause of death in the United States and obesity is a particularly prevalent risk factor, our study has important clinical and public health implications. Findings from this trial may offer new evidence for the recommendation of a low-carbohydrate diet to obese persons as an additional nonpharmacologic approach for weight loss and reduction of CVD risk factors.
Previous studies have examined the effects of low-carbohydrate diets on CVD risk factors, but most had small sample sizes or low completion rates, did not assess a typical low-carbohydrate diet for weight loss, or did not include diverse populations (19 –24). In contrast, our study tested the effects of a typical low-carbohydrate diet, had a high completion rate (approximately 80%) over 12 months of follow-up, and included a substantial sample of black persons (a group underrepresented in previous trials). Al-though 2 trials have examined cardiovascular effects in samples with a majority of black persons, they included only diabetic patients or those with severe obesity, most of whom (83%) also had type 2 diabetes or the metabolic syndrome (4, 5). The POUNDS LOST (Preventing Over-weight Using Novel Dietary Strategies) study, which exam-ined the effects of 4 diets with different macronutrient compositions, included a substantial number of black per-sons but did not test a typical low-carbohydrate diet. In POUNDS LOST, participants on the low-carbohydrate diet (which was high in protein and fat) aimed for 35% of daily energy intake from carbohydrate and achieved ap-proximately 43%. Typical low-carbohydrate diets for weight loss restrict carbohydrate to less than 20% of daily energy intake (6). Over 12 months, participants in the low-carbohydrate group in our study achieved an average Table 3—Continued
Variable Predicted Mean Difference (95% CI)* P Value† Low-Fat Diet (nⴝ73) Low-Carbohydrate Diet (nⴝ75) Mean Difference in Change
C-reactive protein level,nmol/L
3 mo 5.7 (⫺2.9 to 13.3) ⫺4.8 (⫺13.3 to 3.8) ⫺10.5 (⫺21.9 to 1.9) 0.099
6 mo 6.7 (⫺1.0 to 13.3) ⫺4.8 (⫺12.4 to 1.9) ⫺11.4 (⫺21.9 to⫺1.9) 0.019
12 mo 8.6 (⫺1.0 to 18.1) ⫺6.7 (⫺16.2 to 2.9) ⫺15.2 (⫺27.6 to⫺1.9) 0.024
Serum creatinine level,mol/L¶
3 mo 1.8 (⫺1.7 to 5.2) ⫺0.1 (⫺3.4 to 3.3) ⫺1.8 (⫺6.6 to 2.9) 0.45
6 mo ⫺1.7 (⫺4.7 to 1.3) ⫺3.1 (⫺6.1 to⫺0.2) ⫺1.5 (⫺5.7 to 2.5) 0.49
12 mo ⫺8.5 (⫺12.3 to⫺4.6) ⫺9.2 (⫺13.1 to⫺5.4) ⫺0.7 (⫺6.2 to 4.7) 0.79
10-y Framingham risk score,%
3 mo 0.4 (⫺0.1 to 0.9) ⫺0.5 (⫺1.0 to 0.0) ⫺0.9 (⫺1.6 to⫺0.2) 0.019
6 mo 0.4 (0.0 to 0.8) ⫺0.7 (⫺1.0 to⫺0.3) ⫺1.0 (⫺1.6 to⫺0.5) ⬍0.001
12 mo 0.4 (⫺0.2 to 0.9) ⫺1.0 (⫺1.6 to⫺0.5) ⫺1.4 (⫺2.1 to⫺0.6) ⬍0.001
HDL⫽high-density lipoprotein; LDL⫽low-density lipoprotein.
*From random-effects models that included diet, time, and diet-by-time interaction term. †For the between-group difference at each time point.
‡To convert to mg/dL, divide by 0.0259. §To convert to mg/dL, divide by 0.0113.
㛳To convert to mg/dL, divide by 0.0555. ¶To convert to mg/dL, divide by 88.4.
of 30% of daily energy from carbohydrate. Unlike some previous studies, our trial included men and women who did not have diabetes and CVD at baseline and compre-hensively measured cardiovascular risk profiles.
Our results with regard to body weight are consistent with those of other trials (23, 24) and a recent meta-analysis (25). The underlying mechanisms that may ac-count for differences in weight loss by diet are still not fully identified, but a recent study indicated that low-carbohydrate diets may have a more favorable effect on resting energy expenditure and total energy expenditure than low-fat diets (26). In addition, our findings suggest that the loss of fat mass accounts for most of the reduction in body weight on a low-carbohydrate diet, which is con-sistent with other study findings (19, 21).
We found that a low-carbohydrate diet resulted in a significantly greater reduction in the ratio of total–HDL cholesterol, which has been identified as a strong and in-dependent predictor of CHD (27). This finding is consis-tent with at least 1 previous study (23) but not others that had small sample sizes or high rates of loss to follow-up (20, 21). The decreases in HDL cholesterol and
triglycer-ide levels that we observed were within the range reported in previous weight-loss studies (25).
A major concern that has been frequently raised about low-carbohydrate diets is their potential to elevate LDL cholesterol levels, an established risk factor for CVD (8, 28). In contrast, a recent meta-analysis showed that both low-fat and low-carbohydrate diets reduced LDL choles-terol levels, although the reduction was less for persons assigned to low-carbohydrate diets (25). Our study also found reductions in LDL cholesterol level among partici-pants in both groups, with no significant difference be-tween the groups.
We also observed moderate reductions in blood pres-sure and plasma glucose, serum insulin, and serum creati-nine levels that did not differ significantly between groups. In our study, participants on the low-carbohydrate diet had greater decreases in CRP levels than those on the low-fat diet. Two previous studies that examined CRP levels found no difference between the diets (19, 29); however, both had relatively small sample sizes and may have been underpowered.
Figure 2.Predicted mean changes in body weight, fat mass, total–HDL cholesterol ratio, and triglyceride level in the low-fat and low-carbohydrate diet groups.
Chan g e in Bo d y W e i g h t , kg Baseline 3 mo 6 mo 12 mo –8.0 –7.0 –6.0 –5.0 –4.0 –3.0 –2.0 –1.0 * 0 * * Chan g e in Fa t M ass, % Baseline 3 mo 6 mo 12 mo –2.5 –2.0 –1.5 –1.0 –0.5 0 0.5 1.0 1.5 * * Chan g e in T o t al–HDL Choles t erol Ra t io Baseline 3 mo 6 mo 12 mo –0.8 –0.6 –0.4 –0.2 0 0.2 0.4 * * Chan g e in T ri g lyceri d e Level, mmol/L Baseline 3 mo 6 mo 12 mo –0.4 –0.3 –0.2 –0.1 0 0.1 0.2 * * * Low-fatdiet Low-carbohydrate diet
----Results are from random-effects models and are expressed as means, with error bars representing 95% CIs. To convert triglyceride values to mg/dL, divide by 0.0113. HDL⫽high-density lipoprotein.
The Framingham risk score is a global index of CHD risk used in clinical settings (8, 17, 30). Although it was not a prespecified outcome in our study, we prospectively collected data needed to calculate it. Brinkworth and col-leagues (19) reported a nonsignificant difference in Fra-mingham risk score between a modified Atkins-style low-carbohydrate diet and a low-fat diet among 118 par-ticipants with abdominal obesity and other metabolic syn-drome components. In contrast, in our study, participants randomly assigned to the low-carbohydrate diet had greater decreases in 10-year CHD risk score than those assigned to the low-fat diet; however, the overall level of risk was low in our sample (about 4% over 10 years at baseline). Thus, the clinical significance of this difference is not clear. These different findings may be due to different population char-acteristics or completion rates (roughly 80% in our study vs. 58% in Brinkworth and colleagues’ study). Moreover, these results should be interpreted with caution because of difficulty quantifying the exact amount of uncertainty around an individual’s risk score.
Our conclusions are subject to limitations. First, self-reported dietary information may be subject to memory and recall issues, and participants who complete the dietary recall may be more likely to report adhering to the inter-ventions. However, we collected these within 24 hours of consumption and used multiple 24-hour dietary recalls to reflect weekday and weekend eating patterns. Second, di-etitians were not blinded to the study hypothesis. To avoid potential differences in dietary counseling due to this, we used specific and detailed scripts for all counseling sessions and trained staff to deliver the scripts without deviation. Dietary sessions for both groups were intermittently ob-served for consistency by an independent registered dieti-tian consultant who was not a regular part of the study staff, and all outcome assessors were blinded to the diet group assignment. Third, conclusions from our study are limited by the lack of CVD clinical end points; however, we assessed CVD risk factors extensively. Because of the number of tests performed in the primary analyses, statis-tically significant results should be interpreted with cau-tion, particularlyP values denoting significance levels be-tween 0.01 and 0.05. Finally, although our findings show what can be achieved, they may not be generalizable to more common situations where intensive and repeated di-etary counseling is not available.
Our study has several strengths. All data were collected by trained and certified staff using rigorous quality control protocols. Also, the completion rate was approximately 80% in both diet groups. In addition, this study had high rates of dietary adherence, as shown by 24-hour recall and urinary ketone levels (31). The proportion of participants with detectable urinary ketone levels was significantly higher in the low-carbohydrate group than in the low-fat group at 3, 6, and 12 months (data not shown). Finally, our study included a substantial proportion of black par-ticipants, a group underrepresented in previous trials.
In summary, this 12-month randomized, parallel-group trial showed that a low-carbohydrate diet resulted in greater weight loss and reduction in cardiovascular risk fac-tors than a low-fat diet among obese black and white adults. Restricting carbohydrate may be an option for per-sons who are seeking to lose weight and reduce cardiovas-cular risk factors and should be studied further.
From Tulane University School of Public Health and Tropical Medicine, New Orleans, Louisiana; Kaiser Permanente Southern California, Pasa-dena, California; and Johns Hopkins Bloomberg School of Public Health, Baltimore, Maryland.
Acknowledgment:The authors thank the study participants for their cooperation.
Grant Support:From the National Center for Research Resources of the National Institutes of Health (NIH/NCRR P20-RR017659) to the Tu-lane University Hypertension and Renal Center of Excellence. Disclosures: Disclosures can be viewed at www.acponline.org/authors /icmje/ConflictOfInterestForms.do?msNum⫽M14-0180.
Reproducible Research Statement: Study protocol and data set: Not available. Statistical code: Available from Dr. Bazzano (e-mail, [email protected]).
Requests for Single Reprints:Lydia Bazzano, MD, PhD, MPH, Tu-lane University School of Public Health and Tropical Medicine, 1440 Canal Street, SL-18, Suite 2000, New Orleans, LA 70112; e-mail, [email protected].
Current author addresses and author contributions are available at www.annals.org.
References
1.Go AS, Mozaffarian D, Roger VL, Benjamin EJ, Berry JD, Borden WB, et al; American Heart Association Statistics Committee and Stroke Statistics Subcommittee.Heart disease and stroke statistics—2013 update: a report from the American Heart Association. Circulation. 2013;127:e6-e245. [PMID: 23239837] doi:10.1161/CIR.0b013e31828124ad
2.Halton TL, Willett WC, Liu S, Manson JE, Albert CM, Rexrode K, et al.
Low-carbohydrate-diet score and the risk of coronary heart disease in women. N Engl J Med. 2006;355:1991-2002. [PMID: 17093250]
3.Lagiou P, Sandin S, Lof M, Trichopoulos D, Adami HO, Weiderpass E.
Low carbohydrate-high protein diet and incidence of cardiovascular diseases in Swedish women: prospective cohort study. BMJ. 2012;344:e4026. [PMID: 22735105] doi:10.1136/bmj.e4026
4.Stern L, Iqbal N, Seshadri P, Chicano KL, Daily DA, McGrory J, et al.The effects of low-carbohydrate versus conventional weight loss diets in severely obese adults: one-year follow-up of a randomized trial. Ann Intern Med. 2004;140: 778-85. [PMID: 15148064]
5.Davis NJ, Tomuta N, Schechter C, Isasi CR, Segal-Isaacson CJ, Stein D, et al.Comparative study of the effects of a 1-year dietary intervention of a low-carbohydrate diet versus a low-fat diet on weight and glycemic control in type 2 diabetes. Diabetes Care. 2009;32:1147-52. [PMID: 19366978] doi:10.2337/ dc08-2108
6.Sacks FM, Bray GA, Carey VJ, Smith SR, Ryan DH, Anton SD, et al.
Comparison of weight-loss diets with different compositions of fat, protein, and carbohydrates. N Engl J Med. 2009;360:859-73. [PMID: 19246357] doi: 10.1056/NEJMoa0804748
7.Krauss RM, Eckel RH, Howard B, Appel LJ, Daniels SR, Deckelbaum RJ, et al.AHA Dietary Guidelines: revision 2000: a statement for healthcare
profes-sionals from the Nutrition Committee of the American Heart Association. Cir-culation. 2000;102:2284-99. [PMID: 11056107]
8.National Cholesterol Education Program (NCEP) Expert Panel on Detec-tion, EvaluaDetec-tion, and Treatment of High Blood Cholesterol in Adults (Adult Treatment Panel III).Third Report of the National Cholesterol Education Pro-gram (NCEP) Expert Panel on Detection, Evaluation, and Treatment of High Blood Cholesterol in Adults (Adult Treatment Panel III) final report. Circulation. 2002;106:3143-421. [PMID: 12485966]
9.Stone NJ, Van Horn L.Therapeutic lifestyle change and Adult Treatment Panel III: evidence then and now. Curr Atheroscler Rep. 2002;4:433-43. [PMID: 12361490]
10.Nutrition Data System for Research.The Minnesota Nutrition Data Sys-tem. Minneapolis, MN: Univ of Minnesota; 2005.
11.Pickering TG, Hall JE, Appel LJ, Falkner BE, Graves J, Hill MN, et al; Subcommittee of Professional and Public Education of the American Heart Association Council on High Blood Pressure Research.Recommendations for blood pressure measurement in humans and experimental animals: part 1: blood pressure measurement in humans: a statement for professionals from the Sub-committee of Professional and Public Education of the American Heart Associ-ation Council on High Blood Pressure Research. Hypertension. 2005;45:142-61. [PMID: 15611362]
12.Allain CC, Poon LS, Chan CS, Richmond W, Fu PC.Enzymatic determi-nation of total serum cholesterol. Clin Chem. 1974;20:470-5. [PMID: 4818200] 13.Friedewald WT, Levy RI, Fredrickson DS.Estimation of the concentration of low-density lipoprotein cholesterol in plasma, without use of the preparative ultracentrifuge. Clin Chem. 1972;18:499-502. [PMID: 4337382]
14.Samaha FF, Iqbal N, Seshadri P, Chicano KL, Daily DA, McGrory J, et al.
A low-carbohydrate as compared with a low-fat diet in severe obesity. N Engl J Med. 2003;348:2074-81. [PMID: 12761364]
15.Brehm BJ, Seeley RJ, Daniels SR, D’Alessio DA.A randomized trial com-paring a very low carbohydrate diet and a calorie-restricted low fat diet on body weight and cardiovascular risk factors in healthy women. J Clin Endocrinol Metab. 2003;88:1617-23. [PMID: 12679447]
16.Seshadri P, Iqbal N, Stern L, Williams M, Chicano KL, Daily DA, et al.
A randomized study comparing the effects of a low-carbohydrate diet and a conventional diet on lipoprotein subfractions and C-reactive protein levels in patients with severe obesity. Am J Med. 2004;117:398-405. [PMID: 15380496] 17.Wilson PW, D’Agostino RB, Levy D, Belanger AM, Silbershatz H, Kannel WB.Prediction of coronary heart disease using risk factor categories. Circulation. 1998;97:1837-47. [PMID: 9603539]
18.Molenberghs G, Kenward M.Missing Data in Clinical Studies. Hoboken, NJ: J Wiley; 2007.
19.Brinkworth GD, Noakes M, Buckley JD, Keogh JB, Clifton PM. Long-term effects of a very-low-carbohydrate weight loss diet compared with an
isoca-loric low-fat diet after 12 mo. Am J Clin Nutr. 2009;90:23-32. [PMID: 19439458] doi:10.3945/ajcn.2008.27326
20.Dansinger ML, Gleason JA, Griffith JL, Selker HP, Schaefer EJ. Compar-ison of the Atkins, Ornish, Weight Watchers, and Zone diets for weight loss and heart disease risk reduction: a randomized trial. JAMA. 2005;293:43-53. [PMID: 15632335]
21.Foster GD, Wyatt HR, Hill JO, Makris AP, Rosenbaum DL, Brill C, et al.
Weight and metabolic outcomes after 2 years on a carbohydrate versus low-fat diet: a randomized trial. Ann Intern Med. 2010;153:147-57. [PMID: 20679559] doi:10.7326/0003-4819-153-3-201008030-00005
22.Foster GD, Wyatt HR, Hill JO, McGuckin BG, Brill C, Mohammed BS, et al.A randomized trial of a low-carbohydrate diet for obesity. N Engl J Med. 2003;348:2082-90. [PMID: 12761365]
23.Shai I, Schwarzfuchs D, Henkin Y, Shahar DR, Witkow S, Greenberg I, et al; Dietary Intervention Randomized Controlled Trial (DIRECT) Group.
Weight loss with a low-carbohydrate, Mediterranean, or low-fat diet. N Engl J Med. 2008;359:229-41. [PMID: 18635428] doi:10.1056/NEJMoa0708681 24.Gardner CD, Kiazand A, Alhassan S, Kim S, Stafford RS, Balise RR, et al.
Comparison of the Atkins, Zone, Ornish, and LEARN diets for change in weight and related risk factors among overweight premenopausal women: the A TO Z Weight Loss Study: a randomized trial. JAMA. 2007;297:969-77. [PMID: 17341711]
25.Hu T, Mills KT, Yao L, Demanelis K, Eloustaz M, Yancy WS Jr, et al.
Effects of low-carbohydrate diets versus low-fat diets on metabolic risk factors: a meta-analysis of randomized controlled clinical trials. Am J Epidemiol. 2012;176 Suppl 7:S44-54. [PMID: 23035144] doi:10.1093/aje/kws264
26.Ebbeling CB, Swain JF, Feldman HA, Wong WW, Hachey DL, Garcia-Lago E, et al.Effects of dietary composition on energy expenditure during weight-loss maintenance. JAMA. 2012;307:2627-34. [PMID: 22735432] doi: 10.1001/jama.2012.6607
27.Gardner CD, Fortmann SP, Krauss RM.Association of small low-density lipoprotein particles with the incidence of coronary artery disease in men and women. JAMA. 1996;276:875-81. [PMID: 8782636]
28.Ross R.Atherosclerosis—an inflammatory disease. N Engl J Med. 1999;340: 115-26. [PMID: 9887164]
29.Cardillo S, Seshadri P, Iqbal N.The effects of a low-carbohydrate versus low-fat diet on adipocytokines in severely obese adults: three-year follow-up of a randomized trial. Eur Rev Med Pharmacol Sci. 2006;10:99-106. [PMID: 16875041]
30.U.S. Preventive Services Task Force.Aspirin for the prevention of cardio-vascular disease: U.S. Preventive Services Task Force recommendation statement. Ann Intern Med. 2009;150:396-404. [PMID: 19293072]
31.Larosa JC, Fry AG, Muesing R, Rosing DR.Effects of high-protein, low-carbohydrate dieting on plasma lipoproteins and body weight. J Am Diet Assoc. 1980;77:264-70. [PMID: 7410754]
Current Author Addresses:Drs. Bazzano, Hu, Yao, Whelton, and He; Ms. Bunol; Ms. Liu; and Ms. Chen: Department of Epidemiology, Tu-lane University School of Public Health and Tropical Medicine, 1440 Canal Street, SL-18, Suite 2000, New Orleans, LA 70112.
Dr. Reynolds: Kaiser Permanente Southern California, 100 South Los Robles, 2nd Floor, Pasadena, CA 91101.
Dr. Klag: Johns Hopkins Bloomberg School of Public Health, 615 North Wolfe Street, Room W1041, Baltimore, MD 21205.
Author Contributions:Conception and design: L.A. Bazzano, T. Hu, K. Reynolds, L. Yao, M.J. Klag, J. He.
Analysis and interpretation of the data: L.A. Bazzano, T. Hu, Y. Liu, C.S. Chen, M.J. Klag, P.K. Whelton, J. He.
Drafting of the article: L.A. Bazzano, T. Hu.
Critical revision of the article for important intellectual content: L.A. Bazzano, T. Hu, K. Reynolds, L. Yao, P.K. Whelton, J. He.
Final approval of the article: L.A. Bazzano, K. Reynolds, M.J. Klag, P.K. Whelton, J. He.
Provision of study materials or patients: L.A. Bazzano, C. Bunol. Statistical expertise: T. Hu, C.S. Chen.
Obtaining of funding: L.A. Bazzano.
Administrative, technical, or logistic support: L.A. Bazzano, L. Yao, C. Bunol.
Chan g e in Lean Mass, % Baseline 3 mo 6 mo 12 mo –1.5 –1.0 –0.5 0 0.5 1.0 1.5 2.0 * 2.5 * * Chan g e in T o t al Choles t erol Level, mmol/L Baseline 3 mo 6 mo 12 mo –0.3 –0.2 –0.1 0 0.1 0.2 0.3 Chan g e in LDL Choles t erol Level, mmol/L Baseline 3 mo 6 mo 12 mo –0.3 –0.2 –0.1 0 0.1 0.2 0.3 Chan g e in HDL Choles t erol Level, mmol/L Baseline 3 mo 6 mo 12 mo –0.2 –0.1 0 0.1 0.2 0.3 0.4 * * Chan g e in 10-y Framin g
ham Risk Score,
% Baseline 3 mo 6 mo 12 mo –2.0 –1.5 –1.0 –0.5 0 0.5 1.0 1.5 * * * Low-fatdiet Low-carbohydrate diet
----Results are from random-effects models and are expressed as means, with error bars representing 95% CIs. To convert cholesterol values to mg/dL, divide by 0.0259. HDL⫽high-density lipoprotein; LDL⫽low-density lipoprotein.
Variable PredictedMean Difference (95% CI)* P Value†
Low-Fat Diet (nⴝ73) Low-Carbohydrate Diet (nⴝ75) Mean Difference in Change
Body weight,kg 3 mo ⫺3.5 (⫺4.8 to⫺2.3) ⫺6.4 (⫺7.6 to⫺5.1) ⫺2.8 (⫺4.6 to⫺1.1) 0.002 6 mo ⫺3.2 (⫺4.7 to⫺1.7) ⫺6.4 (⫺7.9 to⫺4.9) ⫺3.2 (⫺5.3 to⫺1.0) 0.004 12 mo ⫺2.6 (⫺5.1 to⫺0.1) ⫺6.5 (⫺9.0 to⫺4.0) ⫺3.9 (⫺7.4 to⫺0.4) 0.032 Waist circumference,cm 3 mo ⫺2.7 (⫺4.3 to⫺1.0) ⫺6.1 (⫺7.7 to⫺4.6) ⫺3.5 (⫺5.7 to⫺1.2) 0.004 6 mo ⫺4.1 (⫺5.8 to⫺2.3) ⫺6.4 (⫺8.1 to⫺4.7) ⫺2.4 (⫺4.8 to 0.1) 0.053 12 mo ⫺6.8 (⫺9.6 to⫺4.1) ⫺7.0 (⫺9.8 to⫺4.3) ⫺0.2 (⫺4.1 to 3.7) 0.91 Fat mass,% 3 mo ⫺0.3 (⫺1.2 to 0.7) ⫺1.4 (⫺2.4 to⫺0.4) ⫺1.1 (⫺2.5 to 0.3) 0.119 6 mo ⫺0.2 (⫺1.1 to 0.7) ⫺1.5 (⫺2.5 to⫺0.6) ⫺1.3 (⫺2.6 to 0.0) 0.050 12 mo ⫺0.10 (⫺1.4 to 1.4) ⫺1.8 (⫺3.2 to⫺0.4) ⫺1.8 (⫺3.8 to 0.2) 0.083 Lean mass,% 3 mo 0.7 (⫺0.4 to 1.7) 1.7 (0.7 to 2.8) 1.1 (⫺0.4 to 2.6) 0.156 6 mo 0.2 (⫺0.7 to 1.2) 1.6 (0.6 to 2.7) 1.4 (⫺0.0 to 2.8) 0.052 12 mo ⫺0.6 (⫺1.9 to 0.8) 1.5 (0.1 to 2.8) 2.1 (0.1 to 4.0) 0.037
Systolic blood pressure,mm Hg
3 mo ⫺2.0 (⫺4.7 to 0.6) ⫺6.2 (⫺8.9 to⫺3.6) ⫺4.2 (⫺8.1 to⫺0.3) 0.034
6 mo ⫺2.8 (⫺5.4 to⫺0.3) ⫺4.4 (⫺7.0 to⫺1.9) ⫺1.6 (⫺5.3 to 2.1) 0.39
12 mo ⫺4.4 (⫺7.9 to⫺1.0) ⫺0.8 (⫺4.3 to 2.7) 3.7 (⫺1.3 to 8.6) 0.146
LDL cholesterol level,mmol/L‡
3 mo 0.09 (⫺0.10 to 0.28) ⫺0.04 (⫺0.23 to 0.16) ⫺0.13 (⫺0.40 to 0.14) 0.34
6 mo 0.08 (⫺0.09 to 0.24) ⫺0.02 (⫺0.18 to 0.15) ⫺0.09 (⫺0.32 to 0.14) 0.42
12 mo 0.04 (⫺0.20 to 0.29) 0.03 (⫺0.22 to 0.27) ⫺0.02 (⫺0.37 to 0.33) 0.91
HDL cholesterol level,mmol/L‡
3 mo ⫺0.08 (⫺0.15 to⫺0.01) 0.03 (⫺0.04 to 0.10) 0.11 (0.01 to 0.21) 0.031
6 mo ⫺0.05 (⫺0.12 to 0.01) 0.11 (0.05 to 0.18) 0.17 (0.08 to 0.26) ⬍0.001
12 mo ⫺0.01 (⫺0.11 to 0.09) 0.27 (0.17 to 0.38) 0.28 (0.14 to 0.42) ⬍0.001
Total–HDL cholesterol ratio
3 mo 0.3 (0.1 to 0.5) ⫺0.2 (⫺0.4 to 0.1) ⫺0.4 (⫺0.7 to⫺0.1) 0.007
6 mo 0.2 (0.1 to 0.4) ⫺0.3 (⫺0.5 to⫺0.1) ⫺0.5 (⫺0.8 to⫺0.2) ⬍0.001
12 mo 0.1 (⫺0.2 to 0.4) ⫺0.5 (⫺0.8 to⫺0.2) ⫺0.6 (⫺1.1 to⫺0.1) 0.017
Triglyceride level,mmol/L§
3 mo ⫺0.02 (⫺0.23 to 0.19) ⫺0.29 (⫺0.50 to⫺0.08) ⫺0.28 (⫺0.57 to 0.02) 0.069
6 mo ⫺0.06 (⫺0.24 to 0.13) ⫺0.31 (⫺0.49 to⫺0.13) ⫺0.26 (⫺0.51 to 0.00) 0.051
12 mo ⫺0.13 (⫺0.33 to 0.07) ⫺0.34 (⫺0.55 to⫺0.14) ⫺0.21 (⫺0.50 to 0.07) 0.140
C-reactive protein level,nmol/L
3 mo 5.7 (⫺5.7 to 18.1) ⫺10.5 (⫺21.9 to 1.9) ⫺16.2 (⫺33.3 to 1.0) 0.062
6 mo 3.8 (⫺6.7 to 14.3) ⫺8.6 (⫺19.0 to 1.0) ⫺13.3 (⫺27.6 to 1.9) 0.078
12 mo ⫺0.0 (⫺17.1 to 16.2) ⫺6.7 (⫺23.8 to 9.5) ⫺6.7 (⫺29.5 to 17.1) 0.57
10-y Framingham risk score,%
3 mo 0.9 (⫺0.1 to 1.9) ⫺0.6 (⫺1.5 to 0.4) ⫺1.5 (⫺2.9 to⫺0.1) 0.037
6 mo 0.7 (⫺0.1 to 1.4) ⫺0.8 (⫺1.5 to⫺0.1) ⫺1.5 (⫺2.5 to⫺0.4) 0.006
12 mo 0.4 (⫺0.6 to 1.4) ⫺1.0 (⫺2.0 to⫺0.0) ⫺1.4 (⫺2.8 to 0.0) 0.053
HDL⫽high-density lipoprotein; LDL⫽low-density lipoprotein.
*From random-effects models that included diet, time, and diet-by-time interaction term. †For the between-group difference at each time point.
‡To convert to mg/dL, divide by 0.0259. §To convert to mg/dL, divide by 0.0113.
Variable PredictedMean Difference (95% CI)* P Value†
Low-Fat Diet (nⴝ73) Low-Carbohydrate Diet (nⴝ75) Mean Difference in Change
Body weight,kg 3 mo ⫺1.8 (⫺3.1 to⫺0.6) ⫺5.2 (⫺6.4 to⫺4.0) ⫺3.3 (⫺5.1 to⫺1.6) ⬍0.001 6 mo ⫺1.6 (⫺2.9 to⫺0.2) ⫺4.9 (⫺6.2 to⫺3.6) ⫺3.3 (⫺5.2 to⫺1.5) ⬍0.001 12 mo ⫺1.1 (⫺3.1 to 0.9) ⫺4.4 (⫺6.3 to⫺2.5) ⫺3.3 (⫺6.1 to⫺0.5) 0.019 Waist circumference,cm 3 mo ⫺4.3 (⫺6.0 to⫺2.7) ⫺5.0 (⫺6.6 to⫺3.4) ⫺0.6 (⫺3.0 to 1.7) 0.59 6 mo ⫺4.1 (⫺5.9 to⫺2.4) ⫺5.5 (⫺7.2 to⫺3.8) ⫺1.4 (⫺3.9 to 1.1) 0.27 12 mo ⫺3.7 (⫺6.3 to⫺1.1) ⫺6.6 (⫺9.1 to⫺4.1) ⫺2.9 (⫺6.5 to 0.8) 0.119 Fat mass,% 3 mo ⫺0.2 (⫺1.0 to 0.6) ⫺0.9 (⫺1.6 to⫺0.1) ⫺0.7 (⫺1.8 to 0.4) 0.193 6 mo 0.1 (⫺0.6 to 0.9) ⫺0.8 (⫺1.5 to⫺0.1) ⫺1.0 (⫺2.0 to 0.0) 0.060 12 mo 0.7 (⫺0.3 to 1.8) ⫺0.8 (⫺1.7 to 0.2) ⫺1.5 (⫺2.9 to⫺0.1) 0.037 Lean mass,% 3 mo 0.2 (⫺0.6 to 1.0) 1.5 (0.7 to 2.3) 1.3 (0.2 to 2.4) 0.026 6 mo 0.0 (⫺0.7 to 0.8) 1.4 (0.7 to 2.1) 1.4 (0.3 to 2.4) 0.013 12 mo ⫺0.3 (⫺1.3 to 0.7) 1.2 (0.2 to 2.1) 1.5 (0.1 to 2.9) 0.039
Systolic blood pressure,mm Hg
3 mo ⫺2.8 (⫺5.2 to⫺0.3) ⫺2.6 (⫺4.9 to⫺0.3) 0.1 (⫺3.3 to 3.6) 0.93
6 mo ⫺1.5 (⫺3.7 to 0.8) ⫺1.7 (⫺3.8 to 0.5) ⫺0.2 (⫺3.3 to 3.0) 0.91
12 mo 1.1 (⫺2.2 to 4.4) 0.3 (⫺3.0 to 3.5) ⫺0.9 (⫺5.5 to 3.8) 0.71
LDL cholesterol level,mmol/L‡
3 mo ⫺0.01 (⫺0.16 to 0.16) 0.04 (⫺0.11 to 0.19) 0.04 (⫺0.18 to 0.26) 0.72
6 mo ⫺0.05 (⫺0.19 to 0.09) ⫺0.03 (⫺0.16 to 0.11) 0.02 (⫺0.17 to 0.21) 0.83
12 mo ⫺0.13 (⫺0.35 to 0.08) ⫺0.15 (⫺0.36 to 0.06) ⫺0.02 (⫺0.32 to 0.28) 0.91
HDL cholesterol level,mmol/L‡
3 mo 0.01 (⫺0.08 to 0.10) 0.04 (⫺0.05 to 0.12) 0.02 (⫺0.10 to 0.15) 0.69
6 mo 0.02 (⫺0.03 to 0.12) 0.10 (0.02 to 0.17) 0.05 (⫺0.06 to 0.16) 0.37
12 mo 0.11 (0.01 to 0.22) 0.21 (0.11 to 0.32) 0.10 (⫺0.05 to 0.26) 0.190
Overall – – – 0.98
Total–HDL cholesterol ratio
3 mo ⫺0.0 (⫺0.2 to 0.2) ⫺0.1 (⫺0.3 to 0.1) ⫺0.1 (⫺0.4 to 0.3) 0.70
6 mo ⫺0.1 (⫺0.3 to 0.1) ⫺0.2 (⫺0.4 to⫺0.0) ⫺0.1 (⫺0.4 to 0.1) 0.34
12 mo ⫺0.2 (⫺0.4 to 0.1) ⫺0.5 (⫺0.7 to⫺0.2) ⫺0.3 (⫺0.6 to 0.1) 0.112
Triglyceride level,mmol/L§
3 mo 0.10 (⫺0.01 to 0.22) ⫺0.14 (⫺0.25 to⫺0.03) ⫺0.24 (⫺0.40 to⫺0.08) 0.003
6 mo 0.07 (⫺0.03 to 0.17) ⫺0.13 (⫺0.23 to⫺0.04) ⫺0.20 (⫺0.34 to⫺0.07) 0.004
12 mo ⫺0.00 (⫺0.12 to 0.12) ⫺0.13 (⫺0.25 to⫺0.01) ⫺0.13 (⫺0.30 to 0.04) 0.137
C-reactive protein level,nmol/L
3 mo 1.9 (⫺12.4 to 16.2) 1.9 (⫺11.4 to 15.2) ⫺0.0 (⫺19.0 to 19.0) 0.99
6 mo 6.7 (⫺4.8 to 17.1) ⫺1.0 (⫺10.5 to 9.5) ⫺6.7 (⫺21.9 to 8.6) 0.36
12 mo 16.2 (4.8 to 26.7) ⫺4.8 (⫺15.2 to 5.7) ⫺21.0 (⫺36.2 to⫺4.8) 0.010
10-y Framingham risk score,%
3 mo 0.0 (⫺0.6 to 0.6) ⫺0.3 (⫺0.8 to 0.2) ⫺0.3 (⫺1.1 to 0.5) 0.44
6 mo 0.1 (⫺0.3 to 0.6) ⫺0.5 (⫺0.9 to⫺0.1) 0.6 (⫺1.2 to 0.0) 0.050
12 mo 0.3 (⫺0.3 to 1.0) ⫺0.8 (⫺1.4 to⫺0.2) 1.2 (⫺2.0 to⫺0.3) 0.009
HDL⫽high-density lipoprotein; LDL⫽low-density lipoprotein.
*From random-effects models that included diet, time, and diet-by-time interaction term. †For the between-group difference at each time point.
‡To convert to mg/dL, divide by 0.0259. §To convert to mg/dL, divide by 0.0113.
Symptom Participants (95% CI),n P Value* Low-Fat Diet (nⴝ73) Low-Carbohydrate Diet (nⴝ75) Constipation 3 mo 13 (7–24) 19 (11–30) 0.38 6 mo 19 (11–31) 18 (10–29) 0.84 12 mo 17 (9–28) 11 (5–22) 0.40 Fatigue 3 mo 9 (4–19) 17 (10–28) 0.156 6 mo 22 (13–33) 18 (10–29) 0.57 12 mo 16 (8–27) 15 (8–26) 0.91 Headache 3 mo 18 (11–30) 6 (2–15) 0.030 6 mo 16 (8–27) 12 (6–23) 0.57 12 mo 22 (13–34) 11 (5–21) 0.110 Thirst 3 mo 6 (2–15) 14 (8–25) 0.125 6 mo 9 (4–20) 12 (6–23) 0.65 12 mo 10 (5–20) 12 (6–23) 0.81 Polyuria 3 mo 8 (3–17) 3 (1–10) 0.23 6 mo 5 (1–15) 4 (1–12) 0.76 12 mo 4 (1–14) 2 (0–10) 0.39 Diarrhea 3 mo 5 (2–14) 4 (1–13) 0.94 6 mo 5 (2–15) 5 (2–15) 0.99 12 mo 3 (1–13) 1 (0–13) 0.60 Heartburn 3 mo 12 (6–23) 7 (3–16) 0.40 6 mo 11 (5–22) 6 (2–17) 0.38 12 mo 18 (10–31) 9 (4–19) 0.141 Gas 3 mo 15 (9–26) 19 (11–30) 0.59 6 mo 22 (13–35) 17 (10–29) 0.51 12 mo 23 (14–35) 16 (9–27) 0.32 Nausea† 3 mo 2 4 – 6 mo 2 0 – 12 mo 3 0 – Vomiting† 3 mo 0 1 – 6 mo 0 0 – 12 mo 0 0 – Decreased appetite† 3 mo 1 3 – 6 mo 2 0 – 12 mo 2 1 –
*For the between-group difference at each time point.